


 Servicios personalizados
 texto en
  Inglés (pdf)
 Articulo en XML
 Referencias del artículo
 Enviar articulo por email
 Citado por SciELO
  Similares en
SciELO
Similares en
SciELO 
 Permalink
INTRODUCTION
In order to achieve efficient storage of bulk agricultural grains, the product must undergo drying and aeration operations. The adequate execution of these processes prolongs the storage period and avoids the deterioration of the product, which results from its biological activity.
Thus, a mass of air is generally forced to pass through the agricultural product; the air, finding resistance of the granular product to its passage, flows through the intergranular spaces. The determination of the resistance to the air flow for agricultural products can be measured by the drop of pressure, being fundamental in projects of drying and aeration systems ((Brandão et al., 2016; Korese et al., 2016; Olatunde et al., 2016; Gao et al., 2018).
The resistance to airflow in drying and aeration systems depends on several factors, such as: air flow intensity, grain layer height, impurities in the product, size, shape, moisture content, grain distribution in the mass granular, and roughness of the product (Brooker et al., 1992).
The method of filling the grain column, its compaction, and the direction of the air flow influence the resistance of a product to the passage of air flow. In these systems, perforated plates, perforated ducts and pipelines are responsible for an increase in pressure drop (Gratão et al., 2013; Teixeira et al., 2015).
Corrêa et al. (2001) studied the effects of airflow density, size and quantity of impurities on the static pressure drop in granular bean masses and adjusted the basic empirical mathematical models according to the data obtained. Other researchers studied the variation of static pressure along a column of dried husk of coffee cherry, as a function of air flow density, moisture content, apparent specific mass, and product layer depth (Afonso, 1994).
Theoretically, the problem of fluid flow is defined by the laws of mass, momentum, and energy conservation. When the following constraints are considered: (a) the fluid is Newtonian, (b) the fluid is incompressible, (c) there is no phase change, (d) the flow is isothermal and permanent, (e) the spatial domain of the problem does not change over time and (f) the viscosity of the fluid is constant, the Navier-Stokes equation is given by Equation 01.
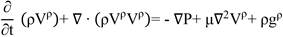 (Eq. 01)
Thus, Equation 01 can be rewritten as a function of the components x, y and, z (Equation 02).
 (Eq. 02.a)
 (Eq. 02.b)
 (Eq. 02.c)
Several researchers have experimentally determined the pressure drop in columns of agricultural products (Iqbal et al., 2015, Dilmac et al., 2016, Du et al., 2016 and Horabik et al., 2016).
In addition, other researchers have studied expressing the pressure gradient as a function of the airflow imposed on a column of grains (Shedd, 1953; Hukill and Ives, 1955; Haque et al., 1978; Hunter, 1983; Giner and Denisienia, 1996).
Numerical techniques have been widely used in solving problems of fluid flow. Among them, the technique of finite elements has been used with success by the researchers for the resolution of different problems, involving drainage of air in agricultural products, such as the drying (Beigi, 2017, Chiang et al., 2017and Lemus-Mondaca et al.,2017). And for the distributed resistance others have also used it (De Andrade et al., 2001, Khatchatourian and Savierscki, 2004, Devilla et al., 2005, Yue and Zhang, 2014 and Moses et al., 2015).
Thus, the general objectives of this work were (1) to analyze, through the finite element technique, the static pressure drop in a bed filled with coffee, submitted to different air flows and water contents; (2) to determine the permeability of the bed to the different air flows and water contents.
METHODS
Particle Bed and Airflow
The pressure drops were simulated in a duct of circular cross-section (0.3050 m diameter) with a length of 1.00 m, vertically positioned. The duct was filled with grains of Coffea arabica L. (cv Catuaí). To analyze the effect of moisture content on the resistance to airflow, two samples of clean grains were conditioned to the following moisture levels: 12.7 and 23.5% w.b. The imposed airflows at the entrance of the bed were 0.165, 0.253 and 0.263 m3 s-1 m-2.
Finite Element Analysis
The determination of the profile of pressure and velocity in problems of fluid flow in ducts without particles was obtained through the finite element technique assisted by interactive software for analyzing systems, ANSYS®, commercially available.
The input files, which were considered for the computational programs developed, were the properties of the fluid, the boundary conditions on all open or closed surfaces of the system, and the type of analysis to be performed. The contour conditions on opened surfaces were the velocity, pressure or combinations of these parameters; as a result, the velocity and pressure distributions at the nodes from the discretization of the system were obtained.
In this work, the software ANSYS 15.0 was used to develop a source program that performs a three-dimensional analysis of the airflow in a fixed column of coffee beans. The product inside the column was considered equivalent to a distributed resistance inside the duct, which correspond to the terms Rx, Ry and Rz, in Equations (2a-b-c).
Therefore, the geometry of the porous medium was disregarded. Then, the flow resistance was modeled as a distributed resistance. As observed in Equation (03), such resistance may be due to one or a combination of the following factors: a localized loss of pressure (F); a friction factor (f) or a factor (C) related to the permeability (K) where C = 1 / K. Thus, the total pressure gradient, in the x direction, can be expressed by ANSYS (2013):
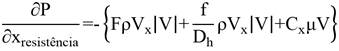 (Eq. 03)
The duct was divided into 1440 elements of type FLUID142, with eight nodes, resulting in 1927 nodes at the end of the discretization, as shown in Figure 1. The inputs of the source program were the air properties (assumed constant), the value of C, referred to in the text as RD1 (distributed resistance) and boundary conditions, which, by the structure of the computational program, were imposed on all surfaces, open or closed, that delimited the medium being investigated.
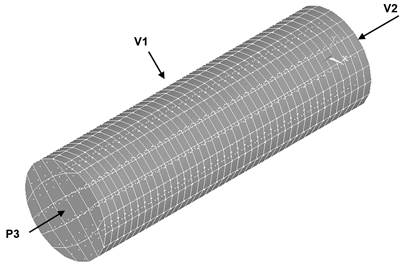
Therefore, boundary conditions were: (1) zero velocities (V1), according to the three coordinate axes, on the inner side wall of the duct; (2) constant and evenly distributed velocity (V2) at the base of the duct, and (3) pressure (P3) equal to zero (reference) at all nodes at the upper end of the duct.
Comparison of Models
To describe the behavior of the static pressure as a function of the water content, column depth and flow density for the pulped coffee without impurities, the pressure drop of the air flowing through a column of coffee beans, determined by the finite element technique, were compared to those from the coefficients of the quadratic equations adjusted. (Da Silva et al., 2006)
The authors found that the actual specific mass, apparent specific mass and porosity for the pulped coffee with water content of 12.7% were 0.7929 g cm -3, 0.3879 g cm -3 and 51, 59%, respectively. While samples with 23.5% w.b. had 0.8685 g cm-3, 0.4635 g cm-3 and 48.35%, respectively (Table 1). The validity of the model proposed by the authors is for depths ranging from 0.00 to 0.95 m and for flows between 0.16 and 0.26 m3 s-1 m-2.
TABLE 1 Coefficients of the quadratic equation (AU + bU2 + cP + dP2 + eF + fF2 + gUF + hFP + iUP + j) adjusted to describe the behavior of the static pressure as a function of moisture content (U), column depth (P) and flow density (F) for the pulped coffee (Da Silva et al., 2006)
| Coefficients | a | b | c | d | e | f | g | h | i | j |
|---|---|---|---|---|---|---|---|---|---|---|
| -1,31 | 0 | 95,71 | 27,63 | -651,14 | 1.202,38 | 6,62 | 1.355,89 | -1,26 | 83,23 |
RESULTS AND DISCUSSION
Figure 2 presents the contour plot of the static pressures of the sample with 12.7% of water content, without impurity and with air flow of 0.165 m3 s-1 m-2, simulated by ANSYS. It can be observed that along the column, from the axis of the coordinates (X, Y, Z), the values obtained decrease. According to the simulated data, the maximum and minimum pressures in the column are located, respectively, in the coordinate axis and at the top of the column, being 374.9 Pa and 0 Pa.
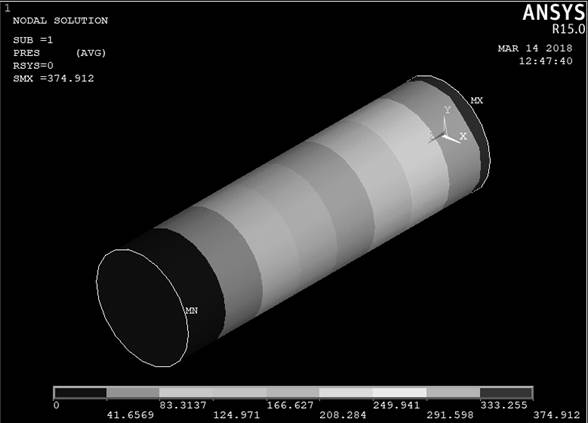
FIGURE 2 Nodal solution of the coffee pulped with water content in 12,7% b.u. and airflow in 0,165 m3∙s-1∙m-2.
The simulations of the pressure variations at different depths of a column of coffee pulped with water content in 12.7% b.u. for different air flows are shown in Figure 3 (a), and for samples with water content of 23.5% b.u., the results are shown in Figure 3 (b).
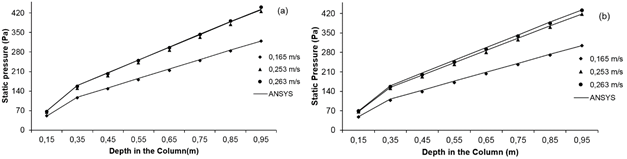
FIGURE 3 Pressure drop as a function of depth in a column of coffee pulped with water contents of (a) 12,7% w.b. and (b) 23,5% w.b, for different airflows (m3 s-1 m-2).
It could be observed that the density of the airflow is directly related to the resistance of the airflow, as well as to the depth in the coffee column. As expected, static pressure values increase with increasing density of airflow applied to the mass. On the other hand, no difference in static pressure was observed between treatments with different water contents of the pulped coffee analyzed.
The relative percentage errors corresponding to the pressure drops obtained by the simulation are presented in Figure 4 (a), for samples with water content of 12.7% and in Figure 4 (b), for samples with water content of 23.5 %. It is seen in Figure 4 that the relative error values decrease the extent to which the product layer is increased, which is in agreement with the data obtained by Moses et al. (2014a, 2014b, 2014c).
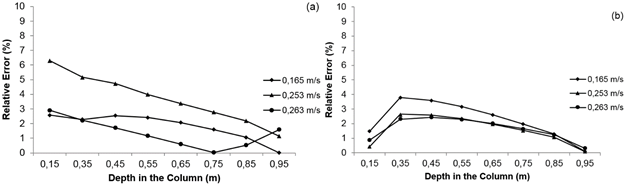
FIGURE 4 Relative errors involved in the simulated values for the pressure drop in the depths of coffee beans with water contents of (a) 12.7% w.b. and (b) 23.5% w.b., for different airflows (m3 s-1 m-2).
For each airflow, these errors represent the values obtained by the model that satisfactorily describes the data obtained by Da Silva et al. (2006). It is observed that the model implemented using ANSYS® program, provides reliable estimates, where all airflows tested have relative errors smaller than 7%.
Table 2 presents the values of the distributed resistances (RD1) of the pulped coffee bed, for various airflows, according to the optimization process and relative errors involved in the optimization. For such values of distributed resistance, the average of 7.2 x 10⁷ m-2 was obtained, considering all the airflows used.
TABLE 2 Distributed resistances (RD1) of the pulped coffee bed for various airflows according to the optimization process and relative errors for various airflows and moisture contents
| Water Content (%) | Airflow (m3s-1m-2) | RD1 (m-2) | Average Relative Error |
|---|---|---|---|
| 12,7 | 1,650E-01 | 7,964E+07 | 1,496E-05 |
| 2,530E-01 | 7,027E+07 | 1,144E-02 | |
| 2,630E-01 | 6,785E+07 | 3,190E-03 | |
| 23,5 | 1,650E-01 | 7,590E+07 | 1,009E-03 |
| 2,530E-01 | 6,807E+07 | 9,167E-04 | |
| 2,630E-01 | 6,785E+07 | 3,190E-03 |
Ergun (1957) provides an expression to determine permeability (which is considered constant) of a packed bed of particles with homogeneous spheres. Thus, it was verified that the permeability, by the Ergun equation, is 4.94 x 10⁻⁸ m2, for a diameter of 5.8 mm and a porosity of 42.5%.
Moreover, on the analyzed considerations, the permeability of the bed reached a mean of 1.39 x 10⁻⁸ m, where the permeability is inversely proportional to the distributed resistance.
CONCLUSIONS
Analyses of the results obtained in this work allow the following conclusions about the pressure drop across a bed of coffee beans:
By varying the depth in the column, the static pressure increases with higher water content or higher air flow density;
Considering the flow densities and the depths used in the bed, the values obtained by ANSYS software 15.0.1, reliably describe the ones obtained by the model of Da Silva et al. (2006).
The distributed resistances of the coffee bed determined from simulations using the finite element technique have a mean of all fluxes and water contents of 7.16 x 10⁷ m -2, with average relative error of 3.29 x 10⁻³ m2, showing a tendency to decrease with increasing airflow density.
Ergun equation, used to estimate the resistance offered to the airflow by a column of spherical and homogeneous particles, is not reasonable to predict the resistance of the coffee beds submitted to different flow densities and water contents.

