Introduction
The loss of electrical energy is present in the entire electrical power system (EPS), from generation to distribution. Losses are characterized by the energy produced but not traded, and they are classified into Technical Losses (TL) and Non-Technical Losses (NTL) [1]. The knowledge of the level of energy losses and their characteristics are crucial to assess the operating condition of the network, the efficiency of energy supply and the effectiveness of actions aimed at reducing losses.
Most energy distribution companies in developing countries have high rates of energy losses due to the share of NTL. The NTL in these companies can represent up to 40% of the total generation capacity. The poor infrastructure in these countries makes it difficult to detect and control the potential causes of NTL. Losses affect the quality of supply and the electricity tariff paid by regular customers [2].
Specifically, high rates of NTL activities have been reported in most developing countries in Southeast Asia, which include Malaysia, Indonesia, Thailand, Myanmar and Vietnam [3]. In the light of this problem, other developing countries, such as Bangladesh, India, Pakistan and Lebanon, have an average loss rate between 20% and 30% [4-5]. The problem of NTL is not only faced by the least developed countries in regions of Asia and Africa, but also by developed countries such as the United States of America and the United Kingdom [3]. In [6], total loss rates between 6,57% and 12,36% of the total injected energy in Poland are detailed, as a result of the variation in NTL directly influenced by investment in infrastructure. Transmission and distribution losses worldwide are greater than the total installed generation capacity in countries such as Germany, UK and France [2]. It is estimated that NTL cost distribution companies worldwide approximately US$96 billion per year [7].
In Brazil, in 2020, NTL represented 7,3% of the total energy injected into the system, which is equivalent to 37,9 TWh at a cost of 8,6 billion reais (about US$ 1,7 billion) considering the average price of energy from the tariff processes [8]. Given the above, identifying the problems that cause NTL in electric energy distribution circuits arouses the interest of both academy and companies. In [2], factors that influence illegal energy consumption are reported, such as: price, illiteracy rate, unemployment rate, among others. In the literature, there are frequent works that propose the development of computational models to detect fraudulent consumers [9, 10, 11]. However, it is difficult to find studies based on real data, without biases or filters, capable of identifying common characteristics of distribution circuits with high loss rates.
Thus, this article deals with a case study, which proposes to analyze information collected in circuits in a Brazilian city, based on observations carried out under three circumstances. The first one carried out before the application of measures to combat NTL, the second carried out right after the interferences, and the last one reflects the current state of each circuit. The time interval between the second and the last information collection vary from 6 to 11 years. The analysis of these observations aims to characterize the anatomy and involution of losses in these regions.
In the next session, concepts about energy losses and Pearson’s correlation test are presented. The methodology applied in the data analysis is described below. Afterwards, there is the session that will present the results, and then, the conclusions of the work.
Materials and methods
Energy Losses
Global Energy Losses can be defined as electrical energy generated that travels through transmission lines and distribution networks, but which is not commercialized, either for commercial or technical reasons [10, 12, 13].
Technical Losses (TL) are inherent to the process of energy transport, transmission and distribution, and consist mainly of energy dissipation caused by the physical properties of electrical components, related to the substation, the transformer and the line [14]. As presented in [15], the resistive losses of primary feeders, distribution transformer, secondary network, service branch and energy meters are included in this context. According to [1], technical losses are inevitable, however they can be reduced with the development of new technologies, and with predictive, preventive and corrective maintenance.
Non-Technical Losses (NTL), also called commercial losses, are caused by the lack of billing of part of the distributed energy [14]. In [10], some types of NTL are presented: energy theft, supply fraud, meter failures and reading errors. In a broad context [16], they define fraud as the dishonest or illegal use of electricity equipment or services with the intention of preventing correct billing. According to [17], energy theft is characterized by clandestine connections, direct deviations from the network, without any form of charging, while energy fraud occurs due to tampering with the metering system, which causes errors in charging for energy consumed. Measuring equipment failures are caused by the deterioration of the meter's internal instruments, which in turn cause an incomplete record of consumed energy [18]. According to [19], billing errors are caused by the inefficiency of the concessionaires’ commercial system. In [16], they highlight that errors occur during the reading collection process or due to systemic failures during billing.
While the TL are calculated by modeling techniques, the NTL are determined by the difference between the total losses in the distribution and the PT [19, 20, 21, 22].
NTL caused by illegal consumers connected to the distribution network, affect the quality of the energy supplied, cause overload, and infer the electricity tariff of regular consumers [2]. In addition, clandestine electricity connections can cause electric shocks and fires, which compromise the safety of electricity services. According to [1], the impact of the NTL on the electricity tariff passed on to the consumer is dimensioned by means of regulatory values obtained from the concessionaires’ efficiency criteria. However, distributors that do not meet the regulatory limit for NTL are penalized with a reduction in the tariff transfer. To avoid penalties, optimize revenues and improve energy supply conditions, concessionaires must promote efficient actions to combat NTL.
There are many tools for finding, detecting and controlling NTL. Some mechanisms were presented in [23], such as smart metering, telemetry monitoring, physical inspection and management methods. In countries, where resources are scarce, and smart grid technology is far from reality, the installation of meters along feeders for energy balance allows to accurately estimate NTL [24]. These balances consist of comparing the total energy consumed (measured and billed) by customers, with the total energy generated or delivered to distribution substations [19]. The difference between the energy measured at the feeder and the energy billed by the utility, plus TL, indicates the volume of NTL.
Pearson Correlation Coefficient (r)
Pearson’s correlation coefficient is a measure of association widely used in different areas of scientific research [25]. For [26], correlation refers to the linear relationship between variables, so that the correlation coefficient is a measure of the association between two numerical variables. In [27], it was stated that a correlation measures the direction and strength of the linear relationship between two quantitative variables.
Pearson’s correlation coefficient ranges between - 1 and 1. The sign indicates the direction of the correlation (negative or positive) while the value indicates the magnitude. The closer to 1, the stronger the level of linear association between variables [28]. In table 1, interpretations of the correlation coefficient presented in [29, 30, 31] are compared.
Table 1 Comparative between Practical Rules for Interpreting the Correlation Coefficient [29, 30, 31]
| Correlation Interpretation | Size of Correlation | ||
|---|---|---|---|
| Very High | _ | _ | 0,90 to 1,00 |
| High | 0,50 to 1,00 | above 0,70 | 0,70 to 0,90 |
| Moderate | 0,30 to 0,49 | 0,40 to 0,60 | 0,50 to 0,70 |
| Weak | 0,10 to 0,29 | up to 0,30 | 0,30 to 0,50 |
| Negligible | _ | _ | 0 to 0,30 |
To calculate the Pearson correlation coefficient between the variables x and y, equation (1), below is used:
Where x i and y i are the values of the ith individual.
Both the mean and the variance play a central role in estimating this coefficient. Based on [27], this work highlights two conditions that must be satisfied for Pearson’s correlation analysis. The first states that to estimate Pearson’s correlation, all variables must be discrete and/or continuous quantitative. The other announces that the coefficient is affected by the presence of conflicting values, known as outliers, which can exaggerate or reduce the intensity of the relationship, so the test is inadequate when the study variables are not normally distributed.
Therefore, to apply the correlation test, it must be verified whether the observed values are normally distributed (N (μ, σ)). This assumption is especially important in small samples. This is because, from the Central Limit Theorem, it is known that the as number of observations increases, the distribution of sample approaches the normal curve, regardless of the data distribution format in the population [32].
There are different tests to estimate the normality of data distribution. In this study, the Kolmogorov-Smirnov (K-S) test was chosen due to its applicability, without restriction to small samples. The quantile values of the test statistic distribution are tabulated and can be found, for example, in [33].
It is important to note that the Pearson´s coefficient does not refer to a proportion, nor does it represent the proportional strength of a relationship [25].
Methodology
To carry out the study, initially, observations were made in 45 circuits in needy areas, which add up to more than 5 000 consumers altogether, in order to collect information on irregularities in energy consumption.
The diagnoses of each circuit contemplate three distinct moments: the first carried out before the application of actions to combat the NTL, the second carried out soon after the interventions and the last, prepared in 2021, reflects the current state. Intervals between analyses vary from 6 to 11 years according to the intervention in each circuit.
Then, all observations made are consolidated in a database, which undergoes a systematic verification process in search of any errors that could interfere with the study.
In the scope of the research, energy balances were carried out to measure the percentage of loss of each circuit. In order to characterize the anatomy of losses in these locations, crossings were performed between different variables, such as:
Loss rate;
Number of clandestine consumers;
Volume of self-reconnected customers (defaulting customers irregularly connected to the electricity grid);
Number of units with internal measuring equipment;
Number of damaged meters;
Stock of disconnected customers;
Number of posts with illegal connections.
The relationships were investigated using Pearson’s correlation tests and graphically represented. Prior to the calculation of the Pearson’s correlation coefficient, the K-S test was applied in order to certify that the variables are normally distributed at 5% significance level α for the p-value limit, and sample number (n) equals to 45. At this point, the presence of outliers is observed and treated when necessary.
The next step of the adopted methodology was to carry out data crossing with the aid of graphical representations, in order to collect characteristics relevant to losses. In this regard, histograms were used. As a result of this study, relationships capable of pointing out the most significant attributes for losses in these locations were obtained.
Results and discussion
Given the nature of the research, the relationship between the variables was first analyzed using Pearson’s correlation tests, then graphical representations of the relationships were presented more prominently.
Pearson Correlation Coefficient (r)
The evaluation of the relationships between the variables, through the Pearson’s correlation test, portraying losses before and after the application of structural measures to prevent and combat losses, indicates a strong correlation between the percentage of loss reduction and the percentage of losses before the application of NTL combat actions (r = 0,923987). This note indicates that the greater the loss rate of the circuit, the greater the reduction (as intuitively expected). Also for this scenario, there is a moderate correlation (r = 0,676776) between the number of reconnections carried out in the circuits and the loss rate after the interventions, emphasizing the importance of debt negotiation for the reconnection process, which means curbing irregular energy consumption. Other issues also raised are the moderate correlations between the replacement of meters and the execution of shielding services (r = 0,668840), and performance of measurement externalization (r = 0,691469), highlighting the need for associated action for these measures.
In the analysis of the variables that represent the current state of the circuits, the applied correlation test showed coefficients of less than 0,5 between the current loss rate and number of irregularities (clandestine, self-reconnected, internal measuring equipment and damaged meters), indicating a correlation weak. The correlation coefficients between the current loss rate and each variable can be seen in table 2.
Table 2 Pearson’s Correlation Coefficient between the Current Loss Rate and Other Variables
| Variable | Classification | |
|---|---|---|
| Clandestine consumers | 0,195260 | Negligible |
| Self- reconnected | 0,401207 | Weak |
| Internal measuring equipment | 0,258365 | Negligible |
| Damaged meters | 0,279925 | Weak |
Thus, it is concluded that there is no preponderant anomaly directly correlated with the percentage of losses, which reinforces the need to associate actions, to actually achieve control over commercial losses of electricity.
Graphic Representations
With the crossing of data and graphical representations, relationships capable of extracting the most significant attributes for losses in these locations were obtained. The results indicate, among other findings, that the greater the number of consumers in the circuit, the lower the loss rate (figure 1).
This relationship is also valid when we observe only the number of standardized consumers (regular customers with standardized measurement) per circuit (figure2).
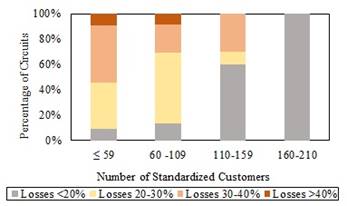
Fig. 2 Percentage of circuits by loss rate range categorized according to the number of standardized clients.
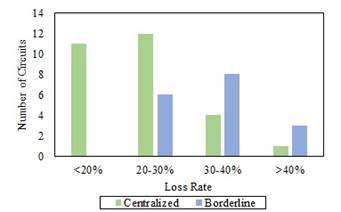
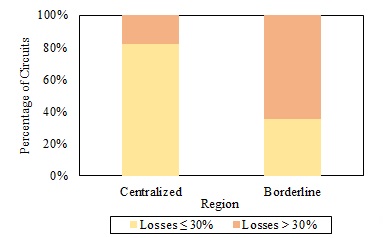
It was also observed that 82% of the centralized circuits (located in the central area of the neighborhood) have losses of less than 30%, while 64% of the borderline ones (located in the border area) have losses greater than 30%. This relationship can be seen in figure 3, which indicates the number of circuits per loss range and region, and figure 4, which indicates the percentage of circuits with per geographic region and loss limit below and above 30%.
In borderline circuits, the relationship that deserves visibility is the connection between the percentage of disconnected customers and the percentage of circuit losses. In this case, the lower the percentage of defaulting customers effectively disconnected, the greater the percentage of self-reconnected consumers, consequently the higher the percentage of circuits with high loss rates. This information reveals how the presence of disconnected units in this region can influence the NTL rate (figure 5).
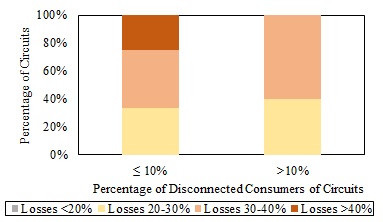
Fig. 5 Percentage of circuits by loss rate range categorized according to the percentage of disconnected customers in circuits in the bordering region.
In circuits located in the central region, the highlight is the association between the number of clandestine connections and the percentage of commercial losses, revealing that the higher the percentage of clandestine connections, the higher the percentage of circuits with high loss rates (figure 6). Therefore, in this area, it is important to indicate and regularize clandestine connections to monitor and control of commercial losses.
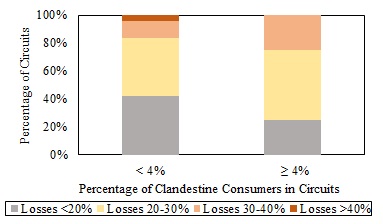
Fig. 6 Percentage of circuits by loss rate range categorized according to the percentage of clandestine.
Also in the comparison of irregularity rates between regions, it is highlighted that the percentages referring to structures with illegal connections, self-reconnected customer, internal metering, damaged meter and clandestine connection, are higher in neighboring electrical distribution circuits. In turn, the stock of consumer units disconnected (turned off) is greater in central circuits, which suggests that in this region there is a natural inhibition of the occurrence of self-reconnection by the customer. Rates for each region are shown in table 3.
Table 3 Percentage of Irregularities by Type and Region
| Type | Region | |
|---|---|---|
| Post with illegal connections | 25% | 38% |
| Disconnected customers | 8% | 7% |
| Self- reconnected | 4% | 7% |
| Internal measuring equipment | 5% | 6% |
| Damaged meters | 5% | 8% |
| Clandestine consumers | 2% | 4% |
Finally, it appears that the percentage of anomalies tends to systematically decrease within a period of 6 to 11 years after the application of measures to combat and prevent losses. These rates are compared in table 4.
Table 4 Percentage of Irregularities by Type and Age Range of Interventions
| Type | Age Range | ||
| 6 to 7 years | 8 to 9 years | 10 to 11 years | |
| Post with illegal connections | 38% | 26% | 25% |
| Disconnected customers | 10% | 8% | 4% |
| Self- reconnected | 4% | 4% | 2% |
| Internal measuring equipment | 7% | 6% | 3% |
| Damaged meters | 6% | 5% | 6% |
| Clandestine consumers | 5% | 3% | 1% |
The percentages referring to the number of structures with illegal connections, stock of disconnected customers, self-reconnected, internal metering equipment and clandestine consumers, decrease in the period from the sixth to the eleventh year after the structuring measures are applied in a coordinated manner to combat commercial losses, regardless of the region in which the circuit is located. Although this effect may be credited to NTL combat actions, consumers education may also have an important role. Another relevant indicator refers to the percentage of customers with damaged meters, which remains stable over the years, making it necessary to recurrently apply the meter replacement measure.
Conclusion
The knowledge of the level of energy losses and their characteristics are essential to assess the operating condition of the network, the quality of energy supply, and the effectiveness of actions aimed at reducing losses.
In this article, the state of 45 electrical energy distribution circuits, which add up to more than 5 000 consumers altogether, were observed in the field, for which energy balances were carried out to measure the percentage of losses. In order to characterize the anatomy of losses in these locations, crossings were performed between different variables. The relationships were investigated using Pearson’s correlation tests and graphical representations.
The conclusions indicate that there is no preponderant anomaly directly correlated with the percentage of losses, which reinforces the need to associate actions to actually achieve control over commercial energy losses. In addition, they point out that the greater the number of customers on the circuit, the lower the loss rate, and reveal that 82% of the centralized circuits (located in the central area of the neighborhood) in the study have losses of less than 30%, while 64% of the borderline ones (located in the bordering part) have losses greater than 30%, which indicates greater occurrences for this region. Finally, it appears that the percentage of anomalies tends to systematically decrease within a period of 6 to 11 years after the application of measures to combat and prevent losses.
Thus, the research highlights the importance of knowledge about the multiple variables that describe the anatomy of PNTs in electrical distribution circuits, to support decisions about which actions should be taken to prevent and combat losses.


