INTRODUCTION
In many industrial processes, to obtain the average heat transfer coefficients is a frequent requirement of energy facilities. For this purpose, due to its simplicity and reasonable approximation, the Dittus-Boelter model is preferred. When the temperature difference is large enough to cause significant changes of viscosity, then the Sieder-Tate model is recommended (Binu and Jayanti 2018; Ataei-Dadavi et al. 2019; Kumar 2023).
The accuracy on the heat transfer prediction can be improved with the use of two models derived from the Prandtl analogy: the equations of Petukhov (1970) and Gnielinski (2013) for  and
and , respectively (Reis et al. 2018). Recently, a new model that shows a satisfactory fit was proposed; with validity range
  (Camaraza-Medina, Cruz-Fonticiella and García-Morales 2019).
In heat transfer equipment, tubes generally have a low surface roughness, therefore, in calculations they are considered as smooth . However, the continued use increases gradually the aging and surface roughness of the tubes, which exerts a notable effect on the fluid circulation, and therefore, on the average heat transfer coefficient. The dimensionless roughness is a widely used term that establishes the roughness pattern, and is given by Equation (1) (Chen et al. 2019):
When  , the surface roughness has a negligible influence on the average heat transfer coefficient. However, for
  , the surface roughness has a significant influence, therefore, in the heat transfer calculations it must be considered (Bazán, Bedin and Bozzoli 2016; Rabiee et al. 2018).
In the technical literature, several works that describe comparisons between available models are found; however, these do not consider the effect of the friction factor on the average heat transfer coefficient. Models derived from the Prandtl analogy and logarithmic adjustments as Petukhov (1970), Gnielinski (2013) and Camaraza et al. (2020) respectively, include this effect, but only for  (Camaraza-Medina, Hernandez-Guerrero and Luviano-Ortiz 2020).
During the 1990’s, some works focused on improving the correlation indexes in the available correlations offering an approximate techniques for models derived from the Prandtl analogy (for this purpose, the friction factor may be determined with the help of the Moody chart) however, these models do not provide satisfactory results, because in tests carried out, mean absolute error (MAE) of ±30% and maximum errors (E max ) near 80% have been found (Camaraza-Medina et al. 2019a). For heat transfer calculations during fluid flow in single-phase inside rough tubes, in the literature several correlations are found; however, only a reduced range of relative roughness is considered in these correlations (Song, Cui and Liu 2017).
An important research focused on transition and turbulent flow was made by Bhatti-Shah (Bhatti and Shah 1987). In this work, the influence of a turbulence dimensionless parameter (turbulent Prandtl number) is considered, allowing to extend the validity range of the model and improving the accuracy of the heat transfer calculations. Similarly, a corrective term to consider the influence of dimensionless roughness on the mean coefficient was included. This correlation has a mean deviation of 20% with respect to the available experimental values and is suitable for  .
.
Recently, one model for improving the heat transfer calculations in rough tubes was developed. This correlation has a mean deviation of 18% with respect to the available experimental values and increases the validity range and the friction factor is estimated by means of a procedure for non-isothermal conditions (Medina, Fonticiella y Morales 2017, Camaraza-Medina et al. 2019b).
Currently, in the available literature there exists no study that provides MAE and E max variations for the existing models, neither, the number of data that complies with a acceptable MAE values. For this purpose, in the present work, a total of 1 666 experimental data of 34 different fluids were compiled, including air, gases, water and organic liquids. Available experimental data were correlated with three known models in the literature, Bhatti-Shah, Gnielinski and the modified Gnielinski method (using Moody chart for the friction factor). A summary of the equations used and their validity range is given by Song, Cui and Liu (2017).
To develop a correlation for heat transfer calculation inside rough pipes, with a larger validity range with respect to known models, while providing lower indexes of MAE and E max is the main objective of the present paper. Additionally, a description and tabulation of the main results using the correlation of the selected models and also the correlation proposed in the present work with available experimental data is offered as well.
METHODS AND VALIDATION
Development of the proposed model
The Prandtl model is taken in this research as a starting point, which is provided by Camaraza-Medina et al. (2020) (2):
Equation (2) is suitable for turbulent flow  , however, for transition flow
  the modified Reynolds is required. In this paper, the modified Reynolds is provided by (3):
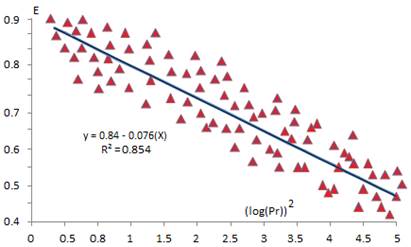
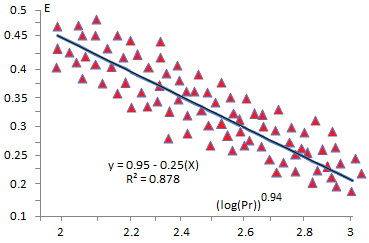
In Equation (3), the exponent D has a logarithmic dependence, obtained by adjusting the experimental data (Figure 1). A regression analysis shows that the exponent D is given by (4):
In Equation (4) f is the Darcy friction factor, which is obtained according to recommendations provided in Mondal and Field (2018).
The experimental data used in the validation of the selected model were extracted from Medina et al. (2018) and summarized in Table 1, which presents a comparison of the proposed correlation with a wide range of experimental data.
The proposed correlation was obtained by means of a modeling process, applying superposition variables techniques on Equation (2) (Cancan et al. 2017; Shankar and Senadheera 2024). Adjustment and validation of the available experimental data allowed obtaining the new correlation, given by (5):
The constant Nused in Equation (5) takes values 0.25 and 0.11 for fluid cooling or heating, respectively; E is the modified Prandtl number (Table 2); E is a constant value defined by Equation (6):
Equation (5) is applicable in tubes if  . When
  , heat transfer coefficient can be obtained by means of the smooth tubes criteria (Petukhov or Gnielinski). The dimensional roughness C is described by Equation (1) (Huang et al. 2016).
Figures 2, 3 and 4 show the correlation between the experimental data and the models summarized in Table 2. Table 3 provides a detailed summary of the validity range, showing a satisfactory fit with Equation (5).
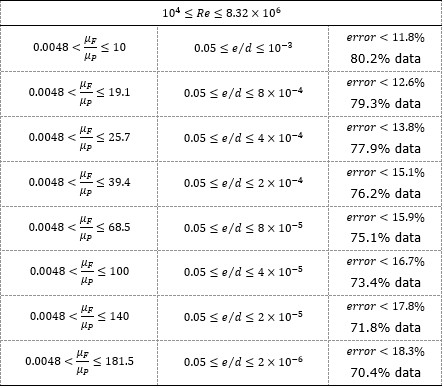
Tables 4 and 5 show the comparison between Equation (5) and the experimental data, for transitional and turbulent regime respectively, dividing into eight subintervals the validity range.
ANALYSIS OF RESULTS
Required element for the comparative study
In the examined correlations, the model proposed in this work has the larger validity range, therefore, to execute a comparative study, its validity range is divided in eight sub-intervals, summarized in Tables 4 and 5. The deviation percent (error) is computed with respect to the proposed correlation and is provided by Bae, Kim and Chung (2018) (7):
In Equation (7) 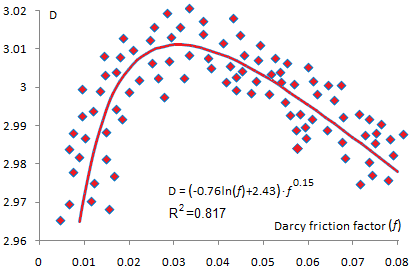 is the deviation percent,
  are the heat transfer coefficients obtained with Equation (5) and experimentally, respectively.
The mean absolute error (MAE) is calculated as Thomas et al. (2024) (8):
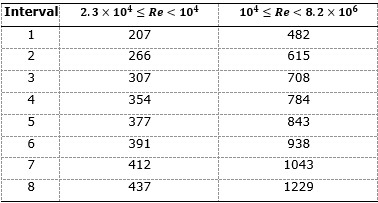
In Equation (8) n is the number of experimental data available. In order to accomplish this correlation study, the experimental available data were separated in two groups (Table 6), for turbulent and transition zones.
The study was carried out with 1 666 experimental data. In Table 6, the 𝑁 values of experimental data available for each validity range of the model are summarized, in agreement with the classification given in Tables 4 and 5.
The experimental data available are grouped in the eight intervals given in Tables 4 and 5 and thus the data of each zone with the four models selected for this study are correlated, obtaining for each model the percentage values of data that correlates under MAE values  the maximum error
  and the MAE values.
Summary of the main results obtained in the evaluation of the transition zone
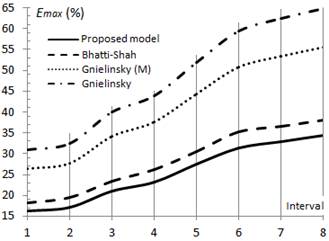
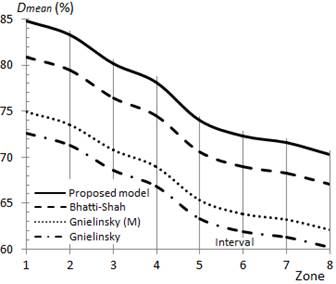
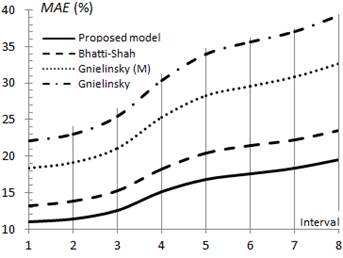
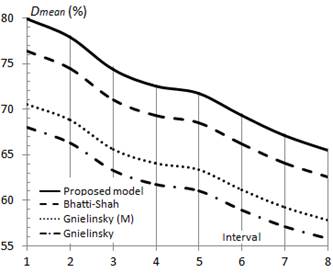
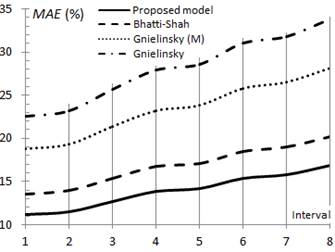
In Figures 5, 6 and 7, the values of  MAE and
  obtained in the correlation developed between selected models and available experimental data are given in graphical form.
The study shows that in the transition zone, the fundamentals results used in the comparison concentrate on three fundamental elements, described early ( ,
,  and MAE). In these, for
  it is confirmed that the model proposed in the present work has the best MAE adjustment values, showing an average error of 11.1 % and 16.6 %, for 84.5 % and 74.8 % of the available data for Intervals 1 and 8, respectively.
In the specialized literature (Shankar and Senadheera 2024) it is established that Bhatti-Shah's model correlates with an average error of 15 %; however, the results obtained in the present study show an average error of 13.5 % and 18.4 % for 81.6 % and 70.3 % of the data for Intervals 1 and 8, respectively, proving that the values obtained in the present study are slightly higher to the values commonly attributed in the literature.
The most unfavorable indicators are obtained using the models of Gnielinski, which provide MAE values of 23.2 % and 32.8 % for 72.5 % and 60.1 %, respectively of the experimental data, for Intervals 1 and 8, which agrees well with those results given by Shankar and Senadheera (2024).
The modified correlation of Gnielinski provides fairly acceptable adjustments of correlation, with MAE values of 18.9 and 25.9 % for 74.8 % and 62.9 % of the experimental data, respectively for Intervals 1 and 8; this indicates that Gnielinski’s model can be used for a rapid estimation of the heat transfer coefficients in the transition zone, which confirms the recommendations given by Thomas et al. (2024).
Equation (5) and Bhatti-Shah’s model, show the best 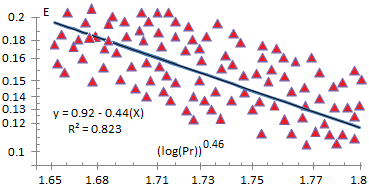 index, with 84.5 % and 81.6 %, respectively, in Interval 1, while these values decrease to 74.8 % and 70.3 % for Interval 8. On the contrary, the modified correlation of Gnielinski and the Gnielinski’s model, have the most unfavorable indexes, with 74.8 % and 72.5 % respectively in Interval 1, decreasing to 62.9 % and 60.1 % for Interval 8.
The known technical literature does not contain recommendations that suggest the maximum error with the use of a determined model. In the present research, values of 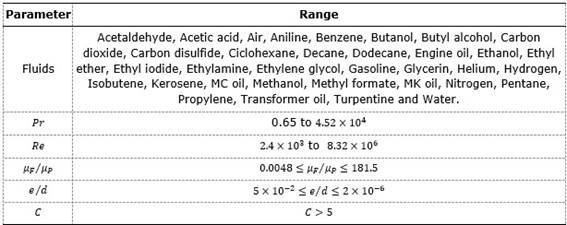 generated with the use of every model for the eight studied intervals was obtained. For this purpose, a comparison between available experimental data and the selected models was made.
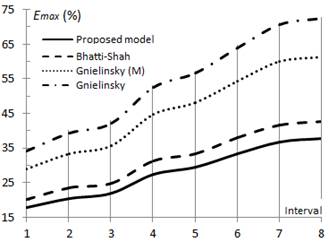
Equation (5) and Bhatti-Shah’s model show the best 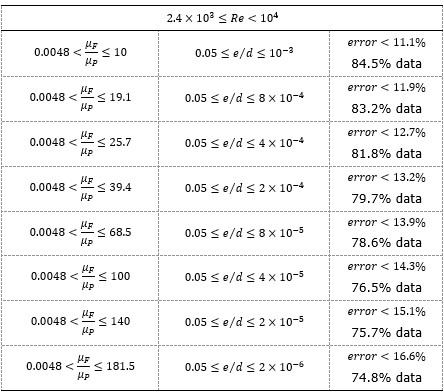 index, with 16.9 % and 19.1 % respectively in Interval 1, while these values increase to 32.3 % and 36.5 % for Interval 8. On the contrary, the more unfavorable indexes are obtained with the modified correlation of Gnielinski and Gnielinski’s model, which provide
  values of 27.3 % and 31.4 % respectively for Interval 1, increasing to 54.7 % and 64.8 % in Interval 8.
Based on the results of this study, it is confirmed that the modified correlation of Gnielinski can be used reservedly to determine the heat transfer coefficients in the transition regime, being preferable not to extend their use beyond Interval 1.
Summary of the main results obtained in the evaluation of the turbulent zone
In Figures 8, 9 and 10, the values of  MAE and
  obtained in the correlation developed between the selected models and the available experimental data are given in graphical form.
The study shows that in the turbulent zone, the main results used in the comparison concentrate on three fundamental elements, described early  , it is confirmed that Equation (5) have the best MAE adjustment values, showing an average error of 11.8 % and 18.3 % for 80.2 % and 70.4 % of the available data for Intervals 1 and 8, respectively.
In the specialized literature it is established that Bhatti-Shah's model correlates with an average error of 10 % and 15 % for Intervals 1 and 8 respectively; however, the results obtained in the present study show an average error of 13.8 % and 18.6 % for 77.9 % and 68.1 % of the data for Intervals 1 and 8, respectively, proving that the values obtained in the present study are slightly higher to the values commonly attributed in the literature.
The most unfavorable indicators are obtained using the model of Gnielinski, which provide MAE values respectively of 23.9 % and 36.6 % for 67.1 % and 56.8 % of the experimental data, respectively for Intervals 1 and 8, which agrees well with those results given by Thomas et al. (2024).
Equation (5) and Bhatti-Shah’s model show the best  index, with 80.2 % and 77.9 % respectively in Interval 1, while these values decrease to 70.4 % and 68.1 % for Interval 8. On the contrary, the modified correlation of Gnielinski and the Gnielinski’s model, have the most unfavorable indexes, with 70.2 % and 67.1 % respectively in Interval 1, decreasing to 60.4 % and 56.8 % for Interval 8.
Equation (5) and Bhatti-Shah’s model show the best  index, with 17.3 % and 20.1 % respectively in Interval 1, while these values increase to 34.1 % and 39.7 % for Interval 8. On the contrary, the most unfavorable indicators are obtained with the modified correlation of Gnielinski and Gnielinski’s model, which provide
  values of 28.7 % and 34.6 % respectively for Interval 1, increasing to 56.8 % and 68.9 % in Interval 8.
The modified correlation of Gnielinski provides fairly acceptable adjustments of correlation, with MAE values of 19.2 % and 28.4 % for 70.2 % and 60.4 % of the experimental data, respectively for Intervals 1 and 8; this indicates that it can be used for a rapid estimation of the heat transfer coefficients in the turbulent zone, which confirms the recommendations given by Medina et al. (2017):
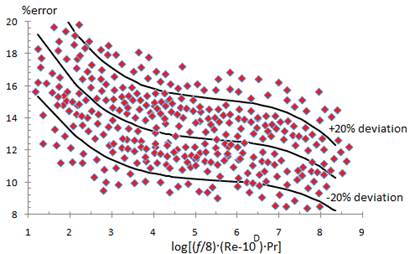
Figure 11 shows (with a 20 % error band) the adjustment obtained in the correlation of available experimental data with the model proposed in the present work, and provided by Equation (5).
CONCLUSIONS
A new improved method for heat transfer calculation inside rough pipes has been proposed in the present work. The new correlation increases the validity range with respect to known models in the literature. The model presents a satisfactory agreement with the experimental data in each interval evaluated; therefore, can be considerate enough for use in practical applications. In available technical literature on the subject a model with similar characteristics is unknown.
For the transition zone, 437 experimental data were used, verifying that the best adjustment was obtained by Equation (5), with a MAE value of 11.1 % for 84.5 % of the data and
 of 16.9 % in the Interval 1, while for Interval 8, a MAE value equal to 16.6 % for 74.8 % of the data and
  of 32.3 % are obtained. The more unfavorable indexes adjustment was achieved with Gnielinski’s model with a MAE value of 23.2 % for 72.5 % of the data and
  of 27.3 % in Interval 1, while for Interval 8, a MAE value equal to 32.8 % for 60.1 % of the data and
  of 54.7 % are obtained. The modified correlation of Gnielinski can be used reservedly for heat transfer calculations in the transition regime, being preferable not to extend their use beyond Interval 1. The values obtained in the present study are slightly higher to the values commonly attributed to Bhatti-Shah’s model.
For the turbulent zone, 1 229 experimental data were used, verifying that the best adjustment was obtained by Equation (5), with a MAE value of 11.8 % for 80.2 % of the data and
 of 17.3 % in Interval 1, while for Interval 8, a MAE value of 18.3 % for 70.4 % of the data and
  of 34.1 % are obtained. The more unfavorable indexes adjustment was achieved with the Gnielinski’s model with a MAE value of 23.9 % for 67.1 % of the data and
  of 34.6 % in Interval 1, while for Interval 8, a MAE value of 36.6 % for 56.8 % of the data and
  of 68.9 % are obtained, (however, it can be used for rapid estimations of the heat transfer coefficients in the turbulent zone). The values obtained in the present study are slightly higher to the values commonly attributed in the literature to the Bhatti-Shah’s model.
In this study, the models recognized in the literature as more precise (Bhatti-Shah and Gnielinski modified), showed a slightly larger uncertainty than the results obtained with the model proposed in the present work. Thus, Equation (5) is a better correlation, with a much better adjustment with the experimental data. Its use leads to a lower value of uncertainty in the calculation of the heat transfer coefficients in the turbulent and transitional regimes.


