


 Servicios personalizados
 Español (pdf)
 Articulo en XML
 Referencias del artículo
 Enviar articulo por email
 Citado por SciELO
  Similares en
SciELO
Similares en
SciELO 
 Permalink
INTRODUCTION
Aquaculture is one of the activities with higher potential for improvement. In the last three decades, world aquaculture production tripled. Finfish, mollusks and crustaceans cultured both in continental waters and in marine-coastal zones, contributed the most to the increase (FAO, 2018).
Aquaculture slightly grew in Cuba during the last decade. In 2016, the production of freshwater species was 24.5 thousand tons, while the contribution of marine culture was five thousand tons, associated with the white shrimp Litopenaeus vannamei (ONEI, 2017). In the 2008-2015 period, technological transfers were made for the farming of marine fish such as snapper (Lutjanus analis), common snook (Centropomus undecimalis) and cobia (Rachycentron canadum) (Flores-Gutiérrez et al., 2016). At the moment, the increase of freshwater fish productions like cyprinids, African catfish (Clarias gariepinus), tilapias (Oreochromis sp) and marine cultures (white shrimp and red tilapias) have been strengthening, because they use nationally validated technologies and have a guaranteed market.
Red tilapias became excellent candidates for aquaculture due to their biological, nutritional and organoleptic characteristics. They have a wide tolerance for variations in the physical-chemical parameters of water (they support hypoxia, eurythermic and euryhaline conditions), disease resistance, rapid growth and reproduction even in captivity (Aßmann, 2009). Their appearance and white meat are similar to those in marine species of high economic value like snappers (Lutjanus sp) and groupers (Epinephelus sp). The intensive culture in marine environment of red tilapia is justified by the growing limitation of freshwater, its popularity in the international market and the increase on demand.
The first introduction of red tilapia hybrid (Oreochromis niloticus x O. mossambicus) in Cuba took place in 1979 from the Philippines. There were also two introductions of red tilapia from Israel (Oreochromis aureus x O. mossambicus), one in 1996 and another one in 2006. Currently, these two hybrids are grown in the country's freshwater stations. Also, pilot trials performed to fatten juveniles of Israeli red tilapia in floating cages of 4-6m3 to 35‰, which showed their farming potential in marine environment (Fraga et al., 2012; Damas et al., 2015). In this study, red tilapia (Oreochromis niloticus x O. mossambicus) was selected because this hybrid combines fast-growing traits of O. niloticus with tolerance to salinities higher than 35‰ of O. mossambicus. In addition, its cultivation contributes to 15% of the total tilapia cultivated worldwide (reviewed by Masagounder, 2017).
Feedstuffs are limited for aquaculture industry in Cuba. The primary objective of this research was to evaluate the use of Cuban commercial aquaculture feeds in the seed production of red tilapia (Oreochromis niloticus x O. mossambicus) adapted to marine environment.
MATERIALS AND METHODS
Composition of diets and Chemical Analysis
Three commercial feeds were selected from ALISUR factory in Santa Cruz del Sur, Camagüey, Cuba. They were designated D10, D15 and D24 according to the inclusion levels of fishmeal (Table 1). The moisture, protein, lipid and ash levels in the test diets were determined using standard methods (AOAC, 2000).
Table 1 Ingredients and proximate composition (means ± standard deviation) of the experimental diets for the red tilapia Oreochromis niloticus x O. mossambicus.
| Diet (g/100g wet weight) | |||
|---|---|---|---|
| Ingredients | D10 | D15 | D24 |
| Fish meal | 10 | 15 | 24 |
| Soy bean meal | 40 | 35 | 31 |
| Whole wheat ground | 42 | 42 | 36 |
| Soy oil | 3 | 3 | 4 |
| Calcium phosphate | 3 | 3 | 3 |
| Vitamins and mineral premix* | 2 | 2 | 2 |
| Proximate analysis (g kg-1 dry weight) | |||
| Dry Matter | 83.78 ± 0.32 | 83.66 ± 0.54 | 83.74 ± 0.38 |
| Crude protein | 29.19 ± 0.57 | 30.14 ± 0.31 | 33.30 ± 0.43 |
| Crude lipid | 4.87 ± 0.16 | 5.15 ± 0.12 | 6.51 ± 0.15 |
| Ash | 3.94 ± 0.06 | 4.39 ± 0.08 | 5.50 ± 0.08 |
| NFE** | 42.07 ± 1.03 | 40.57 ± 0.98 | 35.32 ± 0.94 |
| Gross energy*** (kJ/g) | 14.99 | 15.04 | 15.34 |
*Vitamins and mineral premix composition: Vitamin A, 1000 IU; Vitamin D3, 200 IU; Vitamin E, 150 g; Vitamin K3, 40 g; Vitamin B1, 20 g; Vitamin B3, 60 g; Vitamin B6, 40 g; Vitamin B12, 200 mg; Niacin, 400 g; Folic acid, 1000 mg; Biotin, 0,47 mg; Selenium, 0,4 g; Iron, 160 g; Manganese, 200 g; Zinc, 160 g; Copper, 30 g; Potassium chloride, 8 g; Manganese oxide, 1,2 g; Sodium bicarbonate, 3 g; Iodine, 2 g; Cobalt, 0,5 g.
**Nitrogen-free extract (including fiber) = 100 - (% protein + % lipid + % ash)
***Calculated according to the physiological fuel values of protein, 20.93 kJ/g; lipids, 37.68 kJ/g and nitrogen-free extract, 16.75 kJ/g (Shiau and Chou, 1991).
Fish rearing and feeding
Red tilapia fry were produced in a pilot-scale hatchery at the Aquaculture Technology Development Company, Cuba. The fish were selected with a 5mm mesh selector and then were submerged in a prophylactic bath of 1mL/L ammoniacal water (25% of active principle) during 30s. After 15min of repose in freshwater, fish were transferred in nylon bags to Nutrition Bioassay Laboratory of the Fisheries Research Center, Cuba.
The fish were randomly distributed at a stocking density of 40 animals (mean weight 0.14 ± 0.06g) per tank among nine plastic tanks (volume 40L). Each tank had supplemental aeration (Sweetwater, USA). After three days for acclimatization to the lab conditions, adaptation to seawater was performed during the next ten days (Barreto-Curiel et al., 2015). The salinity was increased in 5‰ every 24h adding seawater obtained from Mariel Experimental Marine Station, Cuba. For the salinity adjustment the following formula was used:
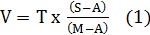
where V: volume of water to replace; T: total volume of the tank; S: wanted salinity; M: seawater salinity; A: current salinity of the tank.
During acclimatization and adaptation to seawater, Skretting feed (Canada) with 55% of crude protein was manually supplied two times a day (11:00 and 16:00) until the fish were satiated. Uneaten food was collected from the bottom of the tank using a siphon 1h after the onset of feeding. Dead fish were recorded and weighed. Water quality parameters were measured daily using an oximeter YSI (USA). The dissolved oxygen level was maintained at 6.5 ± 0.4 mg/L and the water temperature was 28.7 ± 0.8 °C.
A completely randomized experimental design with three replications per treatment was used. A total of 360 previously adapted to seawater red tilapia fry, had two days of fasting before being fed with each commercial diet (Table 1). Pellets were ground and provided as powder. The feeding scheme and water exchange are shown in Table 2.
Table 2 Feeding scheme and daily seawater exchange along culture days.
| Culture days | % of biomass addition | Feeding frecuency | Hours | Daily seawater exchange (%) |
|---|---|---|---|---|
| 1-15 | 30 | 3 | 9:00; 12:00; 15:00 | 12.5 |
| 16-30 | 10 | 3 | 9:00; 12:00; 15:00 | 25 |
| 31-45 | 10 | 3 | 9:00; 12:00; 15:00 | 33.3 |
| 46-55 | 7 | 4 | 9:00; 11:00; 13:00; 15:00 | 50 |
The dissolved oxygen level was maintained at 5.5 ± 1.0 mg/L. Water temperature was 27.3 ± 1.3 °C and salinity was 36.0 ± 1.3‰ (measured with a manual refractometer (Krüss-Optronic, Germany)). Water samples were taken in the onset (control) and the end of the experiment for dissolved inorganic phosphate, total phosphorous, dissolved inorganic silicate, nitrite (Grasshoff, 2002), nitrate (APHA, 2017) ammonia and chemical oxygen demand (FAO, 1975) determination (Table 3). Ten fish per tank were weighed every two weeks to calculate their mean body weight and the biomass present in each tank. The fish were caught with scoop nets and weighed by groups on a digital scale (Ohaus, USA, accurate to ± 0.1g).
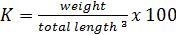
Growth and feed efficiency of the fish were monitored in terms of weight gain (WG), biomass gain (BG), feed added (FA), protein intake (PI), feed conversion ratio (FCR), survival (S), specific growth rate (SGR), condition factor (K), and protein efficiency ratio (PER). These biological indicators were calculated as follows:
 (2)
(2)
 (3)
(3)
 (4)
(4)
 (5)
(5)
 (6)
(6)
 (7)
(7)
 (8)
(8)
 (9)
(9)
Length-weight relationship was determined at the end of the experiment for each group of red tilapia fingerling fed with the commercial diet through the equation (10):
 (10) (Mapenzi y Mmochi, 2016).
The cost of the feed was calculated from the prices of the ingredients reported in the international market (Table 6). Feeding costs were calculated by multiplying the cost of the feed by the FCR. It was considered that the cost of the feed was 60% of the total cost of production (Arru et al., 2019). Production value was reported by the Aquaculture Technology Development Company, Cuba.
Data Analysis
All assays were performed in triplicate and were expressed as means ± standard deviation (SD). All percentage data were arcsine transformed before statistical comparisons. Data for each parameter was tested for normality (Kolmogorov-Smirnov test) and homoscedasticity (Bartlet test). Kruskal-Wallis and Nonparametric multiple means comparison tests were only used with phosphate data because they did not fit to the normal distribution. One-way analysis of variance (ANOVA) was performed with diet as the independent variable. Tukey HSD test was used as a post-hoc test to determine significant differences among dietary treatment groups (p < 0.05). All of the statistical procedures were performed using the STATISTICA version 7 software package.
RESULTS AND DISCUSSION
Adaptation of red tilapia larvae to the marine environment
Red tilapia fry with less than 5mm of total length adapted to seawater (36‰) with a 99.58% survival rate in ten days. Some authors suggest that the adaptation of tilapia to high salinities is associated with variations in the concentrations of osmoregulatory hormones, the increase of organic osmolytes in the kidney and gills, glucose and plasma osmolarity, the proliferation and increase in size of the gill hydrochloric cells, increase in ATPase Na+/K+ activity and the balanced levels of Na+ and Cl- in the blood plasma (Jumah et al., 2016).
The high value of larval survival (99.58%) obtained in this study during adaptation to the marine environment, can be related to several factors. First, there are intrinsic characteristics of the hybrid. Tilapia hybrids had greater growth and survival in higher salinities compared to species (Martínez-Contreras, 2003). In the second instance, the size of the tilapia (0.1g larvae) when the transfer was made from 0 to 35‰ could also influence the larval survival. This work showed that red tilapia fry can be adapted to seawater with a high survival rate.
The method of gradual adaptation to higher salinities is also another determining factor of larval survival. The adaptation of juveniles of tilapia to seawater can be done directly from 0 ups to 15-20‰ or gradually, with daily increases of 4 to 5‰ (Martínez-Contreras, 2003). Sallam et al. (2017) showed that when the Florida red tilapia larvae (O. mossambicus x O. urolepis hornorum) are transferred directly to 36‰ (without gradual adaptation), from freshwater cultured breeders, 100% mortality occurs after the first week of exposure. Another study indicates that when breeders spawn in salinity of 30‰, the larval survival of red tilapia is 52.8% (Malik et al., 2017). Several investigations proved that the method of gradual adaptation to higher salinities, although it consumes more water and requires more labor, is more effective in achieving the survival of fish (Martínez-Contreras, 2003; Fraga et al., 2012).
Finally, another important element is the supply of good nutritional quality food during adaptation. Larval survival is the most critical step in the aquaculture industry of any species, especially when artificial diets are used, so fish larvae should be grown with live food to maximize survival. However, contrary to this approach, Maithya et al. (2017) report greater growth and survival for larvae of 1g of O. variabilis fed with artificial diets formulated than with phytoplankton. In this particular study, the red tilapia larvae were fed to satiety with Skretting feed of 55% crude protein and survival was not affected.
Nutritional characterization of commercial feed
The increase in demand for fishmeal, accompanied by the decline in global supply, has resulted in a continuous increase in the price of this component. For this reason, many efforts are currently being made to replace fishmeal by less expensive and available vegetable protein sources for aquaculture food production. Particular attention has been given to soybean meal because of its high protein content and essential amino acid profile. Soybean meal also has high digestibility (more than 90%) of proteins in the different species of tilapia. This ingredient has substituted up to 100% of fishmeal in diets to fatten tilapia (Fraga et al., 2012; Ajani et al., 2016). However, tilapia larvae require at least 5% inclusion of fishmeal or the sulfur and lysine amino acid supplement in feed (Masagounder, 2017). In this study, the selected feeds had between 30 and 40% soybean meal and at least 10% fishmeal.
All commercial diets tested in the experimental design were isoenergetic (14.99-15.34 kJ/g). The protein levels required for optimal growth may vary between different species and hybrids of tilapia and developmental stages (Larumbe-Morán et al., 2010). The protein levels of the feeds tested were close to 30% (Table 1), a reported requirement value for larvae of the same Oreochromis niloticus x O. mossambicus hybrid, grown at 35‰ (El-Dakar et al., 2015). The nutritional requirements of tilapia cultured in marine environments have not been well studied.
The levels of dietary lipids in the evaluated feeds were between 4.59 and 6.51%. The optimal level of this nutrient is between 5 and 7.4% for O. niloticus cultured in freshwater. Omnivorous fish such as tilapia support deficiencies of essential fatty acids for relatively long periods without affecting growth, due to their ability harnessing dietary carbohydrates to increase glycolysis and provide substrates for liver lipogenesis (He et al., 2015).
Water quality parameters
Silicate concentrations in the culture water did not show any significant difference (p > 0.05) among different diet treatments, while the others compounds evaluated showed higher values in treatments than in control seawater (Table 3).
Table 3 Water quality parameters of red tilapias (Oreochromis niloticus x O. mossambicus) fed different diets (treatments).
| Parameters (mg/L) | Treatments | ||||
| Control | D10 | D15 | D24 | p | |
| Nitrite NO2 - | 0.0036 ± 0.0001a | 1.103 ± 0.460b | 1.049 ± 0.341b | 1.489 ± 0.336b | 0.009 |
| Nitrate NO3 - | 0.18 ± 0.01a | 2.927 ± 1.242b | 3.093 ± 0.978b | 3.897 ± 0.862b | 0.005 |
| Ammonia NH4 + | 0.006 ± 0.001a | 1.008 ± 0.537b | 1.238 ± 0.478b | 2.357 ± 0.855b | 0.006 |
| Silicate SiO3 2- | 1.25 ± 0.02 | 0.743 ± 0.402 | 0.373 ± 0.613 | 0.86 ± 0.502 | 0.052 |
| Phosphate PO4 3- | 0.06 ± 0.009a | 1.25 ± 0.429b | 1.307 ± 0.280b | 1.247 ± 0.361b | 0.011 |
| TP | 0.35 ± 0.01a | 2.023 ± 0.038b | 2.423 ± 0.270b | 1.947 ± 0.620b | 0.043 |
| COD | 14.38 ± 0.23a | 21.520 ± 2.649b | 27.096 ± 2.277bc | 31.523 ± 3.812c | 0.0002 |
Data from each group are expressed as means ± SD. p: p-value determined by one-way ANOVA except for phosphate data (Kruskal-Wallis test). Values in the same row with different superscript (a < b < c) are significantly different (p < 0.05). TP: total phosphorous, COD: chemical oxygen demand.
Temperature, salinity and dissolved oxygen were within the range tolerable by tilapia in culture. Nitrite values in this study were according to Gustavsson (2016). Nitrate and ammonium levels in treatments did not have a negative effect for tilapia development because sodium chloride decreased their toxicity (Caldini, 2015). It is important to ensure a daily seawater exchange over 50% to maintain good water quality after 45 days of culture.
Growth performance and feed utilization
Red tilapia fry were grown at 36‰ during 55 days. Survival rates were greater than 90% for the three treatments, at the end of the experiment. No significant differences (p ˃ 0.05) were detected among the indicators evaluated with the different levels of fishmeal inclusion in feed (Table 4). This evidenced that 10% of fishmeal inclusion in feed is enough to provide the nutritional requirements for red tilapia fry grown in marine environment.
Table 4 Growth and feed efficiency of red tilapias (Oreochromis niloticus x O. mossambicus) reared in seawater and fed commercial diets for 55 days.
| Diet | FW (g) | WG (g) | FCR | S (%) | SGR (%/day) | K | PER |
| D10 | 5.55 | 5.41 | 1.03 | 94.2 | 6.69 | 1.87 | 3.58 |
| D15 | 5.79 | 5.65 | 1.07 | 94.2 | 6.76 | 1.79 | 3.33 |
| D24 | 5.92 | 5.78 | 1.04 | 91.7 | 6.81 | 1.85 | 3.17 |
| SE | 0.167 | 0.106 | 0.018 | 0.82 | 0.035 | 0.019 | 0.115 |
| p | 0.651 | 0.818 | 0.747 | 0.708 | 0.389 | 0.183 | 0.403 |
Data from each group are expressed as means. SE: Standard Error; p: p-value determined by one-way ANOVA; FW: Final weight; WG: Weight gain; FCR: Factor conversion ratio; S: Survival; SGR: Specific growth rate; K: Condition factor; PER: Protein efficiency ratio.
Some authors reported that red tilapia (O. niloticus x O. mossambicus) grew faster in freshwater than in marine environments, even with differences between strains. For example, in freshwater, tilapia from Taiwan had greater growth than those from the Philippines and Thailand; but in marine environment (30‰), the strains of the Philippines and Thailand surpassed the strain of Taiwan (Pongthana et al., 2010). On the other hand, Martínez-Contreras (2003) showed that the hybrid O. niloticus x O. mossambicus in seawater had a faster growth rate than parental species and is therefore the best option to grow in a marine environment. In that study, juveniles of 60g average weight were transferred directly to sea cages and in three months of intensive cultivation they reached more than 500g with a survival of 86% and FCR of 1.75, suitable for commercial purposes.
The findings of this study show the potential of the hybrid to grow rapidly in seawater. Red tilapia fingerling at the end of this bioassay weighed more than Nile Gift tilapia (Oreochromis niloticus) of 0.143g of initial mean weight, grown in freshwater and fed during 60 days with a diet of 12% fishmeal and 40% soybean meal (30.4% crude protein) (Llanes et al., 2015). Besides, the specific growth rates (in body weight) of the red tilapias grown in the present experiment were greater than 6%/day (Table 4). Larvae of 0.29g of the hybrid O. niloticus x O. urolepis urolepis grown at 35‰ had an SGR of 6.12%/day (Mapenzi and Mmochi, 2016). Odinga et al. (2018) obtained values from 1.96 to 5.08%/day for larvae up to 0.8g of the same species grown in freshwater with 45% protein feed. SGR may vary with the days of culture and with the diet (Maithya et al., 2017). It is greater in larval stages and with diets which include the protein requirements of the species.
The FCR obtained in this experiment with D10, D15 and D24 diets, were close to 1 (Table 4) and they were similar to the reported values for larvae of O. niloticus grown in laboratory conditions at 0, 15, 20 and 25‰ and fed a 30% crude protein diet (Larumbe-Morán et al., 2010). Among the elements that improve consumption and therefore the FCR are management practices, environmental conditions, food quality, inherent genetic factors and the physiological condition of farmed fish (Eriegha and Ekokotu, 2017).
The condition factor K provides information on the variation of the physiological state of the fish. It should be close to or above 1 for fish in culture (Olufeagba et al., 2016). The K values of red tilapia fry grown in seawater with commercial feed were between 1.79 and 1.87, without differences. These values indicate good health during the experiment.
The PER indicates how much protein is used from the food supplied to increase body weight. Protein utilization decreases with increasing dietary protein levels and with larger sizes of tilapia. In larvae of 0.5g of Nile tilapia grown in freshwater, the highest value of PER was 2.35 and was obtained with a diet of 25% crude protein; however, it reached greater growth with the diet of 45% (Abdel-Tawwab et al., 2010). Although PER differs among species, the values obtained in this study (Table 4) are similar to those reported (3.62) by Larumbe-Morán et al. (2010) for larvae of O. niloticus cultured with 30% crude protein diets at 25‰.
In this study the coefficients “b” were approximately equal to 3 and showed that red tilapia hybrids slightly exhibited isometric growth in all dietary treatments. The values range from 2.86- 2.98 (Table 5) and are in accordance with those reported by Mapenzi and Mmochi (2016). The regression analyses showed strong correlation (p < 0.001) in hybrids weights and lengths at all dietary treatment.
Table 5 Parameters for fingerling red tilapia (Oreochromis niloticus x O. mossambicus) length-weight ratio at different diet treatments.
| Diet | a | b | R2 | r | N |
| D10 | -1.67 | 2.89 | 0.97 | 0.98 | 113 |
| D15 | -1.65 | 2.86 | 0.93 | 0.96 | 113 |
| D24 | -1.77 | 2.98 | 0.97 | 0.98 | 110 |
R2: determination coefficient; r: correlation coefficient; N: number of animals; a: intercept; b: coefficient
Global efforts are made to replace fishmeal and fish oil in aquaculture feed. Various studies have contributed to the evaluation of soybean meal as a possible feasible alternative to be included in practical diets for tilapia (Ajani et al., 2016; Sharda et al., 2017). Currently, the levels of fishmeal (1.5%) and fish oil (0.5%) for tilapia feeding in China are low compared to other farmed fish species (Rome-Peebles, 2018). Although the level of protein is more important than the source of protein in the diet, there are still limitations to the complete replacement of fishmeal for soybean meal (Daniel, 2018).
Table 6 International market prices of ingredients of Cuban commercial diets in February, 2019 (https://www.indexmundi.com/es/precios-de-mercado/), and the economic analysis.
| Ingredients | Cost (USD/ton) | Variables (USD/ton) | D10 | D15 | D24 |
|---|---|---|---|---|---|
| Fish meal | 1 472 | Feed cost | 611 | 690 | 847 |
| Soy bean meal | 353 | Feeding cost | 629 | 738 | 881 |
| Whole wheat ground | 219 | Total cost of production | 1048 | 1230 | 1468 |
| Soy oil | 100 | Production value | 3400 | 3400 | 3400 |
| Calcium phosphate | 773 | Utilities* | 2352 | 2170 | 1932 |
| Vitamins and mineral premix | 1500 | *Utilities were calculated as Production value minus Total cost of production |
Economic evaluation of the feeding trials after 55 days (Table 6) showed that using low fishmeal diet lowered the cost of feed, therefore, the profit indices of the fishes fed D10 increased. Based on performance of red tilapia fry fed with the commercial diets, the use of D10 for scale-pilot experiment is recommended. This study represents the first research conducted in Cuba to culture red tilapia fry in seawater. The present work may serve as a reference when evaluating other practical diets or imported feed, until basic nutritional studies are conducted.

