


 Servicios personalizados
 Inglés (pdf)
 Articulo en XML
 Referencias del artículo
 Enviar articulo por email
 Citado por SciELO
  Similares en
SciELO
Similares en
SciELO 
 Permalink
Introduction
The logistics of urban freight transport (UFT) is one of the challenges for modern cities planning. Although freight transportation is aligned with economic development and well-being of cities, its impact over mobility, road safety, and especially over environment because is considered an one of the most energy consumption and most environmental pollution on the logistic chain (Pede, et al., 2006; Xiao, et al., 2012; Lang, et al., 2014; Ehmke, et al., 2018).
In this context, freight distribution companies are interested in reducing the cost of their deliveries (by improving routing efficiency. This improvement can be beneficial for society by reducing the impacts generated by the externalities of UFT, such as congestion, pollution, noise, accidents, and damage to the pavements due to the increase in the volume of freight vehicles, which have caused that some of the actors in society have become against this activity (Holguín-Veras, et al., 2020).
Lots of research have been carried out to develop tools to improve the distribution efficiency and reduce externalities. On the one hand, some authors have tried to quantify the costs of externalities such as congestion (Vickrey, 1969; Betanzo-Quezada, et al., 2013; Alho, et al., 2018; Moufad & Jawab, 2019; Verhoef, 2020), accident pollution and noise (Parry & Small, 2005; Teo, et al., 2012). Other researchers have focused to minimize operational costs (Soysal, et al., 2015).
The costs of the fuel consumption represent over 50% of the total operating costs in UFT (Lang, et al., 2014). Some authors calculate this consumption according to load, distance, and speed, and time dependent (Franceschetti, et al., 2013). Usually, avoiding considerer the slope is included in this function assume it as zero (Bektaş & Laporte, 2011).
There are in specialized literature several approaches, solution methods or algorithms, and tools used to optimize transportation costs Because it is needed classify to provide an overview of research efforts. This paper presents an overview of the research UFT and the city logistics and pollution problem and time dependence using two analyzes, one bibliometric and a systematic literature review.
Materials and methods
This section describes the method for bibliometric analysis and systematic literature review. A bibliometric analysis was carried out to quantitatively visualize some parameters such as the investigations by the countries, the behavior of the annual scientific production, the main authors, and research centers (Sánchez, et al., 2016; Cárdenas, et al., 2018).
To map the results, the R bibliometrics tool was used through the biblioshiny application (Aria & Cuccurullo, 2017), this tool produces results similar to those of Histcite since they use measures such as Local Citation Score (LCS) Global Citation Score (GCS), however, the latter is no longer in active development or has official support. The bibliometric analysis of the scientific publications was carried out using the keywords UFT and / City Logistics / Pollution / Time-dependent in the Scopus database. With this search protocol, the metadata of 4,760 publications was mined from 2004 to 2021. From this total, a filter was made considering only published, conference papers, conference review, obtaining a total of 4321 publications. Of these, 3,267 are papers, 793 conference papers, 7 conference review, and 253 review.
Were used two databases: the first one was one of the largest databases of indexed journals: Scopus. The second one was the TRID (Transportation research ID) database, which combines records from the information services of the TRB (Transportation Research Board) and the database of transport research documents from the Organization for Cooperation Research Center and Economic Development (OECD). TRID provides access to more than 1.25 million records of transportation-related research around the world.
To query the databases was used the following search protocol: "Urban Freight Transport * and / City Logistics / Pollution Problem / Time-dependent". The results of the publications with each of the attributes and metadata are stored to be systematized later. Table 1 shows the results of the search carried out. In summary, 10,036 results were found, being Scopus the database that yielded most records.
Table 1 - Number of records for each search in the selected databases.
| Search Protocol | ||
|---|---|---|
| urban freight transport* and city logistics | 4814 | 789 |
| urban freight transport* and pollution problem | 2748 | 799 |
| urban freight transport* and time-dependent | 856 | 30 |
| Total | 8418 | 1618 |
To speed up the analysis of over 10,036 published articles, the systematization was carried out with an algorithm developed in the R program that performs a recognition within the title and abstract, using more specific words of interest to the research ("eco-efficiency "," time-dependent "," last mile "," city logistics "," pollution "," cost ").
The algorithm attributes a score according to the number of times the keywords appear in the title and abstract. As follow is creates a new database with encoding and order according to the frequency in which the words appear. The algorithm can quickly rank the papers that will be most relevant to the research. The procedure will reduce the number of items from 10,036 to 2,343.
From the ranking of the 2,343 articles, the first 100 were selected, and reading taking as eligibility criteria the correspondence with the topic discussed: eco-efficiency in UFT. From this selection, references to projects in progress, references that could not be accessed, and references whose reading indicates a different research topic were excluded. At the end of the process, the top 40 best ranked were selected and classified according to the most outstanding attributes. This procedure can be seen more clearly in the flow diagram (Moher, et al., 2009) shown in Fig. 1.

Results and discussion
This bibliometric review presented the results and analysis of relevant scientific production aspects, such as annual scientific production, scientific production by country, number of citations by countries, list of country authors and keywords, most relevant sources, main authors, contribution of institutions, and collaboration between countries.
Fig. 2 shows the number of papers related to UFT, logistics cities and the pollution and time dependence in the last 16 years. The figure shows a pronounced increase in the publications from 2018. Fig. 2 also shows the total number of citations per year, which has an average of approximately 12 by year. It can be observed high citations by paper 59 and 51 in 2012 and 2014 years, respectively. There is also a peak in the total number of citations by year (6 and 7 citations) in these two years.
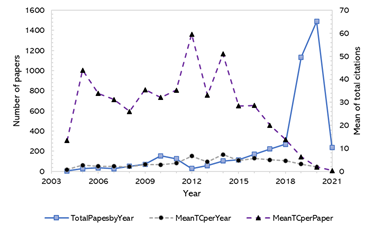
Fig. 3 shows the geographical distribution of papers production about UFT, city logistic, pollution problems, and time-dependence. Table 2 shows the top 20 countries according to the total number of publications. China is the first country with 2,255 publications, followed by the United States and Italy with 998 and 576. In the fourth position the UK and Germany in the fifth position.
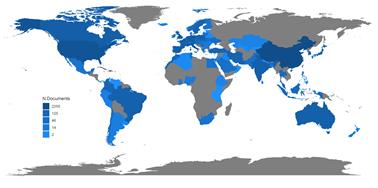
From Table 2 is concluded that the first five countries concentrate 50% of paper production. It is worth to observe that within the first 20 countries with the highest number of papers there are no African countries and only two South American countries (Brazil and Colombia) with 220 and 126 publications respectively.
Table 2 - Top 20 of the countries with the highest number of publications.
| Country | Number of publications |
|---|---|
| China | 2255 |
| Usa | 998 |
| Italy | 576 |
| Uk | 421 |
| Germany | 361 |
| Canada | 298 |
| Spain | 286 |
| France | 266 |
| Netherlands | 264 |
| Australia | 252 |
| India | 249 |
| Poland | 229 |
| Brazil | 220 |
| Iran | 163 |
| Sweden | 154 |
| Turkey | 144 |
| South Korea | 140 |
| Colombia | 126 |
| Belgium | 121 |
Fig. 4 present the number of citations by country. It´s worth noting that China again has the highest number of citations, and only five countries (China, the United States, UK, Holland, and Italy) concentrate about 52% of the 20 countries most cited worldwide.

Fig. 4 - Number of citations by countries on the topic urban freight transport and city logistics and the pollution and time-dependent.
A Sankey diagram was used to visualize the relationship between the main items of three fields (e.g. country, authors, and keyword) and how these fields are related to each other Fig. 5. In this diagram, the width of the lines connecting each field is proportional to the amount of flow. Fig. 5 shows that the top 10 authors are mostly related to China, the United States, Spain, Canada, and the United Kingdom. Considering the top 10 of the keywords, the words sustainability, city logistics, and transportation presents the highest number of occurrences among the top 10 authors.
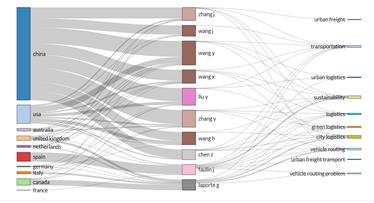
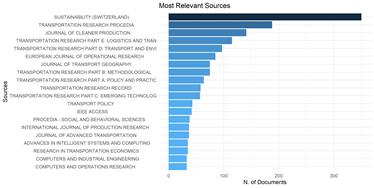
Fig. 6 shown the top 20 journals that host scientific production related to UFT, city logistics, pollution and time-dependent. Sustainability magazine (Switzerland), Transportation Research Procedure, Journal of Cleaner Production and Transportation Research by E and D. stand out as the most important.
Several indices attempt to assess the productivity of researchers and their impact. The H index is a number h articles that have been cited at least h times and measures both the quantity and the quality of the publications. The m index is the H index divided by the number of years since the scientist's first published article. The G-Index measures the overall citation performance of a set of papers. The G-index is where the top G articles have collectively received G citations, the G-index is the largest (single) number so that the top g papers received (together) at least g2 citations.
Table 3 presents the results of the three indexes of the ten most relevant authors in urban freight transport and city logistics and pollution problem and time-dependent. The three indexes reflect similar characteristics of the authors; however, the M index shows Wang X as the third-best author according to this indicator.
Table 3 -Top 10 of the countries with the highest number of publications.
| Author | H_index | G_index | M_index | Total Citations | N° of papers | Year start |
|---|---|---|---|---|---|---|
| Laporte | 22 | 33 | 2.00 | 3002 | 33 | 2011 |
| Bekta | 19 | 28 | 1.73 | 2688 | 28 | 2011 |
| Wang | 13 | 21 | 0.81 | 548 | 57 | 2006 |
| Ehmke | 12 | 23 | 1.50 | 553 | 25 | 2014 |
| Liu | 11 | 18 | 0.79 | 345 | 38 | 2008 |
| Wang | 11 | 18 | 0.85 | 335 | 34 | 2009 |
| Zhang | 10 | 16 | 0.83 | 294 | 48 | 2010 |
| Chen | 10 | 13 | 0.77 | 214 | 31 | 2009 |
| Zhang | 9 | 13 | 0.60 | 221 | 39 | 2007 |
| Wang | 9 | 26 | 0.90 | 676 | 34 | 2012 |
Fig. 7 shows the top 20 institutions with more publications related to UFT, city logistics, pollution and time-dependent. The Chinese University of Beijing have the largest number of publications. In second place is the University of Delf and in third place the University of Southeast China. In this order, most institutions are geographically located in Asia, only 2 in America, and 5 in Europe.
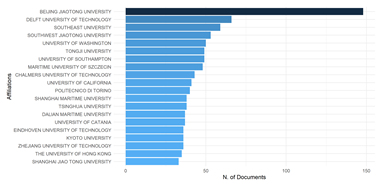
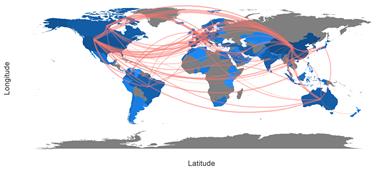
Fig. 8 shows the flow of collaboration between countries showing an intense collaboration between the United States, Canada, Europe, and China, and a low collaboration between South American countries, the United States, and Europe.
After the previous selection of papers were identified attributes related to eco-efficiency and city logistics, and pollution problem. The main attributes observed more frequently in the papers analyzed are the following:
Variable to minimize: This attribute classifies the papers according to the variable to be optimized. In case that reaches the minimum value
Network: relates if the network on which the study is carried out. Can be is real, zones based on real geometries (Based), hypothetical meshes, simple route, or city center.
Software or tool: In this attribute several free-use or commercial tools can be used to solve the problem.
Traffic: This attribute is related to the approach to considering traffic or congestion levels.
Approach or model: Corresponds to the approaches proposed to represent mathematically the routing problem.
Solution method or algorithm: The various approaches or models use different mathematical solutions or algorithms to find the best solution.
Case study: This attribute considers the place of data collection and the place of model application. Concerning the variable to be minimized, there is a prevalence of studies (12) focused effort on minimizing the costs. Some of them combine the variables number of vehicles, fuel consumption, time, and emissions (7). The variable time occupies the second place in the order of frequency (6) and is also associated in some studies with the number of vehicles, distance, cost, and emissions (4), see Fig. 9a. On the other hand, there is an expressive number of studies considering real networks (14) or based on real streets (10). Some works were carried out on a simple route scheme Fig. 9b.
There is a wide variety of programs and tools to implement optimization solutions among them the most used are: CPLEX (8) under different programming languages such as Java, C ++, Matlab, micro and macro simulation programs such as AISUM (4) and EMME (1), VISUM (1). Other mathematical simulation programs used are GAMS (2), MATSim (1), and AMPL (1). The graphical results can be seen in more detail in Fig. 9c.
Most of the studies (30) involve traffic analysis in some of their research; only ten do not consider this variable in their analysis. The most common approaches in considering traffic are data-based map traffic allocation, counts, deterministic and stochastic allocation (11). Other approaches have been considered in studies such as Micro and macro simulations (6) and dynamic traffic simulations (4). Few studies have used historical speed data (3), and congestion levels by area and period of the day (3). These results can be seen more clearly in Fig. 9d.
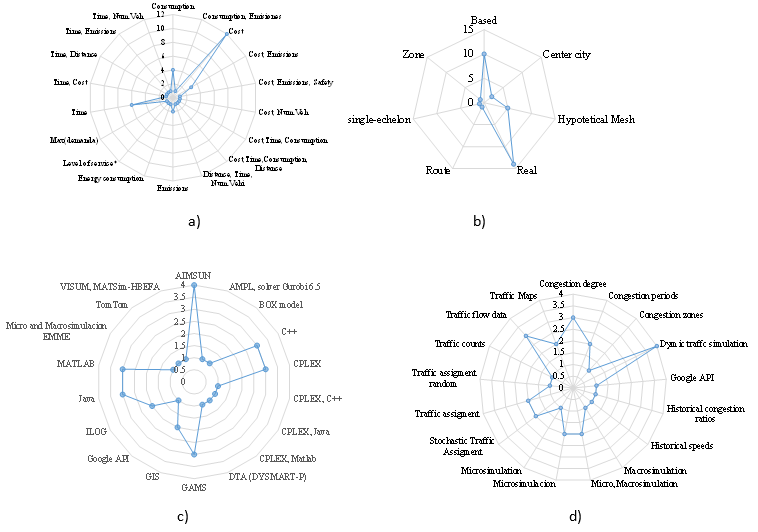 a) Variable to minimize, b) Network, c) Software or tool, d) Traffic
Fig. 9 - Radial graphs of the frequency of the attributes of the revision.
Among the most frequent solution methods or algorithms are the exact algorithms based on mixed-integer linear programming and, secondly, approximate algorithms based on heuristics and metaheuristics. Regarding the approach used in the investigations, 19 include time windows within the routing problem, of these investigations 15 involve time dependence. The rest of the investigations include demand problems, Dynamic management, Optimization of maximum coverage, Zone-dependent with a mixed fleet, and simulation of microscopic traffic. Of the forty papers analyzed only 29 present case studies. From these, 9 correspond to case studies in Asia, 7 in the United States and Canada, 10 in Europe and the United Kingdom, 2 in South America, and 1 in Australia.
Conclusions
In this research, a bibliometric and systematic literature review on the scientific production on the eco-efficiency of urban freight transport was presented, leading to the following conclusions.
World scientific production shows significant increase in research related to the eco-efficiency of urban freight transport from 2018. However, this production has been concentrated in a few countries and has been very little in emerging countries. It shows a deep inequality in terms of scientific research and puts developing countries at an even greater disadvantage in the face of externalities and the effects on climate change generated by an inefficient urban load distribution. The analyzes also show the need for greater cooperation between emerging countries and the developed countries to contribute to global development in terms of efficiency in urban freight transport.
It is evident the trend of the research objective in urban freight transport focused on minimizing costs, however, even though the reduction of urban transport costs is positively related to the pollution reduction in cities, it is necessary to change the focus towards eco-efficiency where the primary objective is the minimization of externalities.
Because urban freight transport is a problem intertwined with the other traffic actors in cities, it was possible to observe a pronounced trend in the use of traffic simulation programs for routing. However, recently some studies have shown the trend towards the use of platforms that present historical and real-time data of flow, speed, and levels of congestion on the urban network roads.
Within the investigations, the most relevant approaches for the vehicle routing problem include time-dependent and time windows. Regarding solution methods, the most common are exact algorithms based on linear programming.
Most of the studies, even though they include analyzes based on real networks, have not been validated with real field measurements. This can be explained by the difficulty of obtaining collaborative data since the interests of companies and municipal administrations in most cases diverge. Future research can be directed towards testing these models in scenarios that allow the validation of the proposed models.

