INTRODUCTION
In Ecuador, coffee producers have small farms with harvesting and benefit processes characterized by low levels of technology (Gómez-Salcedo et al., 2021b). The coffee benefit is the process of extraction of the coffee grains. Approximately 80-90% of the total weight of coffee cherry is solid waste (outer skin, pulp, and parchment) which have great polluting potential (Ramos-Hernández et al., 2021; Selvankumar et al., 2017). The solid waste from coffee benefit (C) is a potential substrate in biotechnological applications (70% carbohydrates and 11% of proteins on a dry basis) (Perraud-Gaime et al., 2021). Anaerobic digestion (AD) is an alternative for the treatment/use of C (Chala, et al., 2018). Also, is compatible with the environments and activities that produce these wastes. However, C contains recalcitrant compounds, which cause inhibition problems and long-term instabilities of anaerobic digesters. A possible alternative to improve the balance of macronutrients and promote the dilution of toxic substances improving methane and biogas production is anaerobic co-digestion (CoAD) (Rabii et al., 2019; Siddique & Wahid, 2018). Paul and Dutta (2018) recommended CoAD of lignocellulosic biomass with animal manure for optimum C/N to maximize methane production. According to Valverde et al., (2021), in Jipijapa, Manabi Province, coffee, and banana production coexist with livestock activities such as pig farming. Banana pseudostem (Bps) and pig manure (Pm) are potential co-substrates for co-digestion with C. Banana crops generates a large amount of Bps that usually remains in the field to replenish nutrients (Li et al., 2016). The improper handling of Pm also causes severe environmental damage (Pazmiño & Ramirez, 2021), while it constitutes waste of a nutrient source such as nitrogen and phosphorus. Therefore, this work aims to evaluate the co-digestion of solid waste from coffee processing with banana pseudostem and pig manure in terms of methane production, energetic potential, and emission reduction.
2. MATERIALS AND METHODS
2.1. Substrates and inoculum
Coffee benefit solid waste (C) (composed of pulp and peel of the Coffea arabica variety) came from the pulping stage of a benefit center in Jipijapa. Bps (Musa x paradisiaca) (1 cm particle size) and Pm came from Portoviejo, Manabi, Ecuador. Each residue was stored at 4 °C, in hermetic plastic bags. This investigation used inoculum (I) produced with cow manure collected from Portoviejo slaughterhouse mixed with water in a 2:1.5 (v/v) ratio. The inoculum was filtered to remove coarse solids, and subsequently stored at room temperature (25±1°C).
2.2. Analytical methods
The determination of total solids (TS) and volatile solids (VS) was according to APHA (1995), using the gravimetric method. Determination of the elemental proportion of the residue samples based on the Dumas method using a Vario Macro cube analyzer in the Oil, Energy and Pollutants Department of the Central University of Ecuador (Skoog et al., 2014). All analyses were in triplicate.
2.3. Anaerobic batch digestion assays. Analysis of synergies
The biomethane potential assay (BMP) was carried out under mesophilic conditions (35±1 °C) (VDI-4630, 2006). The BMP used glass bottles of 500 mL (400 mL of effective volume) as reactors, coupled to a liquid displacement system (NaOH at 15% w/v) to measure the produced methane volume. The stirring of the reactors prior to gas volume measurement was manual. The BMP evaluated a mixture experimental design for mono substrates, binary mixtures (0.5:0.5), and a ternary mixture (0.33:0.33:0.34) (in triplicate). The experimental design used the VS fractions provided by each substrate in the mixtures. The substrate/inoculum ratio was 0.2 (gVS/gVS), according to Gómez-Salcedo et al., (2021a). The BMP monitored variables were the normalized methane volume at standard conditions (0°C and 1 atm), later expressed as experimental methane yield (Bexp) [NmLCH4/gVS] using the web-based interface OBA (Online Biogas App, https://biotransformers.shinyapps.io/oba1/) (Hafner et al., 2018). The BMP included a blank (inoculum only), and positive control (inoculum + cellulose paper filter), in triplicate. The positive control evaluated the inoculum response, resulting in a methane yield of 362±16.86 NmLCH4/gVS. The kinetic evaluation used the first order model (1) and the Chapman model (2), according to Baquerizo-Crespo et al., (2021) and Pagés-Díaz et al., (2014), respectively.
Where B0 was the maximum methane yield [NmLCH4/gVS], k was the first-order kinetic constant [d-1], b and c were mathematical coefficients obtained from the fitting curve. Model fits used Curvefit app from Matlab 2021a. The statistical criteria analyzed were the sum of squared errors (SSE), coefficient of determination (R2), and root mean square error (RMSE). The constants b and c of the Chapman model are related to the Grenz time (tGrenz) (3). The tGrenz identifies two consecutive days where the daily methane production is less than 1%.
The evaluation of the synergistic and antagonistic effects of CoAD considered the factors proposed by Sánchez et al., (2021) (Equation 4, 5, 6):
Where: φy [%], φk [%], and φtGrenz [%] are the effects of CoAD on methane yield, kinetic constant, and tGrenz, respectively. 𝐵 0𝑒𝑥𝑝𝑒𝑐𝑡𝑒𝑑 and 𝑘 𝑒𝑥𝑝𝑒𝑐𝑡𝑒𝑑 were modeled from the additive model (7) proposed by Baquerizo-Crespo et al., (2021) (Equation 8).
Where x was the fraction of volatile solids contributed by each i component in the mixture.
2.4. Energy potential and emission reduction
The selected criteria for the evaluation of the feasibility of the proposed CoAD were gross energy and greenhouse gases (GHG) emissions avoided (tCO2e). The method was based on Silva & Gallo, (2021) (Equation 9, Equation 10):
Where: Biomass is the assumed calculation basis [1000 kg of fresh mass], LHVCH4 is the lower heating value of methane [35.82 kJ/Nm3CH4], CIref is carbon intensity of reference fossil fuel, considered an average of gasoline, diesel and natural gas [86.7 gCO₂e/MJ], CISW is carbon intensity of solid waste biomethane produced [3.7 gCO₂e/MJ], LHVSWBM is lower heating value of solid waste biomethane produced at standard conditions [34.56 kJ/Nm3], and VolSWBM is the volume of biomethane produced at standard conditions, per 1000 kg of fresh residual mass [Nm3/1000 kg].
RESULTS AND DISCUSSION
Table 1 summarizes the characteristics of each substrate and inoculum. The results were consistent with the literature and indicate a high percentage of organic matter in the composition of analyzed wastes.
Table 1 Chemical composition of substrates and inoculum
| TS (%)* | 26.83±0.04 | 3.41±0.01 | 32.42±0.01 | 2.76±0.01 |
| VS (%) | 81.46±0.32 | 75.50±0.58 | 60.94±1.39 | 55.82 ± 0.26 |
| C (%) | 44.10 | 38.99 | N.D | N.D |
| N (%) | 2.19 | 0.80 | N.D | N.D |
| H (%) | 7.99 | 7.61 | N.D | N.D |
| C/N | 20.14 | 48.73 | N.D | N.D |
(%)*: respect fresh matter; (%): respect total solid, N.D: Not determined
Nava-Valente et al., (2021) reported similar VS content for C (81.80 %). VS for Bps and Pm were 79.8 % (Li et al., 2016) and 63.06% (Zhang et al., 2021b), respectively. Regarding inoculum, the recommended volatile solids content is greater than 50% concerning total solids (VDI-4630, 2006).
The C/N ratio for C was similar to 19.1, value reported by San Martin et al., (2021). According to Ortiz-Ulloa et al., (2021), Bps has a carbon content of 39% on dry basis. Li et al., (2016), report a carbon and nitrogen content in Bps of 38.44% and 1.24% TS, respectively, for a C/N ratio of 31.
In the case of Pm the literature reports C/N ratio between 6 and 14 (Rabii et al., 2019). Guo et al., (2020) reported total carbon and nitrogen values of 37.03% and 4.56%, respectively, for a C/N ratio of 8.12. Duan et al., (2020), reported similar values for carbon (41.18%) and nitrogen (3.86%), for an approximate C/N ratio of 11. Other authors reported higher C/N ratio values, e.g., 20.70 (Zhang et al., 2021b) and 22.1 (Baek et al., 2020), although they are considered low.
Mixtures C/N ratios were calculated for each one through a mass balance based on the characterization of the substrates, and the estimated values of carbon and nitrogen for Pm (39.11 % and 4.21 %, based on total solids, respectively) (Duan et al., 2020; Guo et al., 2020; Rabii et al., 2019). The calculated C/N ratio for C+Pm, C+Bps, Pm+Bps, and C+Bps+Pm were 12.32, 28.22, 14.53, and 16.05, respectively. CoAD is often justified in establishing an optimal C/N ratio in the process feed. Different reports suggest that the optimal C/N ratios in anaerobic digesters should be kept in the range of 20-30, although it is not a unanimous criterion (Muske & Venkateswara Rao, 2019). Thus, according to Zhou et al., (2021) mixtures of substrates with a low C/N ratio, such as cattle manure and microalgae, also present synergistic effects, justified in the organic composition of these residuals (lipid/carbohydrate ratio and protein/carbohydrate ratio. For some authors, other factors that affect the synergistic effects of the mixtures, in addition to the carbon and nitrogen content of the feed, are the composition of the substrate, the bioavailability of carbon and nitrogen of the substrates, limitations in other nutrients, e.g., phosphorus, trace elements, and operational parameters such as pH and temperature (Pagés-Díaz et al., 2013).
3.1 Methane production
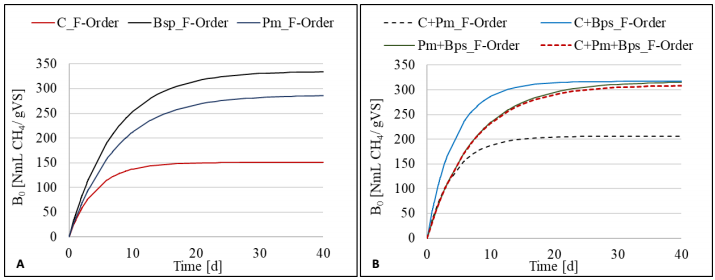
The Table 2 summarizes the kinetic parameters for the mixtures evaluated. The fit of the models was satisfactory (0.98<R2<0.99), although the Chapman model presented lower values of SSE and RMSE. B0 and k values were estimated from the first-order model.
Table 2 Estimated kinetic parameters for the mixtures analyzed in the experiment
|
|
|
|
|
||||||
|---|---|---|---|---|---|---|---|---|---|
| C | 150.7±2.2 | 0.241±0.010 | 3109 | 5.37 | 0.98 | 16.04±0.25 | 400.5 | 1.94 | 0.99 |
| Bps | 335.3±3.3 | 0.141±0.003 | 3727 | 5.88 | 0.99 | 18.63±0.29 | 3141 | 5.42 | 0.99 |
| Pm | 287.0±5.8 | 0.134±0.006 | 11350 | 10.25 | 0.98 | 18.05±0.52 | 7586 | 8.42 | 0.99 |
| C+Bps | 317.0±2.8 | 0.234±0.006 | 4700 | 6.60 | 0.99 | 14.76±0.26 | 2382 | 4.72 | 0.99 |
| C+Pm | 206.1±1.6 | 0.242±0.050 | 1642 | 3.90 | 0.99 | 14.16±0.26 | 1164 | 3.30 | 0.99 |
| Bps+Pm | 361.3±5.5 | 0.135±0.005 | 10410 | 9.82 | 0.99 | 17.87±0.30 | 3882 | 6.02 | 0.99 |
| C+Bps+Pm | 309.6±7.2 | 0.139±0.007 | 18140 | 12.96 | 0.98 | 16.64±0.47 | 7736 | 8.50 | 0.99 |
(*First order kinetic model: B0 [NmLCH4/gVS], k [d-1], SSE* [NmLCH4/gVS]2, RMSE* [NmLCH4/gVS]; ** Chapman model: tGrenz [d], SSE** [d]2, RMSE** [d]; R2 [%])
C had the lowest monosubstrate B0 (150 NmLCH4/gVS). Chala et al., (2018) report methane yields of 245 NmLCH4/gVS for coffee pulp. However, the processing method to store the residual was different: solar drying for 4 days and particle size reduction (1 mm). They also used inoculum from an anaerobic reactor. The Pm presented a B0 in the reported interval (210-320 NmLCH4/gVS) (Chala et al., 2018; Ma et al., 2020). The mono digestion of Pm leads to ammonia inhibition due to its low organic matter content and high ammonium concentration (Srivastava, 2020). Bps presented the maximum value of B0 (335.3 NmLCH4/gVS). Li et al., (2016) reported an ultimate methane potential of 343 NmLCH4/gVS for fresh Bps. Figure 1 shows the accumulative methane yield of mono digestions assays and mixtures.
The binary mixtures of C+Bps and Pm+Bps showed increases in methane yields of 110.35% and 25.88 %, respectively, in relation to the monodigestion of C and Pm. Rabii et al., (2019) state that raw materials characterized by higher C/N ratios, e.g. Bps, can be co-digested by raw materials of lower C/N ratios, e.g. Pm, and C, to avoid improper nutrient balance reducing biogas production.
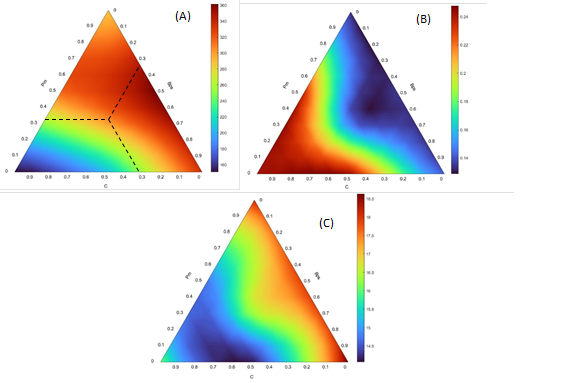
Binary mixtures with Bps were favorable in terms of methane yield (Figure 2A). According to Brown et al., (2012), the methane production has an inverse linear relationship with the lignin content of the material. The lignin content of Bps is 5.77% and that of C is 22% (TS-basis) (Gurram et al., 2015; Ighalo & Adeniyi, 2019). Although the C+Pm mixture presented the lowest methane yield of the binary mixtures, the value obtained (206.1 NmLCH4/gVS) represents an improvement concerning to the C monodigestion methane yield. Ma et al., (2020) concluded that anaerobic co-digestions of animal manure with crops residues in the mix ratios between 40 and 50% (VS-basis) significantly improved methane yields.
C and the binary mixtures that included this residual (C+Bps and C+Pm) presented the highest k. The difference regarding the rest of the experiments was about 70%. Triangular diagram 2b shows that the inclusion of C in mixtures increases the values of k. The conditions and storage times of the residuals could influence this. In this research, due to difficulties in the availability of C, it was stored for a longer time than Bps and Pm. According to Calzada et al., (1981), with the gradual transformation of the composition of the coffee pulp, a lower biogas yield is obtained, but in less time. Gómez-Salcedo et al., (2021a) observed an increase in the first order kinetic constant in anaerobic digestion process of coffee pulp from 0.17 to 0.39 d-1, due to prolonged storage time of the residual. According to Zhang et al., (2022) low temperatures morphologically modify the structure of a lignocellulosic residual, and storage time, rather than temperature, shortens the lag phase and favors the kinetics of the process.
3.2 Technical and environmental criteria for process assessment
The adjustment by Chapman model resulted in the constants for the calculation of the tGrenz. Although there are no differences in the observed tGrenz values, the binary mixtures containing C show the lowest values of tGrenz, in agreement with the improvement in the kinetics of the process related to this residual (Figure 3C). Kafle et al., (2013) employed the technical digestion time (T80), defined as the time needed to produce 80% of the maximum gas production. The T80 for the coffee CoAD and monodigestion variants were 6.65-6.68 d. While for the monodigestion of Bps and Pm were 11 and 12 d, respectively. Comparison of the modeled results for CoAD kinetics versus the additive model (Table 3) indicated that the mixture of organic materials was slightly synergistic.
Table 3 Analysis of synergies and antagonisms factors
|
|
-5.83 | 30.45 | 16.12 | 21.37 |
|
|
28.74 | 22.52 | -1.89 | -18.55 |
|
|
-16.93 | -14.85 | -2.56 | -4.35 |
The analysis of the factors depends on the effect caused and the response variable analyzed. Sánchez et al., (2021) explain that values of φy, and φk greater than zero point towards synergistic effects of CoAD. The C+Pm mix reduced the methane yield, unlike the other mixes. The binary mixture of C+Bps showed the greatest increase in methane yield. Regarding the effects on k, the C+Pm and C+Bps mixtures showed synergistic effects. On the other hand, values of φtGrenz less than zero (φtGrenz<0) point towards synergistic effects, since they suggest that the process will take less time to reach maximum methane production. These factors (φy, φk, and φtGrenz) are practical criteria for the selection of mixtures for CoAD, leading to better equipment sizing, shorter retention times or higher methane yields.
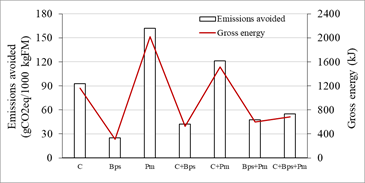
Silva & Gallo, (2021) proposed the evaluation of gross energy and GHG emissions avoided as feasibility criteria for the implementation of anaerobic digestion systems. These criteria are of interest for the analysis of CoAD mixtures in terms of environmental impact and the potential decrease in the consumption of fossil fuels (Figure 3). The C+Pm mixture presented the highest potential for reducing GHG emissions and energy production. C and Pm are the substrates with the highest concentration of VS. Pazmiño & Ramirez, (2021), analyzed the life cycle of pig production in Ecuador, determining that manure generation and management contribute 27.73% of the global warming potential, and recommend the use of these residues in the generation of biogas, fertilizers and compost, to improve this indicator.
Zhang et al., (2021a) evaluated the environmental impacts of anaerobic digestion of pig manure (mono and CoAD with grass silage) to produce biomethane, in addition to the adaptation and use of digestate for soil fertilization. The results indicated that pig manure co-digestion is a sustainable management method and increases the total energy recovery than mono-digestion.
CONCLUSIONS
The mixtures with solid coffee waste showed the best k values, while the methane yield is favored by the presence of banana pseudo-steam. Anaerobic co-digestion results indicated gross energy productions between 400 and 2000 kJ per 1000 kg of treated waste. The results of this study suggested that the CoAD strategy could be applied to increase the benefits of the implementation of biogas technologies to solid coffee waste from benefit process.


