Introduction
Petroleum is a major source of energy and revenue for many countries today, and its production has been described as one of the most important industrial activities in the twenty-first century.1Despite its significance, petroleum processing involves large volumes of waste, with wastewater accounting for more than 80% of liquid waste 2 and as high as 95% in aged oilfields.
Currently, it is known that it has to handle more produced water (PW) than oil, which makes the oil industry more like a "water industry".3 PW is water trapped in underground reservoir rocks and is brought to surface along with crude oil and gas. It contains high concentration of metals such as barium, uranium, cadmium, chromium, strontium and lead, in general PW also contains dispersed oil droplets and dissolved organic compounds and significant amount of anion such as carbonate and bromide sulphate.4 For that reason, it cannot be disposed or injected to the soil sub-surface for secondary recovery purposes keeping in view of the environmental concerns.
A proper management and reuse strategy of the PW are crucial for a sustainable eco-friendly process.A large number of methods are used as treatment technologies such as thermic treatment, gas flotation, chemical separation, filtration, and biological degradation. Several methods are available to remove the dissolved hydrocarbons such as adsorption, volatilization, oxidation, ultraviolet irradiation, precipitation, and biological processes.4 On the other hand, other methods have been implemented to remove the suspended solids (cuttings, sand and clay particles) in that sense the filtration, coagulation, gravity separation, and biological processes are commonly used.1
The dissolved solids which include salt, hardness-precursors ions and heavy metals can be treated by other processes such as ion exchange, precipitation, evaporation, distillation and bio treatment each one presents advantages and disadvantages. However, the combining of different technologies reduce the pollutants almost to undetectable levels, however, the selected treatment method is generally the less expensive according to the specific conditions and type of PW to be processed.
According to 1 adsorption and gravity separation are treatment technologies where their cost and environmental issues are lower compared with other technologies. Due to typical economic limitation and reduced facilities of developing countries, In Cuban oil industry the PW is landfill without an effective treatment. However, the adsorption technology for PW treatment is an interesting option considering the following scenario in the country, Cuba has prospected resources for more than 500 million tons of zeolites in several deposits distributed throughout the island and is a variety of adsorbent very used.
Zeolites are naturally occurring hydrated aluminosilicate minerals. The structures of zeolites consist of three-dimensional frameworks of SiO4 AlO4 tetrahedral. The aluminum ion is small enough to occupy the position in the center of the tetrahedron of four oxygen atoms, and the isomorphous replacement of Si4+ by Al3+ produces a negative charge in the lattice. The net negative charge is balanced by the exchangeable cation (sodium, potassium, or calcium). These cations are exchangeable with certain cations in solutions such as lead, cadmium, zinc, and manganese.5 This property makes it widely used in water industry as ion exchangers and adsorbents.
By using zeolite, the PW pollutants can be effectively removed having as main advantages the low energy requirements; very economic, easier implementation and management in refineries than other imported technologies thus being suitable for Cuban conditions.
Materials and methods
PW from storage tank of “Hermanos Diaz” refinery was used in this study. At the time that the wastewater sample was taken the tank contained a mix of Merey and Mesa 30 crude oil. Samples were characterized by gravimetric and ICP-OES (Inductively coupled plasma - optical emission spectrometry) analysis. Zeolite from San Andrés, Cuba deposit was used as adsorbent for the treatment of this wastewater. The N2 gas sorption, X-Ray fluorescence (XRF) and thermogravimetry (TGA) analysis were performed.
Physical- Chemical characterization of the PW
Results of physical characterization of the PWis showed at table 1. According to 6 in the range of 61 to 120 mg/Lthe water is classified as moderately hard indicating the presence of calcium and magnesium ions, as showed the PW is between the limits near to the superior almost hard. This can pose serious problems in industrial settings, where water hardness is monitored to avoid costly breakdowns in boilers, cooling towers, and other equipment that handles water.
The pH was alkaline nature almost neutral according to 3,7,8 evaluated for PW from Indian and Cuban oil file. Electrical Conductivity showed a value much higher than pure water (0,055 µS/cm) but similar to the oil field PW from India reported in 3 with the value of 13,3 mS/cm. Oil & fast was only due to the presence of suspended litter oil particles in the water samples, so the value was lowest than the reported for 9 of around 1000mg/L. Suspended and sediment able solids was determined, showed higher values.Therefore a gravity sedimentation process before the adsorption phase was performed.
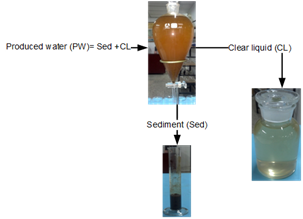
PW was processed in a funnel for gravity, the liquid and solid phase was obtained as show in figure 1.Asediment (Sed) and a clear liquid (CL) was obtained, the CL was put in contact with the zeolite based on experiment adsorption. The chemical composition of S and CL were determined using ICP-OES (Perkin Elmer Optima 3000 device with an axial plasma configuration).
Table 2 presents the chemical characterization of Sed and CL by ICP- OES. It was observed that the major ions in the layer water was Na, K, Mg and Ca, whose values indicate the presence of seawater, filtered through sedimentary rocks, given the proximity from the deposits to the coasts.
Heavy metals like Fe, Zn, Cu and Mn highlighted in the table, was presented in higher concentration in the S that the CL. According to 2 heavy metals in PW was transformed from dissolved to particulate phase in a period of hours under oxygenated conditions, and aggregated to larger particles that settle rapidly over a few days. The particulate fraction was generally more toxic than the dissolved one. Laboratory studies suggest an increase in the toxicity of discharged PW over time.
According to 10 and PW chemical composition, higher concentration of Fe the sediment will be used like cement composite. Despite the heavy metal in CL was lower from bay deposit can cause serious environmental problem for example; Cu toxicity to marine plankton is seen at tenths of µg/L and at even lower levels in laboratory cultures, Zn is not as toxic, but toxicity to plankton is seen at approximately 10 µg/L.
Zeolite characterization
N2 gas sorption
N2 adsorption at 77 K was applied using the Autosorb-iQS. Before the analysis, the sample was degassed overnight at 300 oC. The specific surface area (SBET) was estimated by the BET equation. The amount of gas adsorbed at the relative pressure of p/p0 = 0.96 was employed to determine the total volume of pores (VT). The micropore volume was calculated by applying the De Boer model. The Barret-Joyner-Halenda (BJH) was applied to determine the pore size distribution.
X-Ray Fluorescence (XRF)
XRF analyzers determine the chemistry composition of a sample by measuring the fluorescent (or secondary) X-ray emitted from a sample when it is excited by a primary X-ray source. XRF experiments were performed using a Bruker S4 Explorer dispersive XRF spectrometer, 1000W. Powdered samples <125µm were measured in a He atmosphere. The observed intensities of the analyzed samples were compared to a set of universal calibration standards.
Adsorption experiments
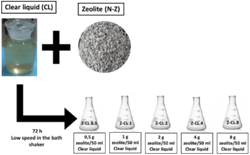
The virgin natural zeolite (N-Z) samples were grinded (<0,1 mm) and dried overnight at 1050C in order to homogenize the moisture content. After that a batch experiment for CL treatment using zeolite adsorption was performed. To make the experiments different dosages solid liquid (S/L) was used. Between 0,5- 8,0 g of zeolites in 50 ml of CL as show in figure 2 was employed. The samples were called Z-CL (0.5-1-2-4-8) according to the mass used in the contact. The different Z-CL samples were placed in the shaker at room temperature, 70 rpm at 72 hours like equilibrium.
The first analysis done at the liquid samples after adsorption experiments were colour and odour Colour was determined by direct comparison with standards and presented in somewhat arbitrary terms of colour scale, which was observed by naked eye. Qualitative tests that employ the human sense of smell was used for odour purpose.11
According to 12is possible to determine oil concentration after adsorption using an UV spectrophotometer at 295 nm. In order to make a first quantitative analysis of the adsorption test, measurements of the absorbance of the CL before and after contacting with N-Z were performed. Ultraviolet (UV) spectroscopy (on an Ultrospec 7000, UV-Vis) was used to determine the absorbance unit.
ICP-OES
Metal ion adsorption capacity of zeolite was determined according to equation 1. The concentrations of metal ion on solution after adsorption experiments were performed using ICP-OES.
Where Q (mg/g) amount of metal ions absorber, Ci and Cf (mg/L) are the concentrations of the metal ion in initial and final CL, respectively. V is the volume of the solution (mL) and W is the weight of the adsorbent (g).
The percent adsorption (%) was calculated using the equation 2:
Thermo gravimetry (TGA)
In order to know adsorption of organic and inorganic compounds in the samples the zeolite samples with the best dosage, according to the result of the ICP-OES was analysed by TGA.TGA analysis was performed using a thermo gravimetric analyser model Q 500. About 10 mg of zeolite samples were heated in the platinum cell from room temperature to 550 0C under N2 atmosphere and then switched to O2 and heated further to 810 0C, to have idea of the organic volatile compounds. Approximately 82 mL/min was used as gas flow at a heating rate of 20 0C/min.
Results and discussion
Characterization of PW vs. Cuban standards
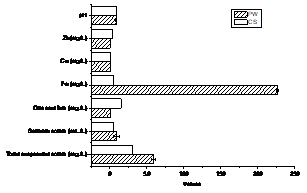
Taking in to account that PW is discharged to the Santiago the Cuba bay Cuban standards (CS. 521: 2017 Discharge of wastewater to the coastal zone and marine waters) were used as reference to know the grade of contamination of the PW. Chemical composition of PW was calculated as a result of the sum of ion metallic of the S and CL. Figure 3 displays the comparison of the characterization of PW with the Cuban standards.
The sedimentable solids, total suspended solids and Fe was over the maximum allowable limit while the pH and Cu was near. The solids were clearly reduced by gravity sedimentation. The great amount of Fe was precipitated in form of oxide but the other heavy metal need to be reduced because despite its low concentration these tend to accumulated. On the other hand a lot of standards not take it into account. For that reason the zeolite was proposal in this researcher for reduced heavy metals ions.
Caracterization of natural zeolite
Textural characterization
The textural characteristicof N-Z was done by BET analysis. The table 3 shows surface area result. The SBETwas 35,3 m²/g are in correspondence with those natura pores material (10 - 100 m2/g) such as clay and other type of zeolite. BET data also showed that the zeolite can be classified as a micro-porous size with 13,74 Å or 1,374 nm. According to IUPAC, micro-porous diameter lies in the range of < 2 nm.The microporous textural properties was showed determined T-plot anlysis.
The parameters were typical from naturel zeolite and the adsoption process is much selective fron inorganic molecule.
Chemical composition of N-Z
Table 4 shows the chemical composition of N-Z expressed in % based on oxide by XRF analysis. The content of silica and alumina was the main composition of the zeolite.
Other elements contain in the zeolite was K+, Na+, Ca2+ and Mg2+, which act as compensation cations or interchangeable cations, was similar to those reported by.13 The rest of the composition was considered impurities that occupied the zeolite pores. The Si/Al ratio was 5,05 generally ranging from 4 to 5,5 are typical for clinoptilolite.
Adsorption experiments
CL was place in contact with N-Z under condition that was showed in figure 2. After adsorption process the liquid and the solid face for each S/L ratio samples was characterized by ICP-OES, spectrophotometry analysis, XRF and TGA.
First during sample collection (figure 4) significant differences weren’t founded in the colour (image after 72 hours of contact) and odour of the experiment adsorption. All samples were pale yellow may be due to the presence of total dissolved solids. The slight odour was like a mix of seawater and aromatic organic compounds (OC) from the oil.
After the contact, the CL resulted of the adsorption process was studied used the spectrophotometer at 295nm in order to have an idea of the OC adsorption. Table 5 presents the mean absorbance values for the extracted solution of the zeolite samples. Five experiments were performed, and the statistical parameters, error (±) like standard deviation were determined.
Significant differences were not found between the samples studied. According with this analysis N-Zwere not good in the adsorption of OC from this PW. Adsorption capacity was determined by the pH of the solution and the surface area. According to 14 the adsorption of carboxylic groupis favored at acid pH. At pH values higher like this PW decrease the amount adsorbed, because the electrostatic interactions between the molecule and the zeolitic surface diminish. These results are in good agreement with those reported by other authors14,15. The adsorption of VOCs (Volatile organic compounds) efficiency depends on the specific surface area of the used material. The adsorption involved mesopore filling and external surface coverage. The adsorption capacity depended on the textural parameters of the zeolites, at 35 m2/g (table 3) is not higher enough surface area to OC, being effective in areas of 75 m2/g reported.15 Also modification of clinoptilolite by organic surfactants exhibits a much higher competence in the removal of organic compounds, depending on the process conditions, and the OC efficiency getting almost 50 to 98%.
Until now, the different doses evaluated in the adsorption experiments were studied. The liquid phase was analysis by UV-Vis at 295nm.Significant changes between doses in terms of the adsorption of OC was not found. The behavior was for the pH of the solution being basic and the textural characteristics of the N-Z such as low surface area. The subsequent experiments the adsorption of inorganic compounds will be evaluated.
Chemical composition in CL before and after adsorption experiment
The figure 5 shows the chemical composition by ICP - OES of the heavy metals in CL before and after zeolite adsorption experiment of different S/L ratio studied.
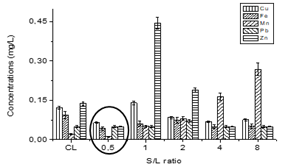
Fig.5 Behaviorof the chemical composition of the CL before and after zeolite adsorption as a function of different S/L ratio
The best S/L ratio was obtained for 0,5 because in the other relationships at least one of the elements studied increases its concentration, as is the case of Zn in 1 and 2 ratio and the Mn in 4 and 8. The zeolite has been released these cations and the final concentration has increased with respect to the initial one, since these cations are part of the zeolitic structure. This behavior was observed by 5 where elements that were part of the zeolite structure were also released.
The heavy metal uptake is attributed to different mechanisms of ion-exchange processes as well as to the adsorption process. During the ion-exchange process, metal ions had to move through the pores of the zeolite mass, but also through channels of the lattice, and they had to replace exchangeable cations (mainly sodium and calcium).
The tables 6 and 7 show the result of the adsorption capacity and % adsorption of the zeolite result from the best S/L ratio 0,5. The equations 1 and 2 were used to get the values.
Table 6 Adsorption capacity of zeolite by metal ion after 72h of contact from the best S/L ratio 0,5

Adsorption on natural zeolite is produced following the sequence Zn2+> Fe2+> Cu2+> Mn2+.Although the removal percentages was between 40 and 60%, the amount of metal ions adsorbed onto zeolite was very small given that the concentrations in CL were too. The selectivity of the zeolite could be given by other compounds, but in higher concentrations in the CL. Therefore, adsorption tests of these metals in zeolite are mainly present in solutions with concentrations ranging from 50 to 200 mg/l.16
Once evaluated the behavior of heavy metals in CL after contact with N-Z for the best S/L ratio, the contribution of the other compounds was also analyzed.
Figure 6 shows the contribution of other elements that are part of the zeolite structure (table 5) that favored or not the exchange at 0,5 S/L ratio.
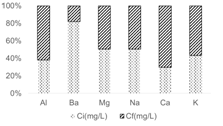
Fig.6 Contribution of other elements that are part of the zeolite structure on adsorption process at 0,5 S/Lratio
An increase in the final concentration of Al3+ was observed, called dealumination, that according to 5 has a significant impact on capacity ion exchange, since the negative charges that must be compensated by the exchangeable ions are reduced. Ca2+ and K+ also increased their concentration, that is, they went from the structure of the zeolite to the residual. This proves that the exchange process was given by the Al3+, K+ and Ca2+ ions of the zeolite that they exchanged with the metal ions present in the CL. The final concentration of Ba3+, Mg3+ and Na+ decreased in solution resulting so they were absorbed by the zeolite.
Chemical analysis of the exhausted zeolite at 0,5 S/L ratio
The chemical analysis to the sample of zeolita by XRF analysisto the best S/L ratio is showed in table 8. The decrease in the content of Al2O3 and CaO, 0,4% and 1,45% respectively with respect to N-Z (table 5) was observed. This tests its passage from the structure of zeolite to CL. These results don’t show that, for example, Zn and Mn were retained, in contrast to the previously presented results that these heavy metals were absorbed by zeolite. This was because the amount of metal ions adsorbed onto zeolitewas so low around 9*10-3 mg/g and was not perceptible by the characterization technique.
Table 8 Chemical composition of Z-CL expressed in % based on oxide by XRF from the best S/L ratio, 0.5

The speciation of the heavy metal in solution, the surface charge of the sorbent as well as the nature and structure of the zeolitic materials could be some of the factors which was involved on the ion exchange or adsorption mechanisms.
The best dose to carry out the adsorption process was 0,5 g of zeolite per 50ml of CL (0,5 S/L ratio) according to the evaluation of the solid phase by ICP-OES the higher doses increase the inorganic compounds that are part of the zeolite structure. The selectivity of the zeolite of heavy metal was Zn2+> Fe2+> Cu2+> Mn2+ and the ion exchange occurring by Al2O3 and CaO at the best doses.
TGA analysis
Figure 7 displays the TGA results in nitrogen and oxygen atmospheres for2 samples: N-Z and Z-CL 0.5.The mass loss percentage was showed in figure 7 a) give information on changes in sample composition. First under N2 atmosphere was evident the loss of moisture and the same behavior of both curve according to the before analysed to the not adsorption of organic compounds. Since 600°C after switching into an O2 atmosphere both samples N-Z and Z-CL0,5 presented a litter different in ash content 87,9% and 88,3% respectively related the inorganic compound adsorption analyzed above.
Figure 7b) displays the derivative weight loss in (wt %/◦C) vs. temperature (DTG curves). A single peak was observed under N2 atmosphere and none in the inorganic compounds zone (600-8000C). The peak of the derivative indicated the point of greatest rate of change on the weight loss curve, attributed to loss of water from both samples. The area under a DTA peak was also examined. This is related to the enthalpy of the thermal event, ΔH attributed to thermal decomposition in samples. Differences marked were not found between the values, 11,93 to N-Z and 11,47 to N-CL0,5 corroborating the analyzed before.
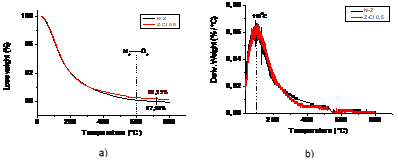
Fig 7-a) Thermogravimetric (TG) curves and (b) derivative weight loss curves (DTG) for N-Z and Z-CL 0,5 under N2 and O2 atmosphere
Current researches are paying more attention to the consequence of dissolved OC, heavy metals and production chemicals on living organisms, since their long-term effects on the environment are not fully documented and understood. It has been reported that metals and hydrocarbons from oil platforms are very toxic to the ecosystem and fish exposed to alkyl phenols have disturbances in both organs and fertility.1In this sense, research in the treatment of PW should be continue, so an approach to the behavior of activated carbons as an adsorbent of this residual complex is proposed.
Conclusions
1- Significant changes between doses in terms of the adsorption of organic compounds were not found evaluated by UV-Vis at 295nm, the behavior was for the pH of the solution being basic and the textural characteristics of the N-Z such as low surface area of 35 m2/g.
2- Differents doses of zeolite vs. CL were studied, the best dose to carry out the adsorption process was 0,5 g of zeolite per 50ml of CL according to the evaluation of the solid phase by ICP-OES the higher doses increase the compounds that are part of the zeolite structure in the other hand the evaluation of the liquid phase with the UV-Vis at 295nm significant changes were no observed, demonstrating the non-adsorption of organic compounds.
3- At the best doses the selectivity of the zeolite of heavy metal was Zn2+> Fe2+> Cu2+> Mn2+ and the ion exchange occurring by Al2O3 and CaO, also was evaluated by TGA analysisdetecting a small difference in ash content between the virgin and exhausted zeolite that confirm the adsorption of inorganic compounds.


