


Mi SciELO
 Servicios personalizados
Servicios Personalizados
Articulo
 texto en
  Inglés (pdf)
 Articulo en XML
 Referencias del artículo
 Enviar articulo por email
Indicadores
-
 Citado por SciELO
Links relacionados
-
 Similares en
SciELO
Similares en
SciELO
Compartir

 Permalink
Cultivos Tropicales
versión On-line ISSN 1819-4087
cultrop vol.41 no.1 La Habana ene.-mar. 2020 Epub 01-Mar-2020
Original article
Food accessibility in municipalities of the provinces of Mayabeque and Artemisa. A vision of consumers
1Instituto Nacional de Ciencias Agrícolas (INCA), carretera San José-Tapaste, km 3½, Gaveta Postal 1, San José de las Lajas, Mayabeque, Cuba. CP 32 700
2Universidad Agraria de La Habana “Fructuoso Rodríguez Pérez”, carretera a Tapaste y Autopista Nacional. San José de las Lajas. Mayabeque, Cuba
A study was conducted in the municipalities of San José de las Lajas and Bahía Honda, Cuba, with the objective of knowing the level of accessibility to food by the population in 2013 and 2015. The indicators analyzed were availability based on the supply in the points of sale in popular councils of those localities. To carry out this work, a total of approximately 100 consumers were surveyed in each municipality, each year. In the month of August of each year surveyed, a total of 10 or 15 points of sale were visited in the two municipalities, visited several times. It can be concluded that the supply of accessible food products for the population of the municipalities is still poor in quantity, quality and variety. The most serious problem is the high prices of products in these popular markets. Frequently, will be able to find a small increase in years of diversity but the price has grown more. However, there is enough production and / or potential in them to solve this situation. In two ways: on the one hand prioritizing the amount of food that satisfies the demands, on the other increasing production accompanied by variety and quality through the installation of irrigation infrastructure and putting to produce the land that is still idle or weakly used, as well as through the reorganization and stabilization of the production chain of the products. It is necessary to update the infrastructure of the markets and their mechanisms. There is a capacity to respond to the risks of food vulnerability in both municipalities.
Key words: food; human nutrition; food consumption; market access
INTRODUCTION
There are many factors that impact the acquisition of food 1: income, food prices, preferences and individual beliefs, cultural traditions 2 and geographical, environmental and socioeconomic factors which interact in a complex way to set individual eating habits 3.
Therefore, promoting a healthy food environment, which includes food systems that promote a diversified, balanced and healthy diet, requires the participation of different actors and sectors. In the report “The State of World Food and Agriculture” 4, the FAO Organization recalled that the official number of hungry people in the world is about 870 million people, and the World Food Program (WFP) 5, reports that the number of undernourished people after having steadily declined for more than a decade, again increases hunger in the world, which affected 815 million people in 2016, which is 11 percent of the world population. At the same time, multiple forms of malnutrition threaten the health of millions of people 6.
This increase is largely due to the proliferation of violent conflicts and climate-related disturbances, affecting rural societies that face the effects of climate change, which are expressed, among other ways, in the intensity and frequency of natural disasters like the hurricanes that hit the Caribbean this season, with huge social and economic costs. These are signals of maximum alert, emergencies of great magnitude caused by climatic phenomena such as: the consequences of the El Niño-Southern Oscillation phenomenon of 2015 7 was the second most extreme and of the longest duration recorded so far, seriously affecting the food security of millions of people during 2016. Hurricane Matthew in 2016 8, the one with the greatest intensity in the Caribbean since 2007, had especially devastating consequences in Cuba and Haiti and finally, the monstrous hurricane Irma 9 that with category 5 affect more than 7 Cuban provinces, Puerto Rico and other Caribbean islands, being considered the most potent of all hurricanes, these phenomena greatly affected Cuban agricultural production.
There are several definitions of food security 10, but the most accepted is that of the World Food Summit (WFS) of 1996 “Food Security at the level of individual, household, nation and global, is achieved when all people, at all times, they have physical and economic access to sufficient food, safe and nutritious, to meet their nutritional needs and preferences, in order to lead an active and healthy life”
Currently, sustainable local agricultural development is a key element to guarantee food security 11) and at the national level in Cuba many municipal actors have a strong leadership and responsibility. In this sense, Cuban policy is promoting decentralized management of municipalities and municipal strategic planning as a way to guarantee local development.
In this scenario, sustainable agricultural development and food security are a strategic priority for economic and social development until 2030. Today there is limited collaboration between consumers, producers, processors and food marketers with Cuban banking entities, which limits the accelerated growth of food production in terms of quality, quantity and temporality demanded by Cuban consumers. Insufficient incentives to foster the alliances of educational institutions, research and agricultural development with the cooperative and private sector that maximizes the introduction and effective extension of scientific/technical services in the varied Cuban rural context. The affectation of the agricultural activity by the variations of the climatic change, that causes the instability of the yields.
To the previous points are added social situations such as population aging, the mobility of young people towards development zones with greater economic remuneration and social recognition, emigration, which affects the decrease of the labor force in agriculture. Income from salaries and pensions is insufficient to assume the increase in food prices, there is insufficient participation and leadership of women in agro-productive scenarios, there is a need for training of producers who access the land in usufruct for its proper use and conservation; and there is a growing need to train governments to face the challenge of decentralized management of the municipality and take on the challenges of local agricultural innovation.
It is necessary, a participatory approach to implement learning methodologies in action to achieve a sustainable increase of agricultural products, such as those executed in the Local Agricultural Innovation Program (PIAL) 12, which has been the benchmark for organize a collective action to face the challenges of food security of the participating municipalities. This approach has been put into practice in the design of a Local Agricultural Innovation System (SIAL) 13, which has in its structures: Multiactoral Management Platforms (PMG) and Local Agricultural Innovation Groups (GIAL) articulating people allies in the supply chains and food production and processing. The platform is a municipal space for coordination and articulation of local actors, characterized by the leading participation of producers, reconciling interests, agendas, policies, programs and concrete actions based on a common challenge, which respond and enrich the municipal strategies of development so that the efforts of local actors are gradually directed to meet the demand of municipal residents 14.
A study was carried out in the municipalities with the objective of knowing the level of accessibility to food by the population in 2013 and 2015, based on the offers of the different agricultural products on the market.
MATERIALS AND METHODS
The work was carried out in the San José de las Lajas and Bahía Honda municipalities of the Mayabeque and Artemisa provinces respectively, during the months of July to September 2003 and 2015, months where there are more people on vacation and children do not they are in schools. The markets in both municipalities were characterized by the absence of refrigeration or air conditioning equipment in the sales premises, and the goods were exposed to the environment in wheelbarrows or counters.
San José de las Lajas (GPS coordinates: 22.961 latitude N, -82.151 longitude O) is the largest municipality in extension and population and capital of the new province of Mayabeque. It covers a livestock and industrial zone. It has a territorial extension of 593 square kilometers the municipality has 76 000 inhabitants (2015). It is also a highly diversified region of high industrial potential, particularly on the axis around the Central Highway and the National Highway with construction materials, chemical, food, metallurgical and electromechanical industries and beverages and spirits. The Agrarian University of Havana “Fructuoso Rodríguez Pérez” (UNAH) is located in this municipality and trains professionals with an emphasis on agricultural profiles in Agronomy, Mechanical Engineering, Irrigation and Drainage and Veterinary Medicine, among other specialties.
Large centers of agricultural scientific research are located in this area such as the National Center for Animal Health (CENSA), the Institute of Animal Science (ICA) and the National Institute of Agricultural Science (INCA). In the field of Health, it has a General Hospital in addition to the Teaching Polyclinics that serve the community.
Bahía Honda is a town and municipality belonging to the current province of Artemisa. Until the end of 2010 it belonged to the Pinar del Río Province. It is located on the north coast of Cuba, about 80 km west of Havana. In the municipality is the highest point of the province, Pan de Guajaibón, with 699 m high. The population amounted to 43 351 inhabitants in 2019. The total area was 784 km². Its economy is mainly agricultural, minor crops are currently cultivated and livestock and logging are developed on the northern slope of the Sierra del Rosario.
Methodology used to obtain information related to food accessibility in the territories
The M&E team of the PIAL project participated in the design of a survey in order to determine indicators to assess accessibility to agricultural products by the local population in some municipalities. It is noted that Access to agricultural products is understood as: “The real possibility of the population to obtain the food products of agricultural origin that they need for their food”.
The fundamental parameters to measure this real possibility of access to food are given by:
The existence of them in the market
That people have the necessary money to acquire them in the necessary quantities at sales prices
That the distance of people to the market allows them to be acquired at the time they are needed
In the present analysis, it was understood to combine two techniques of information collection which are:
The sampling survey, which measures supply indicators as well as the perception and satisfaction of the inhabitants
The observation, which will measure the prices and diversity of the products offered in the visited markets
The two data collection techniques will provide quantitative and qualitative information. The work was carried out between July and September of 2013 and 2015.
The sample consisted of four to six markets with 80 to 100 consumers in each municipality, that is, in each information gathering they will be carried out on several occasions (4 visits to each market), between 16 and 24 observations and approximately 100 surveys. The points of sale were used to carry out the interviews with consumers, based on a sample of confidence that allowed the reliability of the information collected. The process steps appear in Table 1.
Table 1 Process steps to assess food accessibility in municipalities of the Mayabeque and Artemisa provinces with a consumer vision
| Nu. | Activity | Date |
| 1 | Obtaining authorization from local authorities for the execution of surveys and the collection of information | July 2013 and 2015 |
| 2 | Start-up workshop with the municipal pollsters and the PIAL M and E team, to deliver documentation and explain the characteristics of the surveys and their scope in the territories | July 2013 and 2015 |
| 3 | Surveys and information gathering in the territories | 1 to 30 of August of the years executed |
| 4 | Final Workshop on accessibility to food products, to present and evaluate the information collected. | September 2013 and 2015 |
| 5 | Return of results obtained with local multi-agency platforms and participation of respondents. | September of each year |
| 6 | Delivery of results to the M and E team of the project | At the end of September of each year. |
RESULTS AND DISCUSSION
Characteristics of consumers detected in market surveys
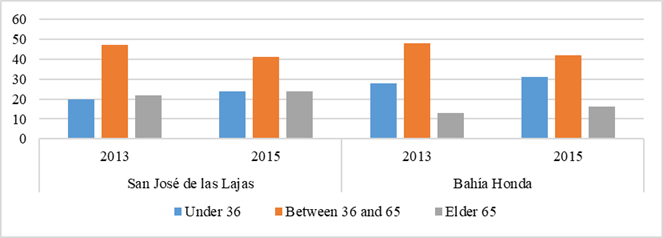
Consumers surveyed according to age in the two municipalities in August 2013 and 2015 maintain very similar estimated ages in both locations and three years (Figure 1). The consumers who visit the markets the most are those between the ages of 35 and 65, in San José, young people and senior citizens maintain similar proportions, and in Bahía Honda, young people double the number of seniors who they visit the markets. The similarity between years in each locality suggests a good sample used to estimate accessibility.
For the first time in 2009 15, a national survey of food consumption was carried out, to know the food situation of the country allowing actions to improve the current health situation, it was tried to characterize food consumption and food preferences of the Cuban population 15 years of age and older.
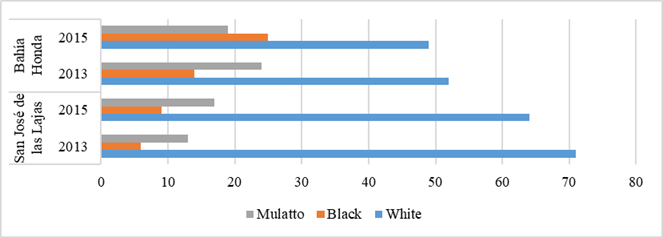
According to the results discussed above, the quantities of consumers evaluated, the methodologies used and the systematicity executed in two years give a foundation for the data and classifications made in this work. In the case of the visual classification of the breed, it is observed in Figure 2 that there is a marked difference from one municipality to another, the blacks who visit the markets in Bahia Honda double the market attendants in San José, in this municipality Whites are a large majority, over passing those of Bahia by almost 20 %, these results are in correspondence with the percentages of inhabitants who reside in those municipalities.
With respect to the classification of consumers surveyed by age, race and sex in the different years, it is possible to see what was discussed about the most distinctive ages and sexes in the two locations.
With respect to sex, men in San José represent 48 % of the respondents and in the case of Bahia Honda they only become 38 % and may be due to being a more rural municipality, women are still the ones who participate most in the market for the purchase of food in both municipalities (Table 2).
Table 2 Classification of consumers surveyed by age, race and sex in different years
| Municipality | Year | Age | Race | Sex M | Sex F | Total | Municipality | Year | Age | Race | Sex M | Sex F | Total |
|---|---|---|---|---|---|---|---|---|---|---|---|---|---|
| San José de las Lajas | 2013 | Between 35 and 65 | White | 19 | 19 | 38 | Bahía Honda | 2013 | Between 35 and 65 | White | 14 | 23 | 37 |
| Mulatto | 1 | 3 | 4 | Mulatto | 5 | 6 | 11 | ||||||
| Black | 1 | 4 | 5 | Total | 19 | 29 | 48 | ||||||
| Total | 21 | 26 | 47 | Elder than 65 | White | 3 | 3 | 6 | |||||
| Elder than 65 | White | 9 | 7 | 16 | Mulatto | 1 | 0 | 1 | |||||
| Mulatto | 4 | 1 | 5 | Black | 4 | 2 | 6 | ||||||
| Black | 0 | 1 | 1 | Total | 8 | 5 | 13 | ||||||
| Total | 13 | 9 | 22 | Under 35 | White | 0 | 9 | 9 | |||||
| Under 35 | White | 6 | 11 | 17 | Mulatto | 1 | 11 | 12 | |||||
| Mulatto | 0 | 4 | 4 | Black | 5 | 3 | 8 | ||||||
| Total | 6 | 15 | 21 | Total | 6 | 23 | 29 | ||||||
| 2015 | Between 35 and 65 | White | 15 | 22 | 37 | 2015 | Between 35 and 65 | White | 8 | 14 | 22 | ||
| Mulatto | 5 | 6 | 11 | Mulatto | 2 | 6 | 8 | ||||||
| Black | 1 | 1 | 2 | Black | 6 | 6 | 12 | ||||||
| Total | 21 | 29 | 50 | Total | 16 | 26 | 42 | ||||||
| Elder than 65 | White | 7 | 6 | 13 | Elder than 65 | White | 4 | 5 | 9 | ||||
| Mulatto | 3 | 2 | 5 | Mulatto | 3 | 0 | 3 | ||||||
| Black | 5 | 1 | 6 | Black | 4 | 0 | 4 | ||||||
| Total | 15 | 9 | 24 | Total | 11 | 5 | 16 | ||||||
| Under 35 | White | 8 | 14 | 22 | Under 35 | White | 3 | 15 | 18 | ||||
| Mulatto | 2 | 4 | 6 | Mulatto | 3 | 5 | 8 | ||||||
| Black | 2 | 6 | 8 | Black | 3 | 6 | 9 | ||||||
| Total | 12 | 24 | 36 | Total | 9 | 26 | 35 | ||||||
| Total | 97 | 104 | 201 | Total | 69 | 114 | 183 |
General characterization of the markets visited in 2013 and 2015
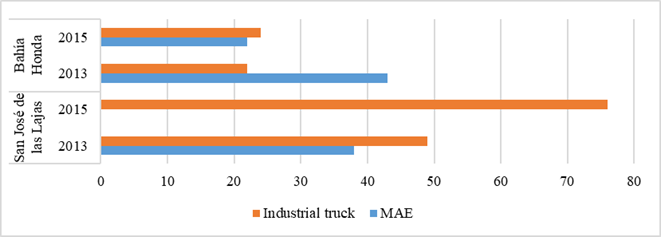
In Figure 3, it is observed, in Bahia Honda there is a balance between the types of markets, there are wheelbarrows at various points, there is the MAE and there are almost equally important other cooperative and individual establishments that support the sale of food products. In the case of San José, the industrial trucks carried the fundamental action of selling food and that allows greater accessibility because they move in the neighborhoods.
When evaluating what has been observed in the various sales points in Table 3 by the evaluators, the high diversity in vegetable products, foodstuffs and grains and preserves thereof, which the trucks have, is shown. The state agricultural markets maintain a lower diversity of food, vegetables and grains, but offer the types of meat naturally and fundamentally processed.
Table 3 Diagnosis of sales diversity by generics observed at points of sale in 2013 and 2015
| Municipality | Year | Point of sale | Total Offers | Natural Form | Processed | Types of meat | Natural Form | Processed |
|---|---|---|---|---|---|---|---|---|
| San José | 2013 | Industrial truck | 111 | 100 | 11 | 0 | 0 | 0 |
| MAE | 33 | 25 | 8 | 13 | 8 | 5 | ||
| Others | 8 | 8 | 0 | 0 | 0 | 0 | ||
| Subtotal | 2013 | -- | 152 | 133 | 19 | 13 | 8 | 5 |
| 2015 | Industrial truck | 6 | 6 | 0 | 0 | 0 | 0 | |
| Others | 33 | 25 | 8 | 13 | 8 | 5 | ||
| Subtotal | 2015 | -- | 39 | 31 | 8 | 13 | 8 | 5 |
| Total San José | 2013-2015 | -- | 191 | 164 | 27 | 26 | 16 | 10 |
| Bahía Honda | 2013 | Industrial truck | 23 | 21 | 2 | 1 | 1 | 0 |
| MAE | 53 | 53 | 0 | 2 | 2 | 0 | ||
| Others | 27 | 27 | 0 | 1 | 1 | 0 | ||
| Subtotal | 2013 | -- | 103 | 101 | 2 | 4 | 4 | 0 |
| 2015 | Industrial truck | 30 | 29 | 1 | 1 | 1 | 0 | |
| MAE | 3 | 3 | 0 | 0 | 0 | 0 | ||
| Others | 0 | 0 | 0 | 0 | 0 | 0 | ||
| Subtotal | 2015 | -- | 43 | 42 | 1 | 4 | 3 | 1 |
| Total Bahía Honda | 2013-2015 | -- | 146 | 143 | 4 | 8 | 7 | 1 |
| General Total | 2013-15 | -- | 337 | 307 | 31 | 34 | 23 | 11 |
In the case of eggs, they are sold by the MAEs but there is not always assistance from them and the individual producers sell them directly on their farms. There is the absence of a market with better conditions where all available products are presented in an organized, accessible and better quality way that quickly achieves selection by consumers.
Consumer criteria detected in the markets visited in August 2013 and 2015
The criteria of the consumers to acquire food products from San José de las Lajas (Table 4) in the two years of evaluation are defined by the prices of the products fundamentally and the purchasing power as per element, but well away from the first and minor Importance of existing offers, did not pay attention to the distance that are the points of sales.
Table 4 Criteria of the consumers of the San José de las Lajas municipality according to race and age to acquire the products by municipality in 2013 and 2015
| Year | Race | Products prices | Purchasing power | Existing Offers | Distance Point Sale | Others | Total |
|---|---|---|---|---|---|---|---|
| 2013 | White | 31 | 21 | 14 | 1 | 4 | 71 |
| Mulatto | 8 | 3 | 1 | 1 | 0 | 13 | |
| Black | 2 | 1 | 2 | 0 | 1 | 6 | |
| Total | 41 | 25 | 17 | 2 | 5 | 90 | |
| 2015 | White | 34 | 18 | 9 | 1 | 2 | 64 |
| Mulatto | 11 | 3 | 3 | 0 | 0 | 17 | |
| Black | 4 | 3 | 1 | 1 | 0 | 9 | |
| Total | 49 | 24 | 13 | 2 | 2 | 90 | |
| General Total | 90 | 49 | 30 | 4 | 7 | 180 | |
50 percent of consumers valued the limitation of acquisition of products due to high prices, 27 % define that the purchasing power of people slows the acquisition and the few offers for almost 17 % also define the low acquisition of products.
Consumers' criteria for acquiring food products from Bahía Honda (Table 5) in the two years of evaluation are defined similarly to those of San José, but here in Bahia there is a big difference between 2013 and 2015, in the first year almost the price and the purchasing power presented more or less important results. Already in 2015 it seems that the purchasing power increased in the locality and what most influenced according to the perception of consumers was the high price of products that went from 20 to 27 % in importance. In summary, more than 46 percent of consumers valued the limitation on the acquisition of products due to high prices, almost 27 % define that the purchasing power of people slows the acquisition and the few offers, 18 % also define the low acquisition of products existing offers.
Table 5 Consumer criteria of Bahía Honda municipality according to race to acquire products by municipality in 2013 and 2015
| Year | Race | Age | Products prices | Purchasing power | Existing Offers | Distance point sale | Others | Total |
|---|---|---|---|---|---|---|---|---|
| 2013 | White | Total | 27 | 16 | 6 | 3 | 0 | 52 |
| Mullato | Total | 5 | 8 | 6 | 5 | 0 | 24 | |
| Black | Total | 5 | 6 | 2 | 1 | 0 | 14 | |
| Total 2013 | 37 | 30 | 14 | 9 | 0 | 90 | ||
| 2015 | White | Total | 26 | 12 | 10 | 1 | 0 | 49 |
| Mullato | Total | 13 | 1 | 4 | 1 | 0 | 19 | |
| Black | Total | 10 | 7 | 5 | 3 | 0 | 25 | |
| Total 2015 | 49 | 20 | 19 | 5 | 0 | 93 | ||
| General total | 86 | 50 | 33 | 14 | 0 | 183 | ||
It is clear that the most outstanding negative effect for the limitation of acquiring products are prices, and in both municipalities it is observed how the second main element is the purchasing power for low wages. In 2015 Honda Bay offers and purchasing power are compared, that municipality increased more than San José its municipal average salary 16, from 2013 to 2015 it increased 48 % its average salary (521 to 749 cup), while San José only increased 26 % (463 to 584), in both there was also an increase in agricultural production which is reflected in the market. In 2016 17, decrees 157C and 162 of the Ministry of Finance and Prices appeared, defining maximum prices for agricultural products to try to stop the price increase due to the population's purchasing power deficit.
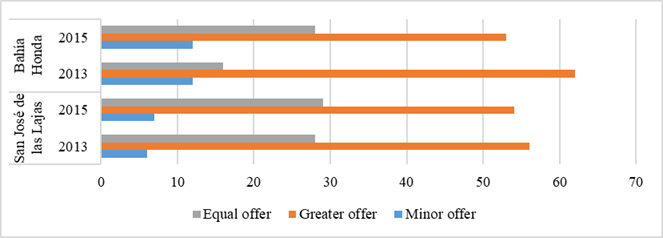
The perception of consumers of how they valued the offers observed in the types of markets is seen in Figure 4, it is shown that most mean that there are more offers than the previous year, as seen in 2013 and 2015, always women see with more market prospects, since her response is higher with respect to men. According to consumers there is a wide range of offers in the course of time, which can mean in a better well-being of people, that is a topic where there is much to work to achieve beautiful markets that are striking and well organized, missing in the localities to achieve very diverse and organized markets with high presence of quality products. A low minority between men and women during the three years of the year defined the offer as lower.
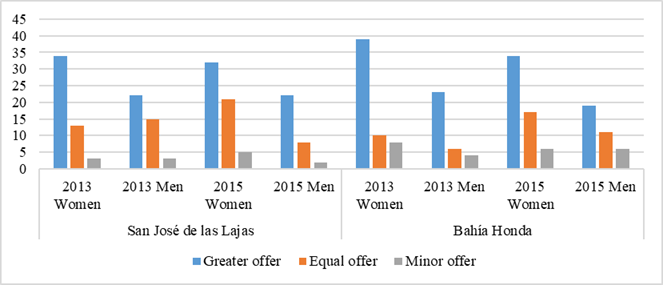
All the consumers of both municipalities and the different years evaluate that there is a greater offer every year than the previous year, this criterion being stronger in the women who visit the marking (Figure 5), this perception of the consumers is positive demonstrating that gradually it appears greater and more varied offers every two years, although it is still low.
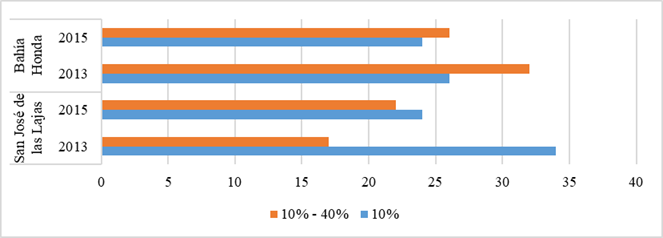
If the offer is valued as a percentage with respect to the previous year (Figure 6), it is denoted that in Bahia Honda, consumers in both years value a growth between 10 and 40 % as a priority, in the case of San José, people consider a low change of offers, that is, consumers are less satisfied with the offers.
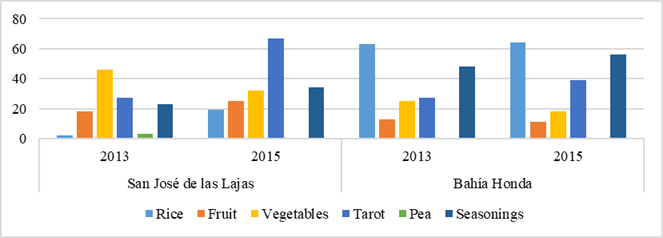
The diverse visits to the markets and the interviews with the consumers reflected that they visit the market for diverse interests, the consumers (Figure 7), acquire a large amount of food: cassava, sweet potato, tarot, yam as tubers and roots with a high carbohydrate content Likewise, they buy appreciable amounts of rice, a species that is always in Cuban food and black, red, white beans, beans, dry and tender corn and to a lesser extent pea and Chickpea as grains with satisfactory vegetable protein contents. They also acquire limited quantities of fresh and processed pork, as well as to a lesser extent, sheep, poultry and very little rabbit. They also buy dried seasonings, garlic, onion, chives and others. Vegetables mainly tomato, pumpkin, cucumber, carrot, eggplant, avocado, papaya and okra. From the citrus fruits, what appears most and is bought is lemon and, to a lesser extent, sour orange.
Food 18 is the process by which the incorporation of food into the body occurs. It is a voluntary and conscious process, being the choice of food completely intended by the person's taste or appetite.
Although since 2012 the Regulations and Indicators were published in the Sanitary Food Registry, etc. The Institute of Nutrition and Food Hygiene 19 does not systematically evaluate all foods that are directed to the food market and the mechanisms of the consumer protection standard that recently appeared in the official gazette are not greased by putting Resolution No. 54 of 2018 20 takes effect where consumers must demand the quality and hygiene standards of the markets.
Nutrition is the set of physiological processes by which the body transforms and uses the different chemicals that form food. It is an involuntary and unconscious process that depends on the organism itself and on bodily processes such as the digestion or absorption of nutrients, as well as the factors linked in the process, such as ambient temperature, etc. Nutrients are substances that are integral to food and necessary for human metabolism, among the defining characteristics of nutrients; have a known chemical composition, know the role that the nutrient plays in the body and that when a deficiency syndrome appears, it disappears when replenishing the deficiency nutrient intake 13.
The Food Composition Table (TCA) 21) used in Cuba, as well as the methods used to prepare it, is published, it includes the concept of “Generic Foods” that allows expressing the results of the surveys of food consumption or groups not only in terms of energy and nutrients, but also in terms of food consumption or basic food groups. It allowed the preparation of the most used TCA in Cuba, divided into 32 groups, in which 635 foods were included.
From the 32 particularly nutritious generic products, all of them, there is the potential to acquire them in the various existing markets in Cuba, with various prices that are sometimes very high.
At the time of visits in 2013 and 2015, there were only 21 products in the municipalities studied. This could be interpreted as the total absence of an important group of necessary products in the Cuban markets, however, it should be considered that the currency collection stores and other establishments sell many of these products, but with prices that are usually only within reach of A minority of the population. Some products such as oil, sugar and rice are offered in a limited amount to all family centers with state subsidies that, although they do not meet the needs of all families, relieve lower income families in a non-negligible percentage.
The food market in Cuba is heavily segmented 22. Most of the offer is made in spaces that enjoy consumer subsidies, but it is marginal for the “free supply and demand” markets and therefore reaches high prices. They state that forming a single market at the same prices would cause a price increase with respect to the subsidized market but less than the supply market and it would be necessary to see the groups of consumers that need support for their limited resources.
Until now, the integration of the components of agricultural production has not managed to reduce the country's spending on food purchases, it has not yet been possible to organize the rural area with sufficient autonomy and efficiency to obtain a production that limits food dependence.
We must move to a different form of regulation of the Cuban agribusiness sector 23, in particular the food, supplies, and equipment and services markets with this destination. They continue contributing that it is the design and implementation of equivalent rules for the actors that develop this sector, that all can display their productive potential. They give great importance to the financing of the sector. Other markets have to be developed, for example containers, packaging and storage and conservation services, transportation. In general, strengthen facilities for wholesale and retail markets. A sector-specific bank and legal and quick and efficient conflict management solutions that facilitate the proper functioning of the agri-food chain are necessary.
The changes in the political map, the economic and food crisis associated with them and the resurgence of the US government blockade 24 largely explain the strengthening of the small producer’s category and the emergence of the usufruct to boost exploitation of more than one million hectares without use, which will allow the increase of diversity in local markets.
CONCLUSIONS
It can be concluded that the supply of food products accessible to the population of the municipalities of San José and Bahía Honda is still poor in quantity, quality and variety. Although there is a small increase in years, there is still insufficient production in general in them to solve this situation. This fact should be reinforced in two ways: on the one hand prioritizing the amount of food that meets the demands and on the other hand, increasing production accompanied by variety and quality by installing irrigation infrastructure and putting the land that still produces they are idle or weakly used; as well as through the reorganization and stabilization of the production chain of products locally. All of this can be a factor to be solved, since there is a capacity to respond to the risks of food vulnerability in both municipalities.
BIBLIOGRAFÍA
1. Gardner B. A review and analysis of the use of 'habit' in understanding, predicting and influencing health-related behaviour. Health Psychology Review. 2015;9(3):277-95. doi:10.1080/17437199.2013.876238 [ Links ]
2. Villares JM, Segovia MG. Alimentación del niño preescolar, escolar y del adolescente. Pediatría Integral. 2015;268. [ Links ]
3. Wiedemann AU, Gardner B, Knoll N, Burkert S. Intrinsic rewards, fruit and vegetable consumption, and habit strength: A three-wave study testing the associative-cybernetic model. Applied Psychology: Health and Well-Being. 2014;6(1):119-34. [ Links ]
4. FAO. El estado mundial de la agricultura y la alimentación 2017: aprovechar los sistemas alimentarios para lograr una transformación rural. Roma: Food and Agriculture organization of the United Nations. 2017. [ Links ]
5. FAO. El estado de la seguridad alimentaria y la nutrición en el mundo 2017. fomento de la resiliencia en aras de la paz y la seguridad alimentaria. Roma: Food and Agriculture organization of the United Nations. 2017. [ Links ]
6. Aristizábal-Vélez PA, García-Chamorro DA, Vélez-Alvarez C. Determinantes sociales de la salud y su asociación con el sobrepeso y obesidad en adolescentes. Orinoquia. 2014;18(2):66-77. [ Links ]
7. El Niño Oscilación del Sur (ENOS). Región de Latinoamérica y el Caribe. Foreign Disaster Assistance (USAID/OFDA), regional office for Latin American and the Caribbean. Reporte No. 3. 2016 p. 16. [ Links ]
8. BBC Mundo. El poderoso huracán Matthew deja un rastro de devastación en el este de Cuba y tiene a Florida en alerta - BBC News Mundo [Internet]. 2016 [cited 16/12/2019]. Available from: https://www.bbc.com/mundo/noticias-america-latina-375484078. [ Links ]
9. Wikipedia. Huracán Irma. [Internet]. Wikipedia. 2019 [cited 16/12/2019]. Available from: https://es.wikipedia.org/w/index.php?title=Hurac%C3%A1n_Irma&oldid=1214572439. [ Links ]
10. Simon G-A. Concepto y gobernanza internacional de la seguridad alimentaria: de dónde venimos y hacia dónde vamos. Revista española de estudios agrosociales y pesqueros. 2009;224:19-45. [ Links ]
11. Godfray HCJ. The debate over sustainable intensification. Food Security. 2015;7(2):199-208. [ Links ]
12. Ortiz R, Miranda S, Hernández R, Rivera J, Fonseca D. Prácticas exitosas en la innovación agropecuaria local. Impacto en el desarrollo local. Revista Nueva Empresa. 2013;9(3):77-81. [ Links ]
13. Ortiz Pérez R. Construir una cultura de la participación. Sistema de Innovación Agropecuaria Local. Mayabeque, Cuba: Ediciones INCA; 2017. 82 p. [ Links ]
14. Diéguez AR, Bordón AM, Reyes RR, Ramos LG. Plataformas Multiactorales de Gestión: Aportes al desarrollo local integral del municipio Jesús Menéndez. Didasc@ lia: Didáctica y Educación. 2016;7(5):213-24. [ Links ]
15. Porrata-Maury C. Consumo y preferencias alimentarias de la población cubana con 15 y más años de edad. Rev Cubana Aliment Nutr. 2009;19(1):87-105. [ Links ]
16. ONE. Anuario Estadístico de Cuba. [Internet]. ONE. 2006 [cited 16/12/2019]. Available from: http://www.one.cu/16. [ Links ]
17. Gaceta Oficial de Cuba. Resoluciones 157C y 162 del 2016 del Ministerio de Finanzas y Precios sobre precios máximos permisibles en los mercados. [Internet]. Gaceta Oficial de Cuba. 2016. [cited 07/01/2019]. Available from: https://www.gacetaoficial.gob.cu/17. [ Links ]
18. Jiménez MDR. Alimentos y Nutrientes. In: Alimentos ecológicos, calidad y salud. Sociedad Española de Agricultura Ecológica (SEAE). Depósito Legal: SE-553-07. Junta de Andalucía, Consejería de Agricultura y Pesca; 2008. p. 7. [ Links ]
19. Suárez Pita MT, Martínez L, Victoria M. Registro Sanitario, logros, debilidades y proyecciones al cierre del 2013. Revista Cubana de Higiene y Epidemiología. 2014;52(1):143-8. [ Links ]
20. MINCIN. Resolución 54/2018 de Protección al Consumidor [Internet]. 2019 [cited 16/12/2019]. Available from: http://www.mincin.gob.cu/tag/resolucion-54-del-2018/20. [ Links ]
21. Pita-Rodríguez G. Tabla de composición de alimentos utilizados en Cuba. RCAN. 2013;23(2):247-56. [ Links ]
22. Costa AG, Sousa RG, Sorzano AH. Soberanía y seguridad alimentaria en Cuba: políticas públicas necesarias para reducir la dependencia alimentaria. Agrisost. 2013;19(3):1-14. [ Links ]
23. García Álvarez A, González Águila R. Mercados agropecuarios en Cuba: evolución, análisis y mejora. Economía y Desarrollo. 2016;156(1):200-18. [ Links ]
24. Jover JN, Marrero IA, Quiñonez AA, Alfonso GF. Educación superior, innovación y desarrollo local: experiencias en Cuba. In: Congreso Universidad. 2016. p. 228-48. [ Links ]
Received: January 29, 2019; Accepted: December 25, 2019

