


Mi SciELO
 Servicios personalizados
Servicios Personalizados
Articulo
 Español (pdf)
 Articulo en XML
 Referencias del artículo
 Enviar articulo por email
Indicadores
-
 Citado por SciELO
Links relacionados
-
 Similares en
SciELO
Similares en
SciELO
Compartir

 Permalink
Ingeniería Industrial
versión On-line ISSN 1815-5936
Ing. Ind. vol.36 no.3 La Habana sep.-dic. 2015
ARTÍCULO ORIGINAL
Micro-world of The airplane of the muda: A systemic approach to Lean
Micromundo de El avión de la muda: una aproximación sistémica al Lean
Jorge Pérez-Rave, Sebastián Cortés-Zapata, Daniel Alonso-Restrepo
Universidad de Antioquia, Departamento de Ingeniería Industrial, Medellín, Colombia
ABSTRACT
The airplane of the muda is a game on a production line, used for practical training on Lean Manufacturing (LM). The aim of this paper is to provide a computer model for the game that approaches it from a systems perspective, to broaden its scope beyond the traditional tactical and operational end, to understanding and strategic decision making. The integration of all this with a challenging case (i.e. maximising cash flow) on an interface in which users can make line balancing decisions, 5S and 5 whys, makes for a computer micro-world on system dynamics. Users can test their hypotheses, receive feedback, and analyse behaviour, not only in the short term, but over a period of 25 years, while enabling instruction on simple LM tools, as well as underlying concepts and complex behaviours of business improvement. Moreover, the results obtained have pointed out interactions between the production, finance, customer, and improvement subsystems, which may lead to improved understanding of business transformation processes.
Keywords: Lean manufacturing, 5S, line balancing, micro-world, systems thinking.
RESUMEN
"El avión de la muda" es una lúdica sobre una línea de producción, utilizada para la enseñanza práctica de la Manufactura esbelta (ME). El objetivo de este artículo es modelarla computacionalmente y abordarla desde el pensamiento sistémico, para darle mayor alcance hacia la comprensión y la toma de decisiones estratégicas, y no solo tácticas y operativas como ocurre actualmente. Al integrar todo esto con un caso retador para el usuario (maximizar el flujo de caja) y una interfaz en la que puede tomar decisiones de balanceo de línea, 5S y 5 porqués, se llega a un micromundo computacional bajo dinámica de sistemas. El usuario puede poner a prueba sus hipótesis, recibir retroalimentación, y analizar el comportamiento no solo a corto plazo, sino también en un periodo de 25 años. Se posibilita la enseñanza de herramientas simples de la ME, así como de conceptos y comportamientos complejos subyacentes en la mejora empresarial. Además, considerando los resultados obtenidos, se identificaron interacciones entre el subsistema de producción y los subsistemas finanzas, cliente y mejoramiento, que posiblemente ayudan a una mejor comprensión de los procesos de transformación empresarial.
Palabras clave: Manufactura esbelta, 5S, balanceo de línea, micromundo, pensamiento sistémico.
INTRODUCTION
One of the best-known and most effective production philosophies today is the Toyota Production System (TPS), known as Lean Manufacturing in the Western world [1-2]. This system demands the reconfiguration of a variety of elements so that it produces what is required, at the right time, under the right conditions, assuming teamwork, the freeing of human potential, a decrease in manufacturing waste, and lifelong learning. "The airplane of the muda" [3] is a game that aims to facilitate initiation into elements of this work philosophy. From a constructivist approach, the game allows learners to live the reality of the seven types of waste of manufacturing, while identifying their origins, intervening with small changes and promoting continuous improvement. To that end, the game simulates a production process whose goal is to produce five paper airplanes in 2.5 minutes, complying with two quality requirements for each plane: flying at first attempt and having wings visually aligned. The process, made up of 12 operations (not all valuable), happens in five single-staff work stations. The game generally takes three production runs; in the initial stage, participants experience excess waste; in the second stage, they work to reduce waste before running production again, to improve initial performance; often a third stage, where participants’ implement ideas for improvement, is needed to reach the target. Improvements consist of type 5S and 5-whys actions. It is viable to deploy improvement tools, such as line balancing and visual management, given the task’s simplicity, flexibility and closeness to the reality of production.
The scope of this teaching-learning tool [3-4] is limited mainly to short-term operational and tactical improvement decisions, despite successful reviews. In strategic roles, besides the short term, it is necessary to focus on improvement actions from a systemic view, and to study underlying structures that yield understanding of elements of the company and their interrelationships. After all, a short-term solution may not behave the same over time. On the one hand, it is not feasible for the participant to reflect systemically, either in the game environment or in reality, given the failure to provide participants with an actual company, to experiment, estimate, make mistakes, impact results, and receive feedback, to be able to understand why things go as they do. Despite these limitations, technological advances let them go through the experience using computer simulated micro-worlds [5-6]. On the other hand, it is feasible to model the operation of "The airplane of the muda" game, and incorporate system dynamics that implement systems thinking. This pragmatic necessity, also supports the conclusions of [7] on the state of the art and challenges to simulation games for engineering education, in which a call is made to enable a comprehensive understanding of the issues by adopting holistic approaches. In such sense, this paper presents a computational micro-world "The airplane of the muda" that facilitates systemic understanding of business improvement based on the theory of Lean Manufacturing. This micro-world lets users experience the process of decision making interactively (5S, line balancing, root cause analysis), study the complexity of corporate behaviour in light of the use of improvement tools, consider the consequences of planned actions in the mid to long-term (5 to 25 years), reflect on, and perhaps shift their mental models.
METHODS
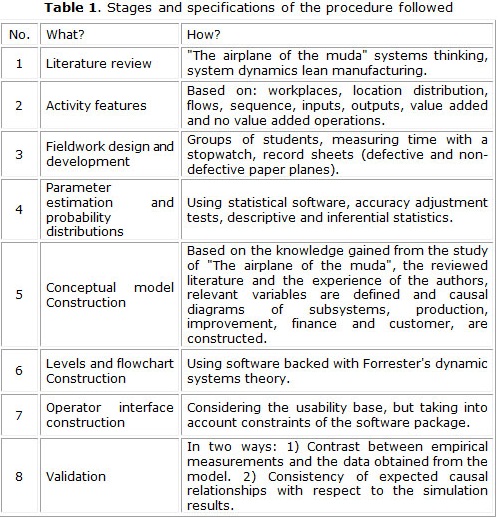
Table 1 presents the procedure subsequently detailed in the fieldwork.
Fieldwork was conducted in a single room, which was organised as shown in figure 1.
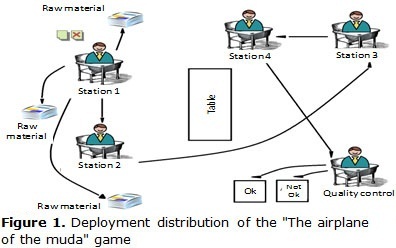
To ensure reproducibility of the test, templates were created to standardise measurements of distances between work stations and raw material supply points and warehouses for compliant (OK) and non-compliant (Not OK) goods. The game, in its initial stage (with much waste), was applied at University of Antioquia, to six groups of third and fourth semester industrial engineering students, who had no knowledge of the development of this game or of LM. They volunteered to participate. Each group had a single production run (initial stage: with much waste). In each case, production stopped at 30 paper planes, to collect the greatest number of observations. The first three and the last three planes produced were excluded to stabilise the line during observation. Based on [8], after collecting the data, endpoints were removed and distribution was determined at the times that best fit the operations using the Kolmogorov-Smirnov test, selecting the distribution that in contrast displayed the greater value of p. In no case were data sets with fewer than 30 items accepted. Table 2 shows the summary of the features of interest of the game, with ANV indicating activities that do not add value and AV those which do.
RESULTS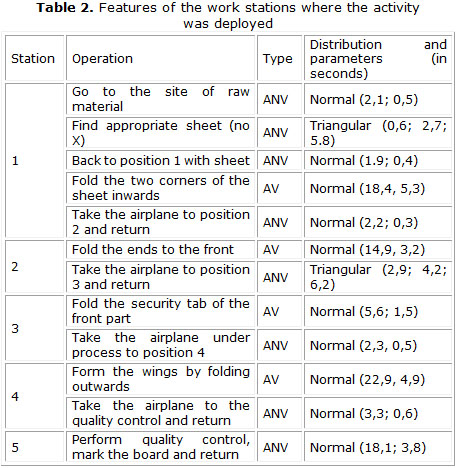
Conceptual model:
The conceptual model began by considering possible subsystems in the production of the planes and also improvement actions being implemented. Thus, after analysis, four subsystems are defined: finance, production, improvement and customer. They are described below:
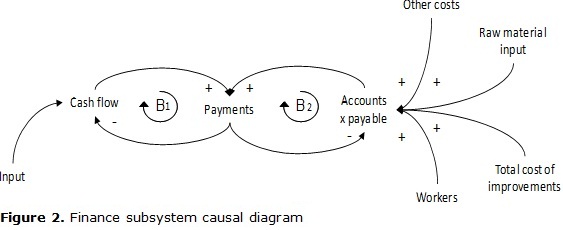
Finance: this subsystem figure 2 consists of two balance cycles (B). They share the payment variable, which drains cash flow and accounts payable. Thus, the more revenues are higher than costs, the more cash flow increases.
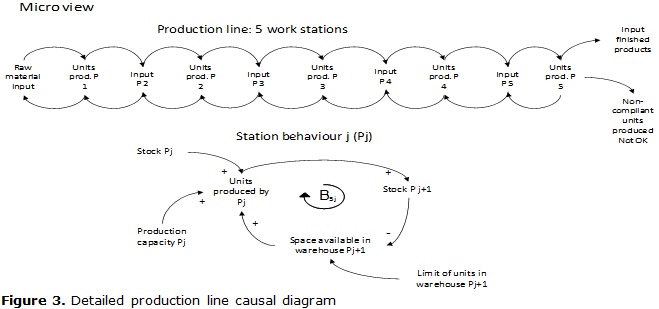
Production: figure 3 shows the detail of the production line. "The airplane of the muda" consists of five work stations (Pj) connected in a series. What happens at the last station depends on what happens at its predecessor, and so on up to P1, which feeds on the raw material in stock. One part of what is produced at workstation 5 (P5: quality control), goes to the finished goods warehouse; the other part is discarded as non-compliant.
Details about what happens at each workstation are found in figure 3, where the phenomenon is extended to a certain Pj station. Thus, the units it produces depend on its production capacity, the production that station receives from the previous work station, which is equivalent to the stock of work in process at station j (raw material in the case of station 1) and the space available in the store of the next work station (Pj + 1). Therefore, production of a certain workstation j, depends on the store at the next station, since, even in the case of a limit oversight by those in charge of production or the operators themselves, unlimited amounts of product in process cannot be stored, although empirical practice in companies without inventory control, stop production as, "the next station is down," or simply, "storage is out". This behaviour starts at the raw material store and goes from station to station until it reaches the finished goods warehouse, whose storage capacity is limited. This model disregards investment on new warehouses.
Having understood the inner workings of the production line in a series, a big-picture inference is called for, as outlined in figure 4. Note the six balance cycles that make up this subsystem (B3-8). See also that, at the end, there will be more (compliant (OK) / noncompliant (Not OK)) units, to the extent that production capacity is increased at the workstation constraining the system, i.e. to a longer cycle time. The cycles B3-6 are interpreted in terms of the detailed line, while cycle B7 requires another variable, i.e. the units the line delivers to customers, which empties the store of finished goods (compliant units). As these are delivered, defective units are released (B8).

Another item to note is defp (defect generation probability), corresponding to a process parameter, which determines how much product is compliant (OK) and noncompliant (Not OK). This parameter has a normal behaviour (mean 0.3298; std. 0.0647) and in another subsystem it can be seen changing during company operation. A key feature to note in LM is the relationship between Tack Time (How often a unit should be delivered to the customer) and cycle time. The first is influenced by the units required, which takes into account requested and defective units, and defect generation probability. If more units are required Tack Time is shorter, thus alignment of the cycle and requirement times is more challenging. Finally, line raw material input is limited, which depends on the company’s debt capacity, i.e. as a time may come when it owes so much money that it cannot continue to obtain raw materials from the supplier or is forced to take up other means to pay for them.
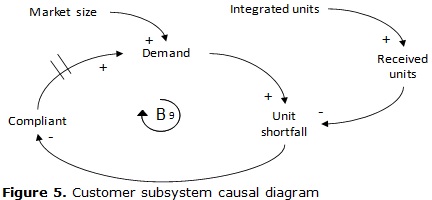
Customer: This subsystem figure 5 is represented by a balance cycle (B9), which illustrates that the more units the customer demands, the more defective units are made, which negatively affects performance, and ultimately, results in customer dissatisfaction. Thus demand is reduced and the company loses market share. On the other hand, as the company produces and delivers on time, defective units are reduced, compliance increases and, eventually, demand increases, which in turn overcomes the company’s capacity. On the other hand, a specific market demand has its own limit, and in this study, decisions on expanding to new markets are not considered.
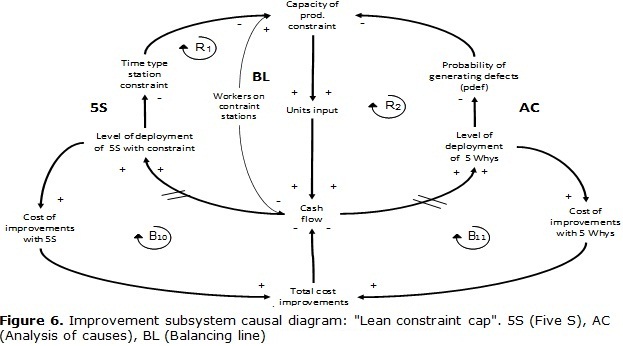
Improvement: Consider three types of improvements; on the one hand, there is the possibility of modifying the number of staff at the five work stations that make up the production line, while looking for options to implement 5S in each station independently, and deploying cause analysis, based on the 5-whys tool. To understand this system, it was necessary to use elements from the other subsystems; the result is presented in figure 6, and was given the name Lean constraint cap to honour the way it was derived.
This cap is composed of four cycles: Two reinforcements or snowballs (R1-2) and two others for balance (B10-11). In the "Lean constraint cap" it can be seen that, in the short term, using strategies (training, consultants, etc.) to increase the level of 5S or deploy the 5-whys generates costs and therefore decreases the company’s cash flow; however, depending on how effective, these improvements may either recover a surplus on investment, or lose money for the company over time.
If such improvement actions do not result in increased production capacity, fewer units are delivered to customers, and the revenues that fuel cash flow are negatively impacted. In other words, for S5 actions to generate money, they must shrink time during which no value is added (time wasted looking for tools, disorder, movement, transport, etc.). Operations that put constraints on production are to be impacted positively; as by constraint theory, these are known to increase the capacity of the entire line. With regard to cause analysis, the probability of defect generation is impacted directly, regardless of its origin and thus more compliant units may be produced, as illustrated in the production system (see figure 4). As with the 5S, if hiring / dismissal or redeployment of staff is not done to enhance a station’s constraining, investment in improvements may not result in cash flow increase, especially as staff is hired but system capacity does not increase. All this, of course, is taken together with the other subsystems, which converge in balance cycles further constraining reinforcing cycles. Note that we are mixing two important perspectives, looking for and intervening constraining actions, then applying Lean. Additionally, overall line could also benefit from cause analysis without the need to take action directly on constraints, because in the end, it is possible that other stations are enhanced, falling into linearity and interdependence with other workstations in the production process. In this case, the last workstation (quality control) would discard fewer units, as the proportion of compliant paper planes increases.
System Overview: Generally speaking, while consolidating the four subsystems is show in figure 7, it can be seen that customers set the pace of units to be produced (demand, shortfall); the production line, in turn, executes its mission to respond to the customer, which, depending on compliance over time, demands more or fewer units.
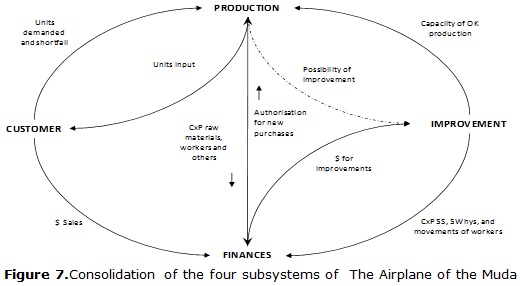
In turn, customers nourish the finances by paying off purchases finalised with the company, which increases cash flow and reduces the debts of the company (accounts x payable). Depending on debt, finance can buy more or less raw material and pay the remaining costs of production. In turn, production provides information to identify new alternatives for improving progress. On the other hand, depending on cash flow, improvements may affect production (5S, 5-whys, line balancing), which could result in greater compliant unit manufacturing capacity. These actions also generate improvement costs, which compromises finances. The connection between production and improvements is a dotted line because it consists of decision-making information, which is not always noted by the decision maker, or even when noticed, improvements may still be overlooked; the fact that the production subsystem operates does not grant it a response from the improvement subsystem.
Diagram of flows and levels
As a means of evidence, and extension of this article, only the production subsystem will be discussed figure 8, along with the resulting conceptual model.
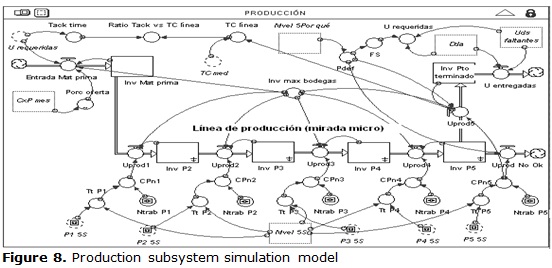
In the middle of Figure 8 the five work stations comprising the production line are simulated, then each station storage process is noted, represented by a tank (Inv Pi). At the top, the line can be viewed from a global perspective, detailing what goes in (raw material) and what comes out (finished product) and their interactions with other elements of the subsystems (demand, shortfalls, etc.). For an explanation of this subsystem, refer to Figures 3-4.
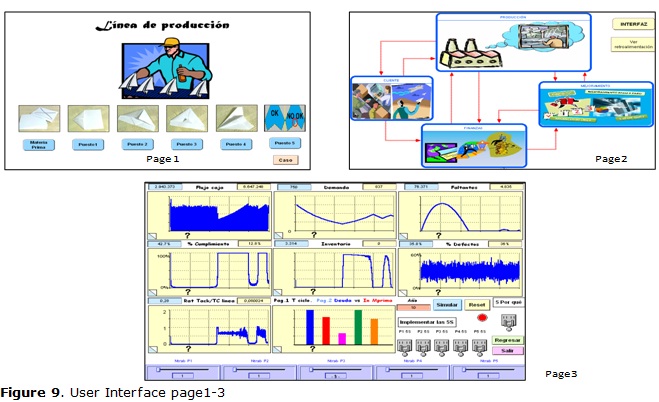
User interface See the interface in Figure 9. Micro-world starts with a welcome screen, where users see an overview of the challenge to be resolved and details of what makes up each of the five work stations of "The airplane of the muda," supported by photographs, involved in the construction of a production unit in the game.
The second page refers to the four subsystems that comprise the simulation model, with images illustrating each task. Also, arrows show the relationships between the subsystems, to elicit interest in users so that they try to identify and further understand such relationships. Page 3 of the micro-world features the operating module, which provides first-hand information for users to make decisions that improve the performance of the company. Output variables for decision-making are: cash flow, demand, unit shortfall, compliance percentage, finished goods stock, defect rates, tack time to line cycle time ratio, workstation cycle times, debt, and amount of raw material feeding the line. All variables, except workstation cycle times, feature trend graphs. Cycle times are incorporated in a bar graph to represent the balancing wall. In addition, each graph has two information boxes at the top; the one on the left side of graphs shows the average value of the variable illustrated, while the box on the right, shows the instantaneous value. Users can decide to improve the performance of the company as follows: by changing the workforce (from 1 to 4 workers per station) seeking a balance, implementing 5S (in more than one workstation), and deploying 5-whys. The latter activate switches (See right illustration, Figure 9).
Validation
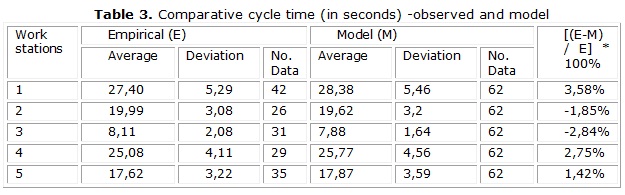
Production Line: In order to corroborate the validity of the game simulation, a comparison of two cycle times at each workstation, empirical (game deployment) and from the model table 3 was drawn. Another variable in the validation was the entire line cycle time (in seconds). The results were: Cycle time observed during fieldwork (27.49 sec) and provided by the simulator (26.49 sec).
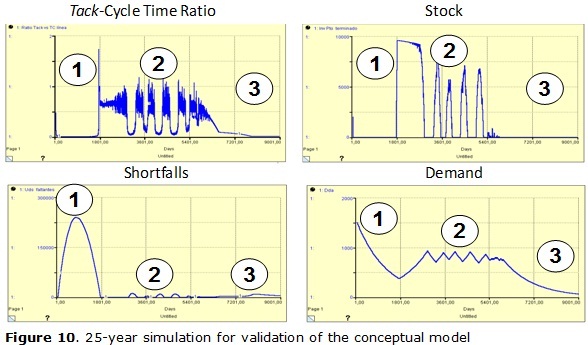
Conceptual model: to validate the coherence of the conceptual model, we started from variables: tack-cycle time ratio, finished goods stock, unit shortfall, and demand. It was simulated for 25 years, in order to have sufficient time to observe emergent patterns. Figure 10 shows the results. This graph has circles with numbers inside to illustrate different behaviours used as evidence of validation. The first graph (left) shows tack-cycle time ratios on a scale of 0 to 2. It shows that in the first five years (circled 1) the ratio is almost zero; this, from a theoretical viewpoint, means that the production line is much slower than customers demand, resulting in a depleted stock and shortfalls. These last two assertions substantiated by the illustrations of stock (row 1, column 1) and shortfalls (row 2, column 1) in the space indicated by ‘circled 1’. In the case of the shortfalls, even though they are still present, they are starting to decrease, but this is not explained from the other variables shown. This is where the demand variable is included. Generating shortfalls, as shown in the customer subsystem figure 5, is known to affect performance negatively, and affects demand over time. Thus, in Figure 10 (row 2, column 2), demand begins to fall in the first five years. This explains why the shortfalls are reduced (each time less demand).There is a point where so few units are demanded that the line, at current capacity, is already able to meet demand. Next, periodic compliance affects demand, which then stabilises; In other words, The company gets the market it can actually supply. From that moment on, a new stage begins (circled 2), in which the ratio, at times, takes values close to or above 1, which results in surplus of stock and few shortfalls. For this scenario (2), the graphs of figure 10 are balanced. The first two scenarios (circled 1, 2) can be represented under the causal diagram of figure 11.
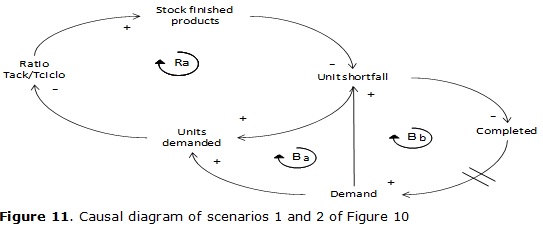
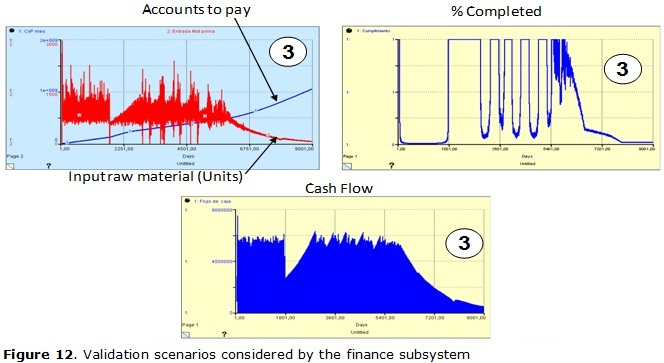
The reinforcing cycle (snowball) generates variable overflow, while the other two cycles, which incorporate time delays from compliance above demand, make other variables converge to balance. The reader can follow the causal relationships outlined in production subsystems (Figures 3-4) and customer (Figure 5) and arrive at what the diagram of Figure 11 expresses. Returning to the simulation, none of the relations in the third stage (circled 3), which starts around the 15th year, explains the behaviour disrupting the balance reached in stage 2. However, Figure 10 only considers two subsystems, excluding improvement and finance. The first should not influence this baseline scenario, because no improvement is implemented. As for the second, it is enough to look at the accounts payable (debt) variable to notice what took effect in the third stage of the study. There is a point where debts are so high that suppliers cannot provide the amount of raw materials required by the company, nor does the company have the capacity to borrow to buy them, i.e. the company has production capacity, but does not have enough raw material, it then begins to produce less than required, and this raises compliance concerns, evident in Figure 12 ("% Completed"). This drains all the stock Figure 11, ratio drops to almost zero, but there is no shortfall because demand is almost nil. As a result, cash flow declines Figure 12. Again, these graphs corroborate the resulting behaviour by integrating the three subsystems: production, finance and customer.
Regarding the improvement system, all evidence of the use of improvement tools was satisfactory: when the work force increases at a given station or when 5S is applied, cycle time decreases; and when the 5-whys are applied the likelihood of model defects is reduced as expected. Both situations feature time delays, as in reality. However, when only one tool was applied to each scenario, the results were unfavourable. The best results were found with tool combinations, after finding leverage points through constraints, initially, as suggested by the "Lean constraint cap". Further study into this topic is not the scope of this article; at a later date, there will an article devoted solely to the analysis of these scenarios.
DISCUSSION
The Toyota Production System, known to Westerners as Lean manufacturing, allows for levels of quality, timeliness, safety and productivity, to be increased, in organizations [9 -10], using various improvement tools teamwork guidelines, lifelong learning, empowerment, creation of stakeholder value, troubleshooting, and the elimination of what does not add value to customers (muda), among others. Such studies [11] draw attention to the deployment of a philosophy based on improvement, noting that its elements must not be taken as "individual pills" but rather applied systematically and with patience to see results over time, where each tool depends on the others and, in turn, on soft aspects intrinsic to individuals, managers and the team. The absence of such an approach can be seen as one of the major causes of failure in attempting to deploy LM in some Western firms. Hence, we find a pragmatic necessity for the development of a micro-world to approximate a systemic understanding of the foundations of such a philosophy. Its use is suggested when initiating the topic, to elicit reflection and the shift managers’, students’, professionals’ and even operators’ mind-sets, before the various tools it comprises are deployed on "the floor". Indeed, analysis of the interactions of the production line with other subsystems enables identification of patterns of behaviour key to the implementation of improvements, which in this study is referred to as a "Lean constraint cap". This structure reflects the need to implement Lean type improvements, prior to searching for leverage points to improve the overall system, in line with assumptions of the "fifth discipline" [12].
In other words, the micro-world enhances the understanding of the application of simple Lean tools (5S, balancing, 5-whys), which are embedded in complex systemic concepts and behaviours, related to the topic, sharing structural patterns that show the need for strategic decisions when conducting business improvements. This is consistent with the future challenges proposed by [7], among which the need for a comprehensive vision of the issues addressed in simulation games in engineering stands out as a way to facilitate knowledge transfer to companies. Below is a discussion of LM tools, their effects on the performance of the simulated company can be explored through the micro-world: 5S is a process of continuous improvement based on common sense, which, with the help of training, empowerment and self-realisation by the worker, seeks to set the discipline necessary to sustain a clean, orderly, productive and safe working environment [4]. The steps for its implementation are: Seiri (Sort), Seiton (Order), Seiso (Clean) Seiketsu (Standardise) and Shitsuke (Discipline to maintain what has been implemented). In the micro-world developed, the incidence of this tool in the practice of the simulated company is achieved through the reduction of no value added operations, which are easy to overcome through small changes, applying the five steps outlined. This applies to the entire production line, impacting eight of the twelve operations that make up "The airplane of the muda" (go to the raw material site, look for appropriate sheet (no "X"), return to position 1 with sheet, among others). The reason for enabling, simulating and exploring the effects of this tool is supported by studies such as [13], in small and medium enterprises, reporting a high presence of operations that do not add value to the customer (transport, movements, waiting, among others), generated by cluttered environments, lack of cleanliness, elements that are not required, etc., as presented in "The airplane of the muda".
Turning to line balancing, this tool seeks to synchronise production process and customer required speeds [9], so that goods shortfalls or surpluses do not happen. For this, we resort to changes in the configuration of tasks, or in the numbers of workers assigned to each workstation, to regulate process production capacity. The developed micro-world considers balancing through changes in the allocation of workers. This type of strategy is based on a graph known as "balancing wall" which uses bars to represent each workstation cycle time. It also considers the contrast between Tack andcycle times against the latter. In the case of "The airplane of the muda", the cycle time can be likened to how often the production line launches an airplane, while the Tack time represents how often an airplane should be handed to a customer. Aligning these two elements increase the effectiveness of the line, thus allowing the reduction of two major muda principles of manufacturing: overproduction and stock, which in turn create other problems for organisations. The possibility of exploring line imbalances facilitates reflection among leadership, future graduate and tactical personnel, among others, who sometimes do not perceive stock and overproduction as "manufacturing waste". Whereas showing their effects in a simulated environment may help reduce complacency, peace-of-mind and satisfaction, as a production plant is full of completed products, or products in process, all of which results from assumptions like, "produce as much as possible; it will get sold."The analysis of causes is an improvement process that seeks to get to the source of problems and intervene them, while being completely backed by data and facts. A range of methods and tools are usually applied in this process, including the 5-whys, which consists of moving from visible to latent causes by asking why? In the case of "The airplane of the muda", this tool is used to get to the root cause of the most recurrent defect: misaligned wings. A simple animation is added to help here, in which the user moves from the reasons for defects through the last work station (quality control), up to the first. This makes understanding dependency relationships that occur in a production line easier, while stressing that cause and effect are not necessarily in the same place, according to teachings of the fifth discipline [12]. The use of such tools as the micro-world, which simulates reality through computer environments, for educational purposes and constructivist approaches, reflection, analysis, experimentation, feedback, general active teaching-learning of one or more subjects in particular [14] become feasible. Discovery learning in an "artificial" environment encourages global understanding of complex system operation concepts, and facilitates organisational learning, besides it has been attracting increasing interest in the academic community [15-16]. In the interests area, the micro-world was integrated with system dynamics to consider, besides the specific knowledge provided by "The airplane of the muda", learning options from systems thinking; for example, to analyse the production system response to improvements implemented or discontinued; also, to study the relationships between these actions and other company subsystems, to deduce possible patterns of behaviour bring forth leverage points.
One of the main distinctions in this micro-world is that it considers not only a global vision among subsystems but also part of their short-term performances, visible on a production line. It then shows how the effects of producing a given unit or placing a person at a certain workstation are immediately visible in production, and can eventually impact other subsystems, until they affect the entire production line, not necessarily favourably; i.e. it doesn't just consider the relationships that underlie the macro or general subsystems of a company, but also allows for analysis of what happens within production line subsystems.
CONCLUSIONS
1. In the case of "The airplane of the muda", a Lean Manufacturing teaching-learning tool, the effectiveness of which has been proved in other studies, we were able to provide the academic community with its statistical features, indicating probability distributions and their parameters, among others, which can modelled from computer simulations by other researchers, to promote cotrasting results that point out new findings (patterns of behaviour, effects, etc.).
2. A computer model has been achieved by integrating elements of dynamic systems, a simulation game model and a challenging case for the user (maximizing cash flow), besides an interface in which he/she can make decisions on line balancing, 5S, and the 5-whys. The user can test his/her hypotheses, receive feedback, and analyse behaviour, not only in the short term, but also considering feedback, over a period of up to 25 years. Simple LM tools can be taught, along with underlying complex business improvement concepts and behaviours.
3. The study of the interactions between the production and finance subsystems, the customer and improvement subsystems, approached in the context of the production line, allows for a new system archetype to be inferred. This was called "Lean constraint cap", to honour the form it takes and because it relies on the foundations of Lean (reduction of operations with no value added) and the theory of constraints (identification of system constraints). It appears that actions aimed to reduce transport, wait time, moving, etc., it is afford promising perspectives: identification of a line’s overall constraint, and application of Lean tools. On the other hand, when considering the analysis of defective product causes, for example, through the 5 whys, the overall system could be promoted without the necessity of directly checking the constraint, given dependency relationships between work stations, as characteristic of processes that resemble the line of "The airplane of the muda".
4. For future studies, this tool serves as a lab to assess the effects of systems thinking on the definition and development of business improvement strategies. The micro-world may also be used to analyse elements from other theories, such as constraints and data use from teaching-learning process simulations that deal with statistical analysis, related to business engineering.
REFERENCES
1. Womack J, Jones D, Ross DT. The machine that changed the world: the story of Lean Production. New York: Rawson McMillan; 1990. ISBN 0892563508.
2. Manotas D, Rivera L. Lean manufacturing measurement: the relationships between lean activities and lean metrics. Management Studies. 2007;23(105):69-84. ISSN 0123-5923 .
3. Pérez J. El avión de la muda: herramienta de apoyo a la enseñanza-aprendizaje práctico de la manufactura esbelta. Revista Facultad de Ingeniería Universidad de Antioquia. 2011 ;(58):173-82. ISSN 0120-6230.
4. Pérez J. Mejoramiento paso a paso en la PYME manufacturera ¿Cómo iniciar al personal operativo? Medellin (Colombia): Editorial Universidad de Antioquia; 2012. ISBN 978-958-714-512-0.
5. Sacristán A. La importancia de los micromundos computacionales como entornos didácticos estructurados para fomentar e investigar el aprendizaje matemático. In: 3rd International Congress on the Teaching of Computer Aided Mathematics (CIEMAC) at the Technological Institute of Costa Rica in Cartago; Costa Rica: Technological Institute of Costa Rica; 2003.
6. Badilla E, Chacón A. Construccionismo: objetos para pensar, entidades públicas y micromundos. Actualidades Investigativas en Educación. 2004;4(1):1-2. ISSN 1409-4703.
7. Deshpande A, Huang S. Simulation games in engineering education: A state-of-the-art review. Computer Applications in Engineering Education. 2011;19(3):399-410. ISSN 1099-0542.
8. Parra C, Pérez J, Torres D. Modelación y simulación computacional de un proceso productivo de una pequeña empresa usando dinámica de sistemas. Revista Científica Ingeniería y Desarrollo. 2006; (20):151-71. ISSN 0122-3461.
9. Tejeda S. Mejoras de Lean Manufacturing en los sistemas Productivos. Ciencia y Sociedad. 2011;36(2):276-310. ISSN 0378-7680.
10. Arrieta J, Botero V, Romano MB. Benchmarking sobre Manufactura Esbelta (Lean Manufacturing) en el sector de la confección en la ciudad de Medellín, Colombia. Journal of Economics, Finance and Administrative Science. 2010;15(28):141-70. ISSN 2077-1886.
11. Pérez J, Patino C, Úsuga O. Uso de herramientas de mejoramiento y su incidencia en costos, fallas y factores de éxito de grandes y medianas empresas industriales del Valle de Aburrá. Gest Prod. 2010;17(3):589-602. ISSN 0104-530X.
12. Senge P. La quinta disciplina: el arte y la práctica de la organización abierta al aprendizaje. Buenos Aires: Ediciones Granica; 2005. ISBN 950-641-430-0.
13. Pérez J, La Rotta D, Sanchez K, et al. Identificación y caracterización de mudas de transporte, procesos, movimientos y tiempos de espera en nueve pymes manufactureras incorporando la perspectiva del nivel operativo. Ingeniare Chilean Journal of Engineering. 2011;19(3):396-408. ISSN 0718-3291.
14. Alava C, Aguirre A, Cabrera H, et al. Creación de micromundos aplicando la teoría de juegos y el diseño orientado a objetos. Revista de investigaciones UNAD. 2011;10(1):185-95. ISSN 0124-793X.
15. Franco C, Velásquez J, Cardona D. Micromundo para simular un mercado eléctrico de corto plazo. Cuadernos de Economía. 2012;31(58):229-56. ISSN 2248-4337.
16. Pasin F, Giroux H. The impact of a simulation game on operations management education. Computers & Education. 2011;57(1):1240-54. ISSN 0360-1315.
Recibido: 15 de abril del 2015.
Aprobado: 11 de mayo del 2015.
Jorge Pérez Rave, Universidad de Antioquia, Departamento de Ingeniería Industrial, Medellín, Colombia. Correo electrónico: jorge.perez@udea.edu.co

