


 Servicios personalizados
 Español (pdf)
 Articulo en XML
 Referencias del artículo
 Enviar articulo por email
 Citado por SciELO
  Similares en
SciELO
Similares en
SciELO 
 Permalink
1- Introduction
The Electric Power System (ESS) is composed of several devices used to transfer electrical energy from power generation to consumers in four stages: generation, transmission, distribution and consumption of electricity. Power generation is established by a plant, which can be, for example, a hydroelectric plant, a thermoelectric plant, a solar plant, a wind power plant, among others. Transmission refers to the transmission of electrical energy to the substation (usually located close to consumer centers). And finally, energy distribution is part of a set of equipment responsible for delivering energy, with quality and reliability, to final consumers in urban, rural or industrial areas [1, 2].
In recent years, due to the growing demand for electricity, power system operations have become very complex [3]. The large number of buses implies in an increase in the order of the impedance matrix, requiring the use of optimization techniques to reduce the execution time of the program that will analyze the network load flow in the disturbance detection procedure. This increase has a greater impact on the Distribution System (DS), as they are the terminal circuits for power supply. In order to minimize the impacts caused by distribution system disturbances and bring greater reliability and quality to the distribution system, several techniques are proposed in the specialized literature. In the Related work subsection, some of these bibliographies that were relevant for the elaboration technical and philosophical structuring of this research will be exposed, aiming at the development and implementation of Conductor Break (CB) detection methodologies.
One of the biggest problems in distribution systems is the challenge of detecting and distinguishing the conductor break in the electrical system. In 1949, an AIEE working group concluded that at that time there was no fully successful solution to the conductor break problem [4]. Furthermore, when the conductor break, it can touch a high impedance surface, such as concrete, asphalt, sand or vegetation causing a High Impedance Fault (HIF), that is commonly not reliably detected nor distinguished from other events that commonly occur at the distribution systems, posing risks to human life and property [5]. This occurs because the current of this type of fault is very low, not being enough to trigger the conventional protection scheme [6]. For these reasons, the relevance of detecting this phenomenon is clear.
For years, much research has been carried out with the aim of developing accurate methods for detecting conductor break, as their direct measurements such as current, voltage and frequency do not show a specific variation in a conductor break to differentiate it from normal operating conditions [7]. Thus, there are several methods for detecting a conductor break, and the most common are: waveform analysis techniques and analysis techniques based on information received from Phasor Measurement Unit (PMU) [8]. These methods usually use detection algorithms, and the most used are those that analyze frequency components and variation in arc current [9]. Arc current occurs as a consequence of conductor contact with ground or any other high impedance structure. When this arc occurs, the magnitude of the current changes quickly with time. So to identify the fault, analytical techniques and the Wavelet Transform are used [10]. However, these methods require the measurement of this arc current flow in the phase in which the fault occurred, and if the broken conductor does not come into contact with any object, this method becomes inaccurate [11].
O’Brien [12] developed a conductor break detection method, in which the affected circuit section is de-energized while the conductor is still falling. Although this method works, the DS must be a smart grid composed of several intelligent electronic devices (IEDs) capable of transmitting data from the phasor measurement unit and substation controllers with high-speed communication. Therefore, although the methodology is successful in de-energizing the circuit that caused the conductor break before the HIF occurs and having yielded the patent to the authors [13], the method is expensive to implement due to the large number of devices along the DS. A similar methodology was tested in [14], where the conductor break detection system is based on distributed voltage measurements, performed on the low voltage sides of distribution transformers across the entire network, with network communication by global system for mobile communications to locate the fault line section. The system finds the fault by searching the last active unit and the first inactive unit and then performs the necessary de- energizing to avoid HIF. In [15] a similar methodology was applied in practice, where the authors proposed the development of the concept of an adaptive protection system to detect CB, of the AADC Al Ain distribution network (in the eastern region of the Emirates of Abu Dhabi). However, in both studies, the authors did not obtain fully satisfactory results due to the high temperature characteristics of the desert region, causing problems such as loss of communication between the IEDs, besides to the high costs of installing and maintaining devices in remote locations.
Vieira [16] proposed a method to detect the conductor break through smart meters placed at strategic points along the feeder, and to calculate the voltage unbalance factor, the authors use the symmetrical voltage components approach. However, the distribution system must be a smart grid for the proposal to work, generating high implementation costs. In addition, the authors report problems with the implementation of high-resistance shunt failures, since the differences between upstream and downstream unbalance were small, making it difficult to establish a threshold to distinguish failed sections from sections in normal operation. Similarly, [17] present a similar proposal for the location of the conductor break using the Negative Sequence Voltage (NSV). Again, the system must be a smart grid for the proposal to work, as the authors use the data recorded in the intelligent measurement unit on the high voltage side and locate the faulty sections by applying the relationship between the fault distance and the measurement groups.
With respect to measurement points, in [18], several detection relays are used at the critical load buses and the authors also consider a variety of loading conditions to understand the impact of a conductor break condition. In [6], six measurement points are used throughout the IEEE 34 nodes test feeder, arranged in locations considered by the authors as critical. Despite the number of meters installed at the distribution system, this technique is sensitive to the correct determination of a threshold value for the conductor break and event severity levels, as a small misadjustment can lead to an incorrect classification. In [19], the authors propose a scheme based on unbalanced natural disturbances, which requires the installation of only two devices: a main bus voltage disturbance monitor and a single-phase current monitor on the transformer's neutral conductor. However, the method's performance can be affected by the frequency of occurrence of disturbances, in which, despite using only two devices at the distribution systems, according to the authors, it is configured as a limited method.
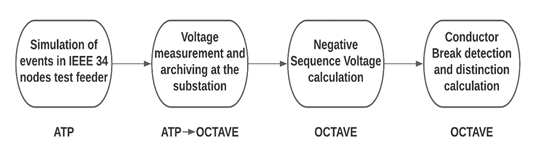
Due to the difficulties seen in the previous, this paper proposes to use techniques based on Negative Sequence Voltage (NSV). The results show that the method proposed in this paper is simpler than the techniques mentioned, in addition to being a more economical method as it is not necessary for the distribution system to be a smart grid with several meters, advanced communication equipment and intelligent devices. All tests were modeled using the software Alternative Transients Program (ATPTM), through the interface ATPDrawTM and the processing and calculation of the negative sequence voltage was performed using the Octave software, and the case studies were modeled using the IEEE 34 nodes test feeder [20]. In addition, simulations of the following voltage disturbances were also performed: swell, sag, harmonic, outage, swell with harmonic, sag with harmonic, and events such as: Lateral Branch Switching (LBS), Lumped Load Switching (LLS), Distributed Load Switching (DLS), Capacitor Switching (CS). To obtain the best location of the meters in the test system, the General Algebraic Modeling System (GAMS) software was used, which is a high-level modeling system for mathematical optimization and which provides a solution to increase the observability of the distribution systems. It is noteworthy that all software used in this work is free license.
The main contributions of the paper are:
Development of a model in ATPDrawTM software, able of reproducing the main voltage characteristics of the conductor break, as well as the main disturbances and events that can occur at the distribution systems.
Implementation of an algorithm based on the negative sequence voltage calculated at each cycle (γ) applied to the detection and distinction of the conductor break in comparison with the other events, using Octave software.
Obtain the best location of the meters at the distribution system and the least amount of implementation of these meters through the use of GAMS software.
2.- Material and methods
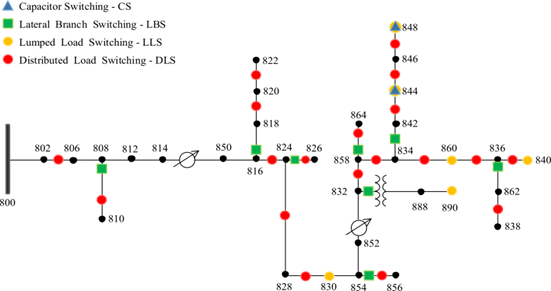
The main objective of this work was to provide insightful results to support researchers to employ negative sequence voltage in conductor break detection methods. The characterization of the conductor break signals were performed using the IEEE 34 nodes test feeder [20]. This test feeder is an actual feeder located in Arizona, with a nominal voltage of 24,9 kV. This feeder was chosen because it is a naturally unbalanced system, with long branches and diversified loads characterized by long and lightly loaded, two in-line regulators, an in-line transformer for short 4,16 kV section, unbalanced loading, and shunt capacitors. The simulations were performed using the software ATPTM through the interface graphic ATPDrawTM based on simulator Electromagnetic Transients Program (EMTP). Then, in the ATPDrawTM software, models were developed that reproduced the behavioral characteristics of the voltage signals of the described events and switches, for the IEEE 34 nodes test feeder, as well as for the conductor break.
The conductor break were made by opening single-phase switches connected to all buses in the system and for the three-phase buses, a switch was inserted in phase A, and in phases B and C a low-ohmic resistor was inserted (1E-5 Ω). It was necessary to add this resistor so that there was no error in the ATPDrawTM compilation. In order to was not necessary to did this scheme manually for the 33 buses of the test system (excluding the substation), a conductor break automation routine was developed and through this routine, different conductor break incidence angles can be inserted, as follows: 0°, 45°, 90°, 135°, 225°, 270° and 315°. These incidence angles can be determined through the Fourier numerical series, where the switching time is found [21]. Therefore, for the conductor break, 33 simulations were performed and for each of these seven switching angles, the voltage signals measured only at the substation were saved. In this paper only the results for the 90° switching angle will be shown, i.e the events occurring at 1 second.
The Voltage Disturbances (VD) Sag, Swell, Harmonic, Sag-Harmonic, Swell-Harmonic, Outage and Transient Oscillation were simulated using the Models routine developed by [22]. This routine allows the ATPDrawTM user to control the operation of electrical components of the simulated system, by specifying and changing the value of numerical and/or analog parameters. From this routine, blocks are developed that mathematically simulate the occurrence of disturbances as shown in [23].The LBS (in green in Fig. 1), were performed by energizing and de-energizing 8 switches right after the start bus of the branches in the system, totaling 16 simulations for this case. To carry out the LLS tests (in yellow in Fig.1), the switches were connected in series with the six loads already existing in the test system. The process consisted of closing and opening the switching, totaling 12 simulations for this case. Similarly, DLS tests (in red in Fig.1) were performed for the 19 loads distributed by the system, totaling 38 simulations for this case. Finally, the switching of a capacitor bank was simulated, on buses 844 (CS1) and 848 (CS2) (in blue in Fig.1) and the characterization of this event occurred through tests based on the insertion and removal of capacitors.
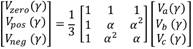
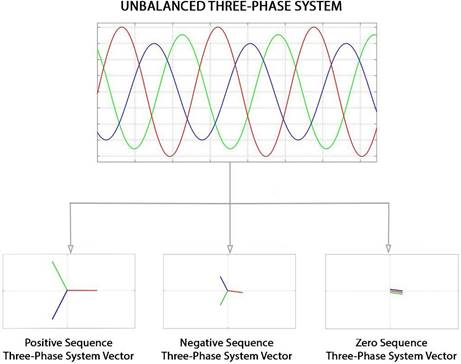
The IEEE 34 nodes test feeder is an unbalanced three-phase system that can be phasor fully decomposed into three balanced three-phase systems, as shown Fig.2 [2]. There are several ways to characterize voltage unbalance, where the degree of unbalance is defined by the relationship between the modules of the negative sequence voltage and the positive sequence voltage, as described by [8], in which says that the voltage unbalance of a three-phase distribution system should be less than 3%. This can be applied for either voltage or current. Also in [8], it is possible to determine the unbalance factor using only measurements of Root Mean Square values from phase to phase without angle. However, the equations provided in [8] are used in the calculation of the imbalance factor, and in this paper only the negative sequence voltage value was used. Then, through Stevenson (1986) it is possible to determine only the value of the negative sequence voltage (VNEG), the positive sequence voltage (VPOS) and the zero sequence voltage (VZERO), as shown by Equation (1):
 (1)
(1)
in which 𝛼 = 1∠120° and 𝛼2 = 1∠240°.
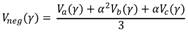
Through Equation (1) it is possible to decompose the three asymmetric phasors into their symmetric components (zero, positive and negative sequences). As the focus of this paper was to investigate the behavior of the negative sequence voltage, (1) was decomposed and (2) shows only the negative sequence voltage:
 (2)
(2)
Therefore, in order to provide a method of analysis the potential of the NSV to identify and distinguish the conductor break from other events, using the least amount of meters at the DS, the negative sequence component of the phase voltage signals was used a (V A ), b (V B ) and c (V C ). After recording the voltage data, the processing and calculation of the NSV data were performed by using the Octave software, in which, for each simulation, a white Gaussian noise with a Signal-to-Noise Ratio (SNR) of 20, 40 and 50 dB was added to the three-phase voltage signals. The bibliography points out that usually, at DSs, the SNR is 30 to 70 dB [24]. The SNR values were selected to assess the immunity of the proposed approach against noise, however in this paper only the worst case will be shown, which is the 20 dB SNR, as also shown by [25]. Then, the signal was filtered through a second- order Butterworth filter with a cutoff frequency of 180 Hz. Subsequently, the filtered three- phase voltages V A , V B and V C were windowed at each cycle (γ), with a sampling rate of 128 samples per cycle. Ultimately, the phasors were calculated using the fast Fourier transform. This entire proposed process is represented in Fig. 3:
By obtaining the negative sequence voltage post-fault values, it was possible to differentiate them from the other tested events. However, as also noted by [25], in some cases it was not possible to distinguish the conductor break in comparison with the tested events or switchings. So, in order to use the least amount of meters in the system, the GAMS software was used. Thus, the Gcode 8.4 (Minimum Number PMU Placement for Maximizing the Observability) from the GAMS library was adapted for the IEEE 34 node test feeder, providing the maximum observability of the system and using the minimum number of voltage meters. For this, a binary variable 𝛼 i was defined, where the states of the buses i are observable (1) or not (0). Thus, the optimization problem is as shown by the Equations (3), (4), (5) and (6) [26]:
 (3)
(3)
 (4)
(4)
 (5)
(5)
 (6)
(6)
in which i, j are bus indices, xi is a binary variable that indicates the existence of phasor measurement unit, 𝛺𝐵 is the set of all buses, 𝛼 i is an integer variable (observability) whose minimum value is defined as 1 to make the entire network observable, and NPMU is the number of measurement devices.
In this way, GAMS performs the optimization of the objective function (Equation 3), subject to the restrictions imposed by Equations 4, 5 and 6. Then, through an iterative process and with the exclusion of the substation, since it already had a meter on it, and of the single-phase B buses, since the CB occurs in phase A, the optimized response is provided and Table 1 shows the optimal allocation of devices meters for maximizing the system observability of the IEEE 34 node test feeder.
To obtain a fully observed system, GAMS recommends the installation of 10 phasor measurement units, but one of the objectives of this work is to reduce the costs of implementation and maintenance of the PMUs, therefore, initially a meter was installed at the substation, then the entire process was carried out described through Fig. 3 and analyzed whether the results were satisfactory for detecting and distinguishing conductor break in comparison with other events. Afterward, the second meter was installed, being it at 836 bus, that was the result of the first GAMS optimization iteration. It is noteworthy that this process can be performed for any test or real distribution system, as the Gcode 8.4 from the GAMS library can be easily and simply adapted to any feeder, in which will provide maximum system observability using the minimum number of voltage meters.
Figure 4 shows the flowchart for detecting and distinguishing the conductor break compared to the other events, with two meters installed in the IEEE 34 node test feeder.
Table 1 Optimal allocation of phasor measurement units
| BUS | NPMU | |||||||||
|---|---|---|---|---|---|---|---|---|---|---|
| 1 | 2 | 3 | 4 | 5 | 6 | 7 | 8 | 9 | 10 | |
| 806 | 1 | 1 | 1 | 1 | ||||||
| 812 | 1 | 1 | ||||||||
| 814 | 1 | 1 | 1 | |||||||
| 816 | 1 | 1 | 1 | 1 | 1 | |||||
| 820 | 1 | 1 | 1 | |||||||
| 824 | 1 | 1 | 1 | |||||||
| 830 | 1 | 1 | ||||||||
| 832 | 1 | 1 | ||||||||
| 836 | 1 | 1 | 1 | 1 | 1 | 1 | 1 | 1 | 1 | 1 |
| 842 | 1 | |||||||||
| 846 | 1 | 1 | 1 | 1 | 1 | 1 | 1 | |||
| 854 | 1 | 1 | 1 | 1 | ||||||
| 858 | 1 | 1 | 1 | 1 | 1 | 1 | 1 | |||
| 888 | 1 | 1 | ||||||||
| Total observable buses | 4 | 8 | 12 | 15 | 18 | 21 | 23 | 26 | 28 | 29 |
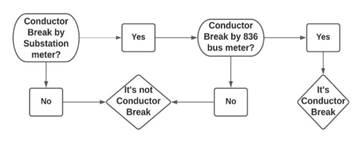
Therefore, it was defined that when the two meters acknowledge the conductor break it will really be a conductor break, however when only one of the two meters acknowledge the conductor break, it is concluded that it will not be a conductor break. Thus, in order to analyze the effectiveness of the proposed methodology, the Results and Discussions section will show an analysis of the proposal only at 848 bus followed by the subsections with five case studies, as follows:
Case I: All buses of the test system with a spot allocated at the Substation;
Case II: Without the critical buses of the test system;
Case III: All test system buses with a spot at bus 836;
Case IV: Without the critical test system buses with one spot located at bus 836 and
Case V: Without the critical test system buses with one spot located at the Substation and one spot allocated at bus 836.
3.- Result and discussion
3.1.- Analysis only at Bus 848
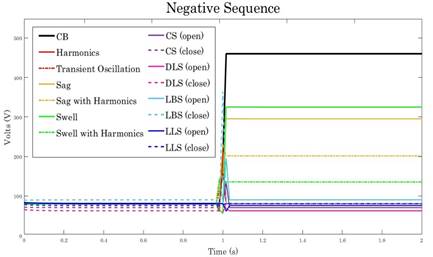
Figure 5 shows the differentiation of the CB’s negative sequence voltage (in black) compared to the other tested events and switchings. The negative sequence voltage was measured only at substation of the IEEE 34 nodes test feeder, with all events occurring at 1 second at bus 848. For better visualization, the Outage negative sequence voltage value was removed from Fig. 5, as it had a very high value (19 418,99 V). This bus was chosen to be exemplified because it is located 57,75 km from the substation (where the readings were measured), and this bus being the 29th farthest from the substation.
To show a clear distinction of the conductor break compared to the other events and switches, Table 2 shows the negative sequence voltage values of pre-fault and post-fault for all events that occurring at bus 848.
It is possible to see (highlighted in yellow) that the post-fault value for the conductor break was significantly higher than for the other events, while the other events (VD, SWP, DLS and CS) have an average value of 78,92 V and a maximum value of 90,28 V. With this, it is possible to verify the potential of the negative sequence voltage to detect and distinguish the conductor break in different scenarios of the distribution system.
Table 2 Negative sequence voltage values occurring at the bus 848
| Event | Pre-fault | Post-fault | Event | Pre-fault | Post-fault | |
|---|---|---|---|---|---|---|
| CB | 80,576 | 322,319 | DLS (open) | 80,584 | 74,482 | |
| Swell | 80,576 | 190,293 | DLS (close) | 62,509 | 69,449 | |
| Sag | 80,576 | 225,967 | LBS (open) | 80,583 | 137,554 | |
| Harmonics | 80,576 | 146,037 | LBS (close) | 90,285 | 223,304 | |
| Transient Oscillation | 80,576 | 125,679 | LLS (open) | 80,584 | 70,795 | |
| Sag with Harmonics | 80,576 | 216,652 | LLS (close) | 75,903 | 79,581 | |
| Swell with Harmonics | 80,576 | 111,180 | CS (open) | 80,583 | 107,243 | |
| Outage | 80,576 | 19 418,99 | CS (close) | 70,507 | 119,393 |
3.2.- Case I: precision in distinguishing conductor break
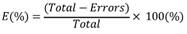
First, with the voltage meter at the substation, the conductor break for all buses was simulated, and the substation and the single-phase buses of phase B were excluded, obtaining the following values: minimum value of 80,58 V, mean value of 1 030,78 V, standard deviation of 757,73 V and maximum value of 2088,36 V. This minimum negative sequence voltage value was obtained for the conductor break simulation at bus 862, which was selected as a threshold for the distinction conductor break compared to other events. After that, the negative sequence voltage values were obtained for all tested Voltage Disturbances (VD) and switchings, then, if the negative sequence voltage of the VD and switching is greater than the threshold (80,58 V), it means that this event has been incorrectly classified as a conductor break. Then, through Equation 7, it is possible to determine the efficiency of the methodology.
 (7)
(7)
in which Total is the quantity of events and Errors is the number of errors considering the negative sequence voltage values of non- conductor break events that violated the threshold.
Table 3 shows the percentage of conductor break distinction compared to the other simulated events, and it can be seen that, considering the 33 simulations of conductor break and 77 simulations for the other events, there were cases in which it was not possible to distinguish the conductor break. The worst case was the CS, so all simulations would erroneously detect these events as conductor break. With these data, it is concluded that a successful distinction between the conductor break and the other events occurs when the negative sequence voltage calculated after the event is lower than the minimum negative sequence voltage value established for the conductor break.
Table 3 Distinction of conductor break: Case I
| Event | Total Simulations | Total Errors | Percentage of CB distinction |
|---|---|---|---|
| VD | 7 | 6 | 14,29% |
| CS | 4 | 4 | 0,00% |
| LBS | 16 | 9 | 43,75% |
| LLS | 12 | 6 | 50,00% |
| DLS | 38 | 29 | 23,68% |
| TOTAL | 77 | 54 | 29,87% |
Therefore, in order to increase the efficiency in distinguishing conductor break in comparison with the other events, the system was analyzed again without the critical buses, as shown in the following subsection.
3.3.- Case II: Analysis without the critical buses
Through the previous simulation, it was seen that the lowest values of the CB’s NSV were at buses single-phase B and those that had low or no loading. So, these buses will be considered as critical in this subsection, being the bus: 810, 826, 838 and 856 (single phase B), and the bus: 822, 840, 862 and 864 (with low or no loading). It should be noted that some references warn that faults located at the end of the feeder or in side branches are less likely to be detected and that a CB condition varies with the resistance and fault location [5, 7]. Therefore, the sensitivity of NSV also varies with these parameters.
So the same methodology of the previous subsection was applied, but now, excluding the buses determined here as critical, and a change was observed in relation to the minimum limit of the CB’s negative sequence voltage, going from 80,58 V (previous subsection) to 149,54 V. With this new minimum value of the CB’s negative sequence voltage, it can be analyzed in comparison with the other events and thus determine a new detection efficiency, through Equation 7. Table 4 shows the percentage of the distinction of conductor break with the other events.
Table 4 Distinction of conductor break: Case II
| Event | Total Simulations | Total Errors | Percentage of CB distinction |
|---|---|---|---|
| VD | 7 | 3 | 57,14% |
| CS | 4 | 0 | 100,00% |
| LBS | 16 | 2 | 87,50% |
| LLS | 12 | 0 | 100,00% |
| DLS | 38 | 3 | 92,11% |
| TOTAL | 77 | 8 | 89,61% |
As seen in Table 4, there was an increase in the efficiency of distinguishing the conductor break compared to the other events, going from 29,87% (with critical buses) to 89,61% (without critical buses), and of the 77 simulations, only 8 events were misidentified as conductor break.
Although the methodology presented is simple and practical to be implemented, it has some disadvantages regarding the distinction of the conductor break compared to other events, in addition to considering a bus as critical and consequently removing it from the calculations, makes the distribution system not to be represented in its entirety. It can also be seen that CB detection with measurements performed only at the substation is a challenge, especially if the event occurs far away from it or at buses with low or no loading. The bibliography shows that several works use many measurement points, in [6, 19], the authors propose conductor break detection and distinction schemes, using many measurement points along the distribution system. Thus, in order to increase the efficiency in distinguishing the conductor break from other events, the next subsection shows an optimization applied to the location of one more measurement point in the distribution system.
3.4.- Case III: Optimizing the location of a second measurement point
For this analysis, the GAMS software was used, which allows performing a high-level modeling for mathematical programming and optimization. As already shown in the specifics of the application of this software in the Material and Methods section, in the first iteration of the software, the location of the measurement point at bus 836 was recommended. Subsequently, the voltage data of all events was simulated as explained in the previous subsections, obtaining a new limit for the conductor break, in which is 757,57 V. As previously, conductor break was defined as any event with a negative sequence voltage value lower than the minimum (757,57 V). Through Equation 7, Table 5 shows the percentage of the conductor break distinction efficiency compared to the other events.
Table 5 Distinction of conductor break: Case III
| Event | Total Simulations | Total Errors | Percentage of CB distinction |
|---|---|---|---|
| VD | 7 | 6 | 14,29% |
| CS | 4 | 4 | 0,00% |
| LBS | 16 | 16 | 0,00% |
| LLS | 12 | 11 | 8,33% |
| DLS | 38 | 36 | 5,26% |
| TOTAL | 77 | 73 | 5,19% |
As can be seen in Table 5, the efficiency in distinguishing the conductor break from the other events did not reach satisfactory levels, as a result of the high value of the negative sequence voltage limit established for the conductor break (757,57 V). Then, the next subsection will show the same analysis, but without the critical buses.
3.5.- Case IV: With a second measurement point and without the critical buses
Therefore, in order to improve the results, the buses determined to be critical in this paper were excluded. Thus, an increase in the new lower limit of the negative sequence voltage to conductor break value was obtained, being: 1 110,93 V. With this new limit, a greater distinction between events is possible. Table 6 shows the percentage of the CB's distinguishing efficiency without the critical buses.
Table 6 Distinction of conductor break: Case IV
| Event | Total Simulations | Total Errors | Percentage of CB distinction |
|---|---|---|---|
| VD | 7 | 1 | 85,71% |
| CS | 4 | 0 | 100,00% |
| LBS | 16 | 1 | 93,75% |
| LLS | 12 | 0 | 100,00% |
| DLS | 38 | 0 | 100,00% |
| TOTAL | 77 | 2 | 97,40% |
The functionality of using the GAMS software is verified, as there was an increase in the percentage of conductor break distinctions efficiency compared to the other events. Analyzing the results, when considering the distribution system with all buses and comparing the percentage of conductor break distinctions efficiency compared to the other events, 29,87% efficiency was obtained with the measurements at the substation and only 5,19% with the measurements at bus 836. Analyzing the distribution system without the critical buses, the percentage of distinctions efficiency with the measurements at the substation was 89,61% and 97,40% efficiency with the measurements at bus 836. Despite achieving a satisfactory result of overall distribution system efficiency, there were events that could not be distinguished from the conductor break. Thus, in order to increase efficiency, the two measurers operating together at the distribution system were simulated, with one measurer allocated at the substation and the other measurer allocated at bus 836 and the results are shown in the next subsection.
3.6.- Case V: Analysis with two measurers
This analysis was performed as shown in Fig. 4 of the Materials and Methods section, where the minimum limits were used for each of the measurers without the critical buses, being 149,54 V for the substation bus and 1 110,93 V for the bus 836. In which:
when the two measurers acknowledge the conductor break, it is concluded that it really is a conductor break;
when only one of the two measurers acknowledge the conductor break, it is concluded that it is not conductor break;
when the two measurers acknowledge a non- conductor break, it is concluded that it is not a conductor break.
Thus, Table 7 shows the percentage of distinction between the conductor break and the other events.
Table 7 Distinction of conductor break: Case V
| Event | Total Simulations | Total Errors | Percentage of CB distinction |
|---|---|---|---|
| VD | 7 | 0 | 100,00% |
| CS | 4 | 0 | 100,00% |
| LBS | 16 | 0 | 100,00% |
| LLS | 12 | 0 | 100,00% |
| DLS | 38 | 0 | 100,00% |
| TOTAL | 77 | 0 | 100,00% |
As can be seen from Table 7, there was a total distinction of the conductor break in comparison with the other events tested when using only the two meters operating together in the IEEE 34 nodes test feeder.
3.7.- Discussions
In this paper, 5 case studies were presented, and Table 8 shows the percentage of efficiency in distinguishing the conductor break compared to the other events tested.
Table 8 Summary of the efficiency in distinguishing the conductor break
| Cases | Number of buses | Lowest NSV value (V) at the substation | Lowest NSV value (V) at bus 836 | Percentage of CB distinction |
|---|---|---|---|---|
| I | 33 | 80,580 | - | 29,87% |
| II | 25 | 149,549 | - | 89,61% |
| III | 33 | - | 757,574 | 5,19% |
| IV | 25 | - | 1 110,930 | 97,40% |
| V | 25 | 149,549 | 1 110,930 | 100,00% |
With the analysis of the five cases presented, it was possible to verify how critical buses and threshold selection affect the ability of negative sequence voltage to be used in conductor break detection schemes. Another important factor is related to the bus load, as there has always been a significant negative sequence voltage component for the conductor break in cases of high loads. This factor was also observed by [6, 7, 18]. However, it is noteworthy that it was possible to achieve 100% conductor break distinction with only two meters in the test system, for example, the authors [16] proposed a method to detect conductor break through smart meters placed at various strategic points along the feeder, generating high implementation and maintenance costs. The authors [17] also present a similar proposal for the location of the conductor break using the negative sequence voltage and again the system must be a smart grid for the proposal to work. In [6], six measurement points are used throughout the IEEE 34 nodes test feeder, arranged in locations considered by the authors as critical, and yet, despite the high number of meters installed at the distribution system, this technique is sensitive the correct determination of a threshold value for the conductor break and event severity levels.
Finally, it is observed that the analysis method presented in this paper provided a verification of the potential of negative sequence voltage for the detection and distinction of conductor break in distribution system. Regarding the measurement points arranged along the distribution system, it is noteworthy that, in the methodology proposed in this paper, initially only one measurement point (substation) was used and later another measurement point optimized through the GAMS software, differing from the works that are being presented, making this methodology simpler, easier to be implemented and with a lower cost of implementation and maintenance.
4- Conclusions
Due to the current demand for electricity and, consequently, the growing expansion of distribution systems, in addition to the constant changes in this scenario, this paper was based on the proposal of a detection and distinction model of the conductor break compared to several other types of events that may occurring on the distribution system. For the tests, the IEEE 34 nodes test feeder was used and five cases were created for this system, in order to analyze the capacity and potential of the negative sequence voltage in detecting conductor break and distinguishing it from the events.
The results showed the ability and potential of negative sequence voltage to correctly detect conductor break. In addition, the use of negative sequence voltage proved to be an economically viable alternative when combined with the analysis methodology used in this paper, which used only two measurement points (substation and bus 836), being simple and practical to implement, generating savings in maintenance. Finally, negative sequence voltage is a promising technique and can be used as a first screening together with other techniques to compose a reliable conductor break detection method.
The approach used in this paper is just one of several possible approaches to detecting and distinguishing conductor break in distribution systems. Given the results, some suggestions for exploring this study can be highlighted, such as:
Performing tests with other distribution system models with different configurations;
Carrying out a study on three-phase detection to identify which phase the conductor break is in;
Proposing a tool capable of being used in real time in distribution systems, with the objective of providing energy with quality and reliability and contributing to the development and application of devices capable of operating automatically in the detection and location of conductor break.
As noted, conductor break detection and distinction is not limited to a simple and easy-to-solve problem. Thus, it is important to broaden its study in all directions, allowing great contributions to society, a fundamental role of the scientific community.

