


 Servicios personalizados
 Inglés (pdf)
 Articulo en XML
 Referencias del artículo
 Enviar articulo por email
 Citado por SciELO
  Similares en
SciELO
Similares en
SciELO 
 Permalink
Introduction
The natural ecosystem provides society with a large number of flows of goods and services that improve social wellness in a direct and indirect way. In addition, these flows represent the sustenance of sustainability in the trade and economy of the countries. However, in the market society in which we find ourselves, the importance of all types of goods or assets is fundamentally understood through the expression of their monetary value (Osorio & Correa, 2004). Land is known to produce a variety of benefits from ecosystem services, but markets only incentivize the production of a small proportion of them. The Ecosystem Approach develops plans to move towards a more optimal mix. This requires stakeholders to understand the value of ecosystem services and how these values change with land use and management. The economic valuation of the benefits of ecosystem services aims to improve decision-making, taking into account non-commercial and market values. When non-commercial benefits have agreed values, these can be used in Cost Benefit Analysis (CBA) to assess how proposals affect the general economic well-being of the population once commercial and non-commercial benefits have been taken into account. This is important because the CBA is a decision support process required in many governments (Turner, 2007; Lusardi et al., 2020). Therefore, one of the best ways to demonstrate and convey the importance of an environmental asset will be by determining the economic value of the goods and services they provide.
When referring to the total economic valuation (TEV) in the environmental sphere, it is evident that we are talking about assigning a monetary value to the goods and services that environmental systems provide us in a defined geographical framework. This fact is controversial for some researchers, since they argue that it makes no sense to define a value for a good that has no market and that will never be the subject of a transaction. On the other hand, in other social sectors, mainly environmentalists, it is thought that obtaining the value of an environmental space is the first step on the road to its privatization (Aznar & Estruch, 2015). However, different authors who have contributed to the study of economic valuation consider that valuing the environment economically means being able to have an indicator of its importance in the welfare of society, which allows it to be compared with other components of the environment, for which it is a common denominator is necessary, and this is money (Raffo, 2015); They also justify that the economic valuation of said assets is in order to make better use of public resources. Thus, it can serve to justify and enable the distribution of the public budget among the different public investment alternatives, as well as among the different initiatives for the conservation, preservation or restoration of environmental assets.
In environmental valuation, there are already a series of methods used in a large number of works that, using different approaches, seek to determine a monetary value of either the asset considered or the services that asset produces. The best known are the cost of travel, the contingent valuation method and the hedonic value method, all within the Environmental Economics approach. And, from an Ecological Economy perspective, the most representative are energy analysis and Thermal Analysis (Brown & Herendeen, 1996; Odum, 1998).
This work presents a different methodology from the previous ones, because it has a double purpose in the valuation of the natural resource ecosystem and provides a new perspective for its analysis, where multiple languages of valuation of goods and services are carried out that additionally take into account takes into account ethnic and cultural specificities, in turn includes biophysical indicators that are as important or more than market-generated prices. For these reasons, the application of the Analytical multi-criteria valuation method (AMUVAM) is appropriate; This model is based on the interaction of two techniques such as the Hierarchical Analytical Process (AHP) and the income update rate (Aznar & Estruch, 2015).
The AHP consists of the analysis of the multicriteria decision theory by means of a conglomerate group of experts with environmental knowledge of the components of the environmental component, who rank said assets for prioritization and valuation purposes. Decision making is about priorities, and unless A can be said to have "more" or "less" intrinsic value than B, no one can say whether A should take precedence over B, or vice versa. The practical question, therefore, is not whether there is intrinsic value, but what use can be made of it, if it exists (Provins et al., 2008). Meanwhile, the rent update rate serves to know the present value of a product through the sum of the profits (cash flow of Income-Expenses) and the future values that a good or product can generate for its owner or producer; With this calculation, the pivot value is determined in order to economically value the components of the environmental asset. In this way, economic value accumulates as a flow of benefits for individuals; has use components grouped by direct use value, indirect use value, option / co-option value and Non-use value grouped by existence value and inheritance or future value, the sum of which is called total economic value (Provins et al., 2008; Aznar & Estruch, 2015).
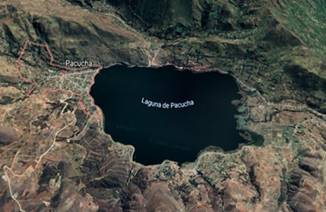
In this sense, the main objective of this research was the economic valuation and prioritization of the environmental assets of the ecosystem of the Pacucha lagoon, located in Andahuaylas, Peru, applying the AMUVAM method.
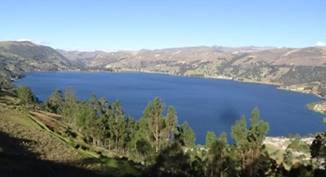
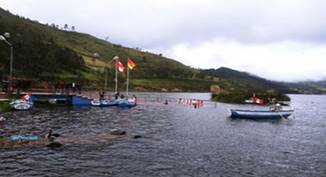
By way of description of the scope of study, the Pacucha lagoon is considered one of the largest and most beautiful lagoons in Peru, as illustrated in figure 1. It is also considered one of the most visited tourist places by national and international tourists. since, in addition to making the visit, it can allow them to carry out recreational activities as shown in figure 2. It is also the source of the most important agricultural system, since it is categorized as one of the promoters of the economic development axis of the Apurimac region. Its importance lies in the fact that its volume of water and the nutritional components of its waters are productive according to the Tourist Encyclopedia of Peru (TEP) to the year 2019.
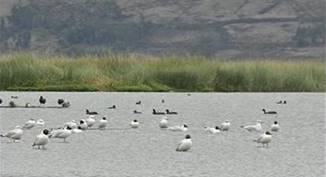
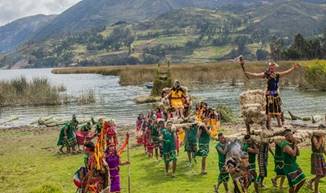
The use of the water resources of the lagoon within the agricultural system, is used mainly for the production of potatoes of various varieties, corn and vegetables; and in livestock activities for the raising of cattle, sheep, pigs and small animals such as guinea pigs and chickens, which provides sources of food and economic resources for the benefit of the people who inhabit the place and the surrounding communities. Another essential characteristic of the lagoon is the water temperature, which ranges between 15°C in June and July and a maximum of 19°C in March and April, and this favors the existence of a community of living beings and the natural environment according to the report of the Dirección de Comercio Exterior y Turismo (DIRCETUR) for the year 2020 from the Apurímac region, Peru; Also on its banks are plants such totora, adapted and endemic flora species, as it is, the atajo, molle, fennel, parsley, aloe, marcco, artemiza, amorseco, santa maría, llaulli, cedroncillo, ajenjo, mutuy, diente de lion, nabo, escoba, manayupa, alfalfa, trébol, hierba buena, orégano, malva silvestre, llantén, hierba dulce, lengua de vaca, romanza, ruda, totora, aguaymanto, eucalyptus, cypress, pine, kishka, yahuarchoncca ayaczapatilla and nettle. On the other hand, birds such as: Black Skimmer, Yanavico, Cattle Heron, White Heron, Bandurria, Rascón, Andean Cold Bird, Sandpiper, Sandpiper, Tricolor Faláropo, Skimmer Sandpiper, Andean Gull, Junquero, Neotropical Cormorant, Wild Duck, Andean Coot, Pato Barcino, Pato Jergón, Sambullidor and Moorhen, as can be seen in figure 3. On the other hand, in this natural space of the Pacucha lagoon cultural and religious activities are carried out within the framework of the festivities of Sondor Raymi or the Chanka epic in Apurimac in commemoration of the Chanka culture, as can be seen by way of illustration in figure 4, which are other non-material benefits that people obtain from this cultural ecosystem of the lagoon, these cultural and natural manifestations. The resources respectively represent the greatest attractions of this geographic space.
Materials and methods
Scope of the study
In the context of the scope of study, the lagoon is located in the district of Pacucha, which is located 16.1 km from the capital of the province of Andahuaylas, at an altitude of 3,125.00 meters above sea level. Located between the coordinates: 13° 36´ 27¨ south latitude and 79° 19´30¨ west longitude, it has an area of 728.00 has (Earth, 2019). Its dimensions are, maximum length 3,970.00 meters on the east-west axis; maximum width 2,680.00 m; maximum depth 30.00 m, water volume 118,010,495.00 m3. (DIRCETUR, 2020), whose environmental asset of the ecosystem of this resource is delimited in the TEV components. The area surrounding this resource is obviously productive, as indicated in figure 5. Therefore, this natural resource in a way guarantees the food security of those who live in this area and the surrounding communities.
Methodology of economic valuation of the environmental asset using AMUVAM
The economic value of environmental goods and services were quantified using the Analytic Multicriteria Valuation Method (AMUVAM) described by Aznar & Estruch (2015). This is a method of valuation of environmental assets which is composed of two techniques, the Analytic Hierarchy Process developed by Saaty (2008), that includes the selection of alternatives ased on a series of criteria or variables, and the Income Update Method established by Ramsey in 1928 and updated by Aznar & Estruch (2015). Follow, the Direct Use Value (DUV) will be calculated. DUV is the only component of the TEV that can calculate your income because it includes the activities that the market detects. Subsequently, your total income will be updated to the social rate of temporaty preference calculated for Peru. Using the DUV as the pivot value, the value of the rest of the components will be calculated. Finally, adding the values of all the components, the TEV is obtained. The diagram of the Fig 6 shows it in a clearer way.
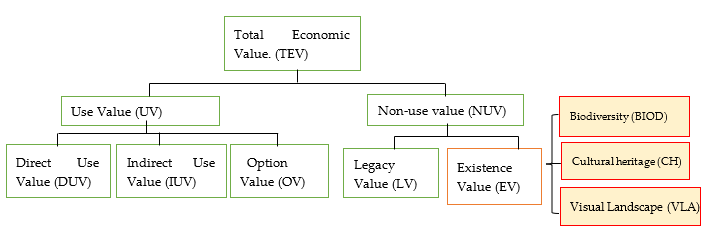
Fig. 6 - Diagram of the components of the Total Economic Value and the Subcomponents of the Existence Value
It is important to define component the VET
Use values a1)
DUV usually refer to the values derived from the goods that can be extracted, consumed or enjoyed directly. In this work, they correspond to the goods that involve the consumption of natural resources and have a market value (Estruch & Valles, 2017). In this case, the study considered agricultural production (potato, corn, alfalfa and vegetables), livestock, fishing and others that regulate the market.
IUV are derived mainly from the services produced by ecosystems (Estruch & Valles, 2017). For this work, the functions of the ecosystem linked to the stabilization and recreation of the geographic space of the Pacucha lagoon have been considered. So, the value captured lies in the presence of stored water that is useful as a food supply for flora species (cattails and other shrubs) and fauna (different species of birds, fish and others). Likewise, on the shores of the lagoon recreational activities such as cycling, hiking is practiced; and in the lagoon such as sport fishing, boat rides, swimming are some of the main recreational activities in this area.
OV It the one obtained by guaranteeing that in the future the benefits of an asset will be available or enjoyed, even if it is not currently being enjoyed (Garcia & Baldarrama, 2018). It is related to the importance assigned to maintaining the option of taking advantage of the value of resource use hydric in the future, even if it seems unimportant now.
Non-use values b1)
EV is the value of an asset as it is an essential resource for the conservation of tangible assets, such as flora or fauna or unique for the conservation of cultural values, landscapes, etc. (Garcia & Baldarrama, 2018). BIOD, CH and VLA. In this case, all the resources present in the Pacucha lagoon (species of plants, grasses, birds, fish and others).
VLA, also called inheritance value, is the value that an active to bequeath the benefits that it offers to future generations that have the opportunity to enjoy it (Garcia & Baldarrama, 2018).
Therefore, for the collection of information from the group of expert clusters, who are professionals with training in areas of environment, agronomy, agribusiness, tourism. who, in turn, have work experience and research with the area studied, Table 1 was used. In this way, the intensity of importance is expressed, using the scale of comparisons shown in Table 3 with their respective rating scales.
Therefore, for the collection of information, the paired comparison survey of table 1 was used to a cluster group of experts, whose profile are professionals with training in areas of environment, agronomy, agribusiness, tourism. who, in turn, have work and research experience with the area of study.
In this way, the intensity of importance is expressed, using the comparison scale shown in Table 3 with their respective rating scales.
Table 1 - Comparison between TEV components.
| Comparison | Scores |
|---|---|
| Direct use/indirect use values | / |
| Direct use/option, quasi-option values | / |
| Direct use/existence values | / |
| Direct use/bequest values | / |
| Indirect use/option, quasi-option values | / |
| Indirect use/existence values | / |
| Indirect use/bequest values | / |
| Option, quasi-option values/existence values | / |
| Option, quasi-option values/bequest values | / |
| Existence/bequest values | / |
Once the opinion of the experts has been collected, as described above. Consistency relationships (CR) are verified and the eigenvalues are calculated. Finally, the geometric mean of the eigenvalues is calculated to obtain the weights of the different components of VET and VE. For this study, the group of experts included representatives of the decentralized institutions of the Ministry of the Environment, Ministry of Agriculture, Production and Foreign Trade and Tourism of the Peruvian government. Likewise, the academic was considered as the researchers of the different higher-level institutions, which are detailed in Table 2.
Table 2 - Collective group surveyed
| N° | Participating institutions/ representatives |
|---|---|
| 5 | : Subregional Agricultural Directorate |
| 3 | : Sub Regional Production Directorate |
| 2 | : Chamber of Commerce, Industry and Tourism |
| 3 | : Foreign Trade and Tourism Directorate |
| 2 | : Pacucha District Local Economic Development Office |
| 3 | : Biologist, from the José María Arguedas National University |
| 2 | : Microbiologist, from the José María Arguedas National University |
| 3 | : Agroindustrial Engineer from the José María Arguedas National University |
| 2 | : Engineers in food industries from the José María Arguedas National University |
| 5 | : Agricultural Engineer from the Technological University of the Andes |
| 6 | : Engineer in Environmental and Natural Resources of the Technological University of the Andes |
| 3 | : Licensed Tourism and Hospitality from the ISTEPSA |
| 4 | : Representative of the Association of Fish Farmers of Pacucha |
| 3 | : Representative of the most important residents of the Pacucha District |
Analytic Hierarchy Process (AHP).
The AHP method (Saaty, 2008) updated by Aznar & Estruch (2015) allows a set of possible alternatives, to prioritize them, using the pairwise comparison between elements using a fundamental scale described in Table 1 in relation to Table 3, which allows to show the valuation variations in a quantitative way.
Table 3 - The fundamental scale for pairwise comparisons.
| Value | Verbal scale | Explicatión |
|---|---|---|
| 1 | Equal importance | Criterion A is just as important as criterion B |
| 3 | Moderate importance | Experience and judgment slightly favor criterion A over B |
| 5 | Strong importance | Experience and judgment strongly favor criterion A over B |
| 7 | Very strong importance | Criterion A is much more important than criterion B |
| 9 | Extreme importance | Extreme importance A over B.The evidence favouring one activity over another is of the highest possible order of affirmation |
2,4,6 y 8 Intermediate values between the above, when it is necessary to qualify
Reciprocal values of the previous ones in table 3 indicates the following: If alternative i has assigned one of the previous non-zero numbers, compared to activity j, then j has the reciprocal value compared to i. Comparing alternatives two by two according to a criterion and using the scale of the paired comparison table, we obtain square matrices; A = aij, which must comply with the properties of reciprocity, homogeneity and consistency (Aznar & Estruch, 2015).
The consistency of the paired comparison matrices of the survey to the collective group, is known through the consistency ratio and is calculated as follows:
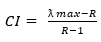
(1)
where R is the rank of the matrix. Knowing the Consistency Index, the Consistency Ratio (CR) is calculated as
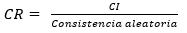
(2)
being the random consistency, for a matrix M5x5, equal to 1.11, CR ≦10 %, and for a matrix M3x3 equal to 0.52, CR ≦ 5% (Aznar & Estruch, 2015).
For the application of the AHP method, by means of non-probability sampling in the judgment of the researcher, a collective group of individuals with extensive knowledge of the asset to be valued was considered. A total of 46 people were considered, the selection criteria being representatives of the different sectors, whose institutional function and professional work is linked to the Pacucha lagoon. For this, the fundamental table of paired comparisons was used (see Table 3) with the group of selected local and external actors.
Rent asset update method
According to the analytical method, the value of an economic good is equal to the present value of the sum of the future rents or Earnings (Income-Expenses) that a good can generate for its owner.
In this way, the usual Value formula (V) is computed as follow:
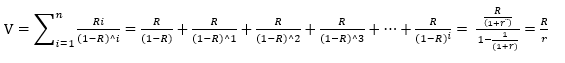
(3)
where,
V = |
Value of the environmental asset for its functions (DUV), |
Ri = |
Future income generated by the property in year i for its owner, |
r = |
Update rate that expresses the preference for money in the owner's time (Social Rate of temporary preference), |
n = |
Period during which the good will generate benefits. |
Pivot value calculation
As update rate (r), we will take the Social Discount Rate r = 3.77, calculated for Peru (Campos et al., 2016), calculated from the (Ramsey, 1928) formula (individual or pure time preference rate (0.88%); which represents the elasticity of the marginal utility curve of consumption.

(4)
Total Economic value (TEV) calculation and its related components.
The TEV is the sum of its partial components that are implicit in this evaluation. So, it approximates the real value of environmental assets.
Once the pivot value of equation (4) is known, the values for the other TEV components (IUV, OV, EV, LV) are estimated (Estruch & Valles, 2017). This is done by using the eigenvectors determined through the AHP method, so that the relative the weights of the TEV components are defined (see equations 5, 6, 7 and 8). The TEV of the environmental asset is determined by adding all the partial values (see equation 9). Thus the obtained value indicates the TEV of the environmental asset of the ecosystem service of the Pacucha lagoon. Then, the value of each component of existence value (biodiversity, cultural heritage and visual landscape) is derived from its weights and the known economic value (see equations 10,11 and 12).
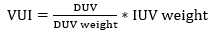
(5)
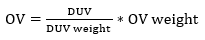
(6)
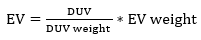
(7)
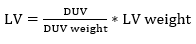
(8)

(9)

(10)
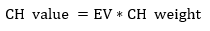
(11)
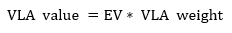
(12)
Results and discussion
In the present research, the valuation of environmental goods and services includes psychological connotations (hedonic, ethical, cultural, theological, among others) and from this, it supposes an improvement near the real value of the ecosystem for the processes of conservation, protection and sustainability of said asset.
Obtaining the values that compose the social value using AHP
According to the AHP methodology, the order of priority of the VET was obtained based on the value contributed by the interdisciplinary group of experts on the environmental assets of the Pacucha lagoon. To determine the relative weighting in each case, paired comparisons have been proposed in the questionnaire so that the 5X5 and 3X3 matrices are constructed according to the components whose results are reflected in table 4 respectively; After verification of their consistency, the eigenvectors and that are added by means of the geometric mean. The same ones that are contrasted by the criterion of reciprocity, homogeneity and consistency of all the respondents.
Table 4 - TEV eigenvectors and EV component eigenvectors
| N° | Total Economic Valuation | CR | Existence Value | CH | VLA. | CR | ||||
|---|---|---|---|---|---|---|---|---|---|---|
| DUV | IUV | OV | EV | LV | BIOD. | |||||
| 1 | 0.4685 | 0.2873 | 0.1248 | 0.0665 | 0.0530 | 8,84% | 0.6370 | 0.2583 | 0.1047 | 3,72% |
| 2 | 0.0472 | 0.1219 | 0.1902 | 0.5006 | 0.1401 | 9,94% | 0.6716 | 0.2654 | 0.0629 | 2,81% |
| 3 | 0.4673 | 0.2542 | 0.1627 | 0.0834 | 0.0324 | 9,47% | 0.2426 | 0.0879 | 0.6694 | 0,68% |
| 4 | 0.4265 | 0.3013 | 0.0843 | 0.1145 | 0.0734 | 6,03% | 0.1047 | 0.2583 | 0.6370 | 3,72% |
| 5 | 0.6076 | 0.0597 | 0.1481 | 0.1466 | 0.0381 | 9,87% | 0.1047 | 0.2583 | 0.6370 | 4,27% |
| 6 | 0.5489 | 0.0338 | 0.0983 | 0.2207 | 0.0983 | 9,35% | 0.6370 | 0.2583 | 0.1047 | 3,20% |
| 7 | 0.6134 | 0.1991 | 0.0362 | 0.0945 | 0.0567 | 8,46% | 0.1140 | 0.4806 | 0.4054 | 3,72% |
| 8 | 0.6243 | 0.1898 | 0.0966 | 0.0428 | 0.0465 | 6,24% | 0.6370 | 0.2583 | 0.1047 | 4,20% |
| 9 | 0.5744 | 0.1520 | 0.0388 | 0.0766 | 0.1581 | 8,88% | 0.6586 | 0.1562 | 0.1852 | 3,72% |
| 10 | 0.4357 | 0.0466 | 0.1511 | 0.1129 | 0.2536 | 7,95% | 0.6694 | 0.2426 | 0.0879 | 2,80% |
| 11 | 0.1293 | 0.0708 | 0.4266 | 0.0634 | 0.3098 | 8,34% | 0.1562 | 0.6586 | 0.1852 | 3,72% |
| 12 | 0.0373 | 0.0918 | 0.1464 | 0.2582 | 0.4663 | 7,35% | 0.7471 | 0.1194 | 0.1336 | 2,94% |
| 13 | 0.0507 | 0.0629 | 0.1524 | 0.3265 | 0.4075 | 8,37% | 0.6586 | 0.1562 | 0.1852 | 2,81% |
| 14 | 0.1532 | 0.0528 | 0.0889 | 0.2413 | 0.4638 | 5,58% | 0.1852 | 0.1562 | 0.6586 | 0,68% |
| 15 | 0.5281 | 0.2053 | 0.1409 | 0.0491 | 0.0766 | 7,14% | 0.7471 | 0.1194 | 0.1336 | 2,81% |
| 16 | 0.5260 | 0.2301 | 0.1082 | 0.0897 | 0.0460 | 8,78% | 0.7471 | 0.1194 | 0.1336 | 1,21% |
| 17 | 0.5176 | 0.2423 | 0.0286 | 0.1535 | 0.0580 | 8,76% | 0.6586 | 0.1562 | 0.1852 | 2,81% |
| 18 | 0.4622 | 0.2593 | 0.1375 | 0.0680 | 0.0730 | 7,32% | 0.6370 | 0.2583 | 0.1047 | 2,81% |
| 19 | 0.0928 | 0.1554 | 0.3357 | 0.3619 | 0.0542 | 7,00% | 0.7471 | 0.1194 | 0.1336 | 1,21% |
| 20 | 0.0569 | 0.0891 | 0.2316 | 0.1393 | 0.4831 | 9,42% | 0.6370 | 0.2583 | 0.1047 | 1,21% |
| 21 | 0.4938 | 0.0828 | 0.0464 | 0.1492 | 0.2277 | 9,73% | 0.1140 | 0.4054 | 0.4806 | 2,81% |
| 22 | 0.4543 | 0.1076 | 0.0483 | 0.3472 | 0.0426 | 9,10% | 0.6694 | 0.2426 | 0.0879 | 3,72% |
| 23 | 0.1503 | 0.0422 | 0.0993 | 0.2529 | 0.4553 | 8,65% | 0.4806 | 0.4054 | 0.1140 | 1,21% |
| 24 | 0.4438 | 0.2654 | 0.1523 | 0.0579 | 0.0806 | 7,59% | 0.1140 | 0.4054 | 0.4806 | 3,72% |
| 25 | 0.0512 | 0.1361 | 0.2281 | 0.4981 | 0.0865 | 9,15% | 0.2583 | 0.1047 | 0.6370 | 2,80% |
| 26 | 0.0478 | 0.1111 | 0.4775 | 0.2127 | 0.1510 | 9,09% | 0.6370 | 0.2583 | 0.1047 | 0,68% |
| 27 | 0.0531 | 0.0847 | 0.4959 | 0.1831 | 0.1831 | 9,17% | 0.6941 | 0.1315 | 0.1744 | 2,80% |
| 28 | 0.0361 | 0.1104 | 0.1238 | 0.2395 | 0.4903 | 9,18% | 0.7514 | 0.1782 | 0.0704 | 2,80% |
| 29 | 0.0251 | 0.0757 | 0.3912 | 0.2299 | 0.2781 | 6,36% | 0.0778 | 0.4869 | 0.4353 | 3,72% |
| 30 | 0.5469 | 0.0326 | 0.1559 | 0.0584 | 0.2063 | 7,61% | 0.6694 | 0.2426 | 0.0879 | 3,72% |
| 31 | 0.5325 | 0.2324 | 0.0700 | 0.1161 | 0.0490 | 3,36% | 0.6370 | 0.1047 | 0.2583 | 7,84% |
| 32 | 0.5257 | 0.2385 | 0.0302 | 0.1461 | 0.0594 | 3,75% | 0.6694 | 0.2426 | 0.0879 | 4,73% |
| 33 | 0.2864 | 0.5134 | 0.1109 | 0.0445 | 0.0448 | 8,57% | 0.6370 | 0.1047 | 0.2583 | 2,82% |
| 34 | 0.3603 | 0.3344 | 0.0689 | 0.0836 | 0.1528 | 9,52% | 0.7514 | 0.0704 | 0.1782 | 1,21% |
| 35 | 0.0502 | 0.0723 | 0.1996 | 0.1670 | 0.5109 | 9,45% | 0.0879 | 0.6694 | 0.2426 | 3,25% |
| 36 | 0.5117 | 0.2891 | 0.0999 | 0.0562 | 0.0431 | 9,52% | 0.6370 | 0.2583 | 0.1047 | 0,68% |
| 37 | 0.3233 | 0.3821 | 0.0991 | 0.0393 | 0.1562 | 9,28% | 0.7695 | 0.1265 | 0.1040 | 3,72% |
| 38 | 0.0502 | 0.1756 | 0.1052 | 0.3859 | 0.2831 | 9,51% | 0.4353 | 0.4869 | 0.0778 | 0,68% |
| 39 | 0.0507 | 0.0843 | 0.1755 | 0.1567 | 0.5329 | 7,29% | 0.4869 | 0.4353 | 0.0778 | 3,72% |
| 40 | 0.6277 | 0.1656 | 0.0420 | 0.0824 | 0.0824 | 9,79% | ---- | ---- | ---- | |
| 41 | 0.5173 | 0.1027 | 0.0610 | 0.1659 | 0.1532 | 9,64% | ---- | ---- | ---- | |
| G.M. | 0.2140 | 0.1319 | 0.1177 | 0.1323 | 0.1278 | 0.4151 | 0.2186 | 0.1738 |
The number of questionnaires carried out was to 46 people, of which 41 valid surveys have been used for VET and the others are not valid since CR presented greater than 10% and have been discarded. For EV, 39 valid questionaires were used, since the rest presented CR greater than 5% and have been discarded. On the other hand, it is stated that the weight of each expert is governed by ethical, cultural, and professional codes, among others. These ethical, cultural and professional codes are not the same for the whole set of experts, and as a consequence there are different points of view when weighing the different components that compose the TEV. Hence the importance of assigning the value of environmental assets not regulated by the market.
Valuation of direct use by using the income update method
The Pacucha lagoon is distinguished from other natural areas because the primary use of its natural resources is especially intense. We have defined the value of Direct Use as the economic value that environmental goods and services have, for the exploitation of their resources, for the satisfaction of human needs. The socioeconomic benefits are derived from agricultural activities, whose crops are detailed in table 5. Meanwhile, livestock activities are detailed in table 6 with the respective benefit generated. Likewise, table 7 shows the benefits generated by fishing activities in the lagoon and finally, table 8 details the economic benefits generated by recreational activity as a consequence of boating.
Table 5 - Cash flow from agricultural activity
| Agricultural activity | Incomes | Expenditures | Net Margin | N° Of Farm | Benefit ($/year) |
|---|---|---|---|---|---|
| Potato production | 2,182.14 | 2,119.14 | 63.00 | 610 | 38,430.86 |
| Corn production | 641.87 | 562.55 | 79.32 | 580 | 46,005.16 |
| Alfalfa production | 3,161.31 | 2,841.44 | 319.87 | 68 | 21,751.30 |
| Vegetables | 367.80 | 340.15 | 27.66 | 78 | 2,157.14 |
| Total | $ 108,344.46 | ||||
Note: for 2018, 2019 and 2020, the average production of potato crops has represented 35%, surpassed by corn production that represented 42%, alfalfa represented 20% and vegetables 2%, of the annual production campaign utility.
Table 6 - Cash flow from livestock activity
| Livestock activity | Incomes | Expenditures | Net Margin | N° unid/year | Benefit ($/año) |
|---|---|---|---|---|---|
| Cattle | 680.00 | 380.00 | 300.00 | 260 | 78,000.00 |
| Porcine-pig | 62.00 | 43.00 | 19.00 | 230 | 4,370.00 |
| Ovine | 40.00 | 27.00 | 13.00 | 117 | 1521.00 |
| Minor animals (guinea pig) | 7.00 | 3.00 | 4.00 | 1200 | 4,800.00 |
| Total | $ 88,691.00 | ||||
The table 6, indicates the order of utility generated in livestock activity, cattle represents 88%; of utility, pigs and smaller animals 5% and sheep 2%, respectively.
Table 7 - Cash flow from fishing
| Activity | Incomes | Expenditures | Net Margin | act./year | Benefit ($/year) |
| Artisanal fishing | 680 | 213 | 467 | 24 | $ 11,208.00 |
Note: Data about of fish catches in the Pacucha lagoon. It is worth mentioning that the activity is 7 months of capture and 5 months of closure included.
Table 8 - Cash flow from recreational activity on boats
| Activity | Incomes | Expenditures | Net Margin | Num of associations | Benefit ($/year) |
|---|---|---|---|---|---|
| Recreational activities (boats) | 7671.43 | 2959.38 | 4712.05 | 5 | $ 23,560.27 |
Nowadays, the recreational activity on boats in the Pacucha lagoon is an increasing demand on weekends and holidays. Families and groups of friends are the ones that demand the boat ride service the most. Thus, the sum of the productive activities (agricultural, livestock, fishing and recreation) achieved, as an economic benefit, reaches the sum of $ 231,803.73.
Result of the calculation of the total economic value of the Pacucha lagoon using the AMUVAM method
Known the DUV represents $ 231,803.73 as PIVOT value, and after the aggregation of the vectors of the geometric mean of the experts of each of the components of the TEV. Table 9 details the partial monetary values, the sum of which estimates the current total economic value of the assets of the Pacucha lagoon.
Table 9 - Total economic value of the Pacucha lagoon according to the aggregate weights assigned by the experts.
| TEV | Geometric mean | Aggregation | Final weighting | value US$ |
| DUV | 0.2140 | 0.2957 | 29.57% | 6,148,640.04 |
| IUV | 0.1319 | 0.1823 | 18.23% | 3,789,717.34 |
| OV | 0.1177 | 0.1626 | 16.26% | 3,381,738.35 |
| EV | 0.1323 | 0.1828 | 18.28% | 3,801,788.67 |
| LV | 0.1278 | 0.1766 | 17.66% | 3,671,572.41 |
| total | US$ 20,793,456.81 | |||
The five components of the VET valued in the previous table were calculated with the information supplied from the conglomerate of experts, which were validated by the random consistency ratio of less than 0.5%. The slight variation in the weighted weights of the asset components is due to the fact that the educational, spiritual, scientific, psychological and cultural conditions differ from one to the other of the surveyed persons.
Next, the relative weighing of the Existence value, according to Table 10, is known. The relative weighing according to the order of priority by the respondents is the biodiversity component, followed by cultural heritage and finally visual heritage. This is the value that experts assign to ecosystems and in particular to biological diversity for the mere existence and the possibility of maintaining them for future generations.
Table 10 - Components of Existence Value (EV)
| EV | Geometric mean | Aggregation | Final weighting | Value en US$ |
|---|---|---|---|---|
| Biodiversity | 0.4151 | 0.5141 | 51.41% | 1,954,455.89 |
| Cultural heritage | 0.2186 | 0.2707 | 27.07% | 1,029,027.81 |
| Visual Landscape | 0.1738 | 0.2152 | 21.52% | 818,304.97 |
| Total | 3,801,788.67 | |||
The components of the existence value reach the sum of US$ 3,801,788.67. Whose components were characterized with the following weighting, 51.41% of biodiversity, the valuation for cultural aspects represents 27%, and finally, the valuation for the enjoyment of the visual landscape is equivalent to 21.52%.
As for the economic valuation of natural resources of tangible and intangible assets, we have a series of research reports in different countries, By the way, this topic is not yet widely disseminated in Latin America. The study on the knowledge of the environmental situation of the ecosystem benefits of the Lagoon of the Padres wetland in Argentina, in this research allowed to express in economic terms an approximation that amounts to more than 138 million pesos / year (Iwan et al., 2017), an amount that is possibly undervalued, because the methodology used is not clearly defined the delimitation of the intrinsic and extrinsic factors by the experts. Meanwhile, in the present study for the Pacucha lagoon located in the Apurimac region, Peru; the experts valued US$ 176.20 per cubic meter, as the economic value of the water resource of this lagoon, but using the new multi-criteria valuation models.
On the other hand, Brenner et al., (2010) in their research, performed a spatial value transfer analysis to generate baseline estimates of the value of ecosystem services in the coastal zone of Catalonia, Spain. In this area, the surrounding ecosystems delivered to local citizens a substantial economic value of $3.195 billion dollars per year. Of the existing environments, beach and dune cover types provided the highest value per hectare ($104,146 USD/ha, year); and disturbance regulation was the most valued ecosystem service ($77,420 USD/ha, year). These results confirm the value of the regulatory function of transitional terrestrial and marine ecosystems in the coastal zone, which help provide other benefits to citizens. Likewise, the value of cultural ecosystem services should be considered in the analysis as it conveys a clear indication of the way ecosystems are interpreted by a culture and/or civilization peculiar in time and space. This is summed up in the idea that the economic value of cultural ecosystem services, expressed by myths, is their weight in cultural capital because myths summarize the vision, interpretation, symbols, attitudes and beliefs that humans attribute to nature. This implies that they convey the value that people give to the ecosystem. (Onofri & Boatto, 2020). On the other hand, Schuyt & Brander (2004), in its bibliographic review has prepared a synthesis where they report 200 studies on wetlands, whose economic value calculated on average is 3274 US$/ha per year. However, it does not specify the economic valuation of cultural services, historical and spiritual values or sediment control. These elements not considered in the valuation could have underestimated the real value of the natural resource studied (Estruch & Valles, 2017). According to other reports, the professional activity of each expert would influence the valuation of ecosystem services, there are those who guide the use of natural resources for socioeconomic use and others in a conservationist way, prioritizing the importance of the ecosystem regulation service (Gómez & Estruch, 2019). for these reasons, for the present research it was necessary to use the opinion of experts through a paired comparison survey, with which the vector of each of the components of the TEV is known, which, in addition, the consistencies of the opinion of each of the judges were compared with the consistency ratio scales to ensure coherence and veracity when assigning the value to the respective environmental asset.
The economic valuations of natural resources carried out in Peru, it is reported, the study on the estimated economic values of the ecosystem service of the water production of the Llancahue estuary reached between 11 and 25 US$ per m3; and amounting to a total amount of US$ 83,742,593 and US$ 190,324,075 (Núñez, 2004). Likewise, through the use of the contingent valuation methodology, they found US$ 320,580.78 the annual value of enjoying the Sausacocha lagoon in the La Libertad region. The economic values described above are methods based on declared preferences, and this type of valuation is based on the estimation of use values and can only measure the valuation of goods hindsight, once consumed, which does not allow estimating values for levels of quality that have not yet been experienced. Reason why, for the present study, these methodologies have not been considered, but rather it has incorporated all the variables or elements (so to speak) that encompass the pacucha lagoon ecosystem, which allow the decision-maker to have greater amplitude and clearly delimited by the factors that intervene in a valuation of environmental assets of the ecosystem of the lagoon studied. It is also important to note, for the present study it was necessary to know the pivot value, which was constituted by the direct use value that groups all the activities that are captured by the market; in this case, agricultural, livestock, fishing and boating activities were elementary to estimate this monetary value. Given that the people who live around and surrounding communities of the Pacucha lagoon, exercise their productive activity and is a source of food, economic and social development through the water resource of the lagoon; Not leaving aside the services generated for the preservation of the habitats of wild species such as plants, birds, trout cultivation and other ichthyological species; and as a regulatory service it is important to mitigate environmental changes, CO2 fixation and others.
Due to the complexity and disadvantages described in methods based on market values, methods based on revealed preferences and methods based on declared preferences of the methods reported by the authors cited in the valuation of the ecosystem, the International Standards of Economic Valuation recommend three large groups of methods for this analysis, the comparative method, the updating of revenues and cost. That is why, the AMUVAM methodology was adopted and applied to the present study, this method by grouping two techniques, the AHP and income update rate is characterized by the flexibility and speed with which the results are obtained, mainly in areas where there are no data or previous valuation studies. However, one of the limitations is that the people interviewed can only be experts, so this methodology does not integrate the participatory approach into the management processes. However, the estimation of the economic value of the environmental asset through the AMUVAM makes a true approximation to the economic value of the environmental asset, because the consistency ratio detects and discards the inconsistencies of the decision-maker when making judgments in the prioritization of the components of the VET (Azñar & Estruch, 2015). As can be seen in Table 4, five people were discarded in the assessment of the five components of the VET; while for the evaluation of VE, seven judges or decision-makers were discarded. In this way, the method used in the present research guarantees a much more reliable estimate of environmental economic value.
The study determined two important findings; First, the results showed the value of each component of the TEV according to Table 9, being the direct use value with the highest weighting, whose valuation amounts to 6,148,640.04 US dollars, which represents 29.57% of the TEV and with the lowest weighting is the option value and / or co-assistance with monetary value of 3,381,738.35 that represents 16.26%. Secondly, the results of the EV subcomponent were prioritized, with the biodiversity component being the highest weighting achieved with 51.41% and the lowest weighting obtained was visual landscape with 21.52%.
The prioritization of the existence value (EV) subcomponent of the Pacucha lagoon ecosystem, and according to Table 10, the biodiversity subcomponent is the most valued, followed by cultural heritage and visual landscape. This is the order that experts assigned, the enjoyment of the visual landscape is relatively relegated. This could be attributed to the fact that experts tend to have a greater link with the current biodiversity of Laguna de Pacucha. In the case of the environmental assessment of the vineyard in the municipality of Requena-Spain, the weighting, with 15% biodiversity, 35% to the landscape value and a population fixation of 50% (Peris, 2013). This weighting assumes that the people who valued this asset have a capitalist philosophy of using natural resources for socioeconomic and less environmental benefits. Likewise, in the evaluation and prioritization of the Lagoon of the Albufera in Valencia-Spain, they found a relative weight through the experts, where biodiversity represents 55%; 20% cultural heritage and 25% visual landscape (Aznar & Estruch, 2015), which can be understood by the impetus it promotes for the conservation and prevention of pollution or degradation of its waters. The same happened for Pacucha lagoon, since, in this place, ecosystem services are produced as a result of biodiversity and are complemented by cultural services, an attractive staging as a traditional activity of the Chanka culture and some festivals promoted by public entities of local and regional governments.
Conclusions
By calculating the total economic value of the environmental assets of the Pacucha lagoon, through the AMUVAM methodology, we feasibly approach the true value of its real importance of all the elements that group the ecosystem in this natural resource, because this method incorporates the produced good and ecosystem service generated that is naturally composed of different values, some of which are tangible and easily measurable, while others are intangible and difficult to quantify, but which are included through the Use Values (UV) and Non-Use Values (NUV) as presented in Figure 6. The prioritization of the components of the Total Economic Value for the Pacucha lagoon, allowed to characterize the degree of importance that was assigned between the use value and non-use value, being the direct use value of greater weighting compared to the rest of the components. As for the subcomponents of the Existence Value, biodiversity had the highest weighting with 51.41%, followed by cultural heritage and visual landscape 27.07% and 21.52% respectively. The pacucha lagoon is valuable as a source of food, socio-economic development, botanical and ethnobiological reserve for the Andahuaylas province, Peru, and having valued it in a monetary sense we consider contributing to the management processes in the public administration and the contribution to the design of policies and decision-making to improve its intervention and guarantee environmental sustainability.

