


Mi SciELO
 Servicios personalizados
Servicios Personalizados
Articulo
 texto en
  Inglés (pdf)
 Articulo en XML
 Referencias del artículo
 Enviar articulo por email
Indicadores
-
 Citado por SciELO
Links relacionados
-
 Similares en
SciELO
Similares en
SciELO
Compartir

 Permalink
Cooperativismo y Desarrollo
versión On-line ISSN 2310-340X
Coodes vol.10 no.3 Pinar del Río sept.-dic. 2022 Epub 25-Dic-2022
Original article
Pinero local development: Integral Development Program and Municipal Development Strategy
1 Centro de Estudios de Desarrollo Local y Comunitario (CEDEL). La Habana, Cuba.
2 Universidad de La Habana. Centro de Estudios de la Economía Cubana. La Habana, Cuba.
In Cuba, local development began in the 1980s and demonstrated its necessity as a viable alternative for the management of municipal development with the use of endogenous resources at the local level. Isla de la Juventud has an Integral Development Program that began its implementation in 2013 and a Local Development Strategy made in 2012, the latter conceived with the purpose of becoming the guiding instrument to lead the socioeconomic development process of the municipality. The development program, for its part, allowed the municipality one more option for managing development at the local level. Seven years later, both documents are out of date and are not very compatible with each other, leaving a local economy that does not reach levels of economic growth that will result in social welfare. This article deals with the socioeconomic situation that characterizes the municipality; therefore, the objective of this work was to analyze the socioeconomic effects of development programs and strategies in Isla de la Juventud. To achieve this objective, it was supported by theoretical and empirical methods that were useful in the documentary analysis used in the explanation of the essential relations, besides allowing the direct perception of the research object. Among the preliminary results, the socioeconomic diagnosis of the territory was obtained after the implementation of an integral development program that is not fulfilled every year and a municipal development strategy lacking elements that guarantee its purpose of generating local development.
Key words: local development; development strategies; integrated development program; indicators
Introduction
Local development in Cuba has become a public policy of strategic importance as part of the National Economic and Social Development Plan until 2030. Therefore, President Díaz-Canel Bermúdez (2021b) has explained that this strategy must flexibly combine the necessary planning relationship, decentralization and autonomy essential for territorial development, with the participation of all economic actors, including state enterprises, micro, small and medium-sized enterprises and cooperatives, as well as a central axis and articulator of the public agendas of the governments at the municipal and provincial levels.
Similarly, in analyses carried out by the Ministry of Economy and Planning of Cuba (2019), they have recognized that in the process of updating the Cuban economic and social model, it is required to promote the development of the territories based on the country's strategy, so that the municipalities are strengthened as a fundamental instance, with the necessary autonomy, sustainable, with a solid economic-productive, socio-cultural, institutional and environmental base, which should lead to the reduction of the main disproportions between them. Although this is what is conceived, there is no guarantee that the economic strength of each municipality will lead to the reduction of inequalities between them.
In this sense, the country's leadership chose the Special Municipality of Isla de la Juventud (MEIJ in Spanish), (in addition to other municipalities throughout the national territory in 2010) to elaborate and implement an Integral Development Program (PDI in Spanish) that would favor the management of territorial development. This decision was accompanied (although not with the same priority) by the elaboration of the Municipal Development Strategy, however, the assimilation of these new practices has been uneven both in time and in depth and capacity to concrete them, a reason that explains, at least in part, the inconsistencies that exist in territorial development planning and the scarce results that have been derived from them so far.
The Isla de la Juventud was a municipality that before the revolutionary triumph had an economy based mainly on the export of agricultural products, health tourism and industry. Under the influence of colonization in 1830, the first settlers arrived in the municipality and developed tobacco plantations. Coffee cultivation since colonial times is also related to the consumption needs of cattle ranchers who had to develop small plantations. The first news about this crop date back to 1833, with fifteen hundred plants of this crop, by 1850 it is not an exportable item, but it reached an extension of 4.2 land units dedicated to this production. Cattle raising, the production of pitch, tar and turpentine from pine resin were the first industries on the island, which began in 1792, while the extraction of marble began in 1827. In the first half of the 20th century, the exploitation of medicinal mineral waters, citriculture and forestry were added to the economic activities of the territory. In 1942 there were 42 cucumber harvesters, and melon, tomato, okra and chili peppers were exported, although to a lesser extent, among the producers were the Japanese settled on the island (Únger Pérez, 2016).
Since 1959, it has been treated differently from other municipalities in the country, which in institutional terms is expressed in the provincial nature of its business and governmental activities (Jané, 1988).
The search for sustainable growth and the sustained improvement of the social situation have been the purposes of the two Integral Development Programs1 and the two Municipal Development Strategies2, however, the socioeconomic situation of the territory has not shown substantial improvements; on the contrary, a gradual deterioration of its socioeconomic indicators has been evidenced which, at least in part, confirms the ineffectiveness of the local development management process.
This article will address the analysis of the socioeconomic effects of development programs and strategies in the Isla de la Juventud.
Materials and methods
In order to achieve the objective, the authors used the historical-logical method to learn about the evolution and development of development programs and strategies in the special municipality, which allowed the contextualization of the different theoretical elements that support the research.
The analytical-synthetic approach made it possible to accumulate information related to the theoretical and methodological foundations on local development (concepts, definitions, etc.), which support the use of programs and strategies to manage municipal development.
Among the empirical methods, documentary analysis was used to review and analyze the secondary documentation that allowed the appropriate analysis to discover the precise results, as well as the mathematical statistical method used to analyze graphs and statistical series.
Results and discussion
The Ministry of Economy and Planning (Mep in Spanish), in order to respond to the socioeconomic disproportions that have historically existed between the different regions of the country, uses (among other tools) the methodological indications it issues every year, declaring among the main objectives of territorial planning the gradual reduction of inequalities between Cuban municipalities, while ensuring a rational distribution of material, human and financial resources in order to achieve an adequate balance of economic efficiency and social equity at the local level.
This is the case of the Isla de la Juventud, where the Comprehensive Development Program (2013-2020) and the Municipal Development Strategy, two instruments, which at least in theory, start from the planning carried out to empower the public administration in the management of development towards better levels of economic-social welfare.
The Integral Development Programs of the Isla de la Juventud have set out a vision of the future, conceived on the basis of guaranteeing food security for the population, with the use of natural resources to stimulate industry and tourism, the development of infrastructure to create opportunities for local development, generating jobs, increasing services, improving the habitat through territorial and urban planning, responsible environmental management, institutional and community participation, guaranteeing the sustainability of territorial development (Peña Hijuelos et al., 1986).
Thus, the first antecedents of the development of the Isla de la Juventud can be traced back to the period from 1961 to 1974. In this period, the first specific tasks in the economic and social spheres began in the municipality, hence investments were made in the first two electricity generating units, the old ships were replaced by modern ones, three large combined plants were built: the meat plant, the bread plant and the one integrated by the ice factory and a soft drink factory, investments were also made in the construction materials industry, not to mention the social works concentrated mainly in the areas of health and education.
Already in the period 1975-1988 the socialist project was consolidated in the territory, seen through economic plans that sought to strengthen agricultural and industrial development, reaching 12 957 ha of citrus, 22, 4 caballerias of fruit trees, 50% destined to the papaya, coffee activity was restarted with average productions of 146 quintals per year, there were about 50 thousand head of cattle and poultry farming became another of the potential of the municipality (Colina la Rosa et al., 2011).
However, it was in the 1990s that the first economic and social development program was proposed, consisting of four subprograms: agriculture, industry, social works and the development of science and technology.
There was also an experience classified as academic research in the period 2005-2007 with the projection of a development program for the Isla de la Juventud based on the use of strategic foresight (with the construction of scenarios), despite this, the exercise did not go much further than the cross-impact matrix (Micmac) without leaving evidence that would take advantage of the results obtained up to that point.
In 2012, as part of the national policy, the second PDI was prepared with three prioritized axes: agriculture, industry and tourism; two years later, in 2014, the Economic-Financial Commission with Agreement 1362 guided readjusting investments due to the non-compliance of several factors.
The historical evolution of development programs in the Isla de la Juventud municipality has been lacking in analysis due to the absence of a monitoring and evaluation system/team that would allow national and local management to determine what the effect of this instrument has been on the socioeconomic variables of the territory. All have been characterized by substantial investments that have not produced the expected results in terms of economic impact.
On the other hand, during the same period of preparation and implementation of the second PDI, the Municipal Development Strategy (EDM in Spanish) was prepared for the first time, within the framework of a project for Strengthening Municipal Capacities for Local Development (Prodel), which selected some municipalities to train them in their preparation; at that time, work was carried out with specialists from the Center for Local and Community Development Studies and the National Institute of Economic Research.
The EDM of 2012 was conceived with a view to raising its productive levels, following the idea put forward in the Guidelines of the Economic and Social Policy of the Party and the Revolution in 2011, to optimize natural and social resources. The aim was to create a local productive base to produce material goods that would make possible the satisfaction of food needs, the substitution of imports and the contribution to the country's economy.
The second EDM arose from the indication issued by the Mep in 2018 through the methodological guidelines for the preparation of the 2019 plan; likewise, as part of the same, a guide was approved to prepare or update (as the case may be) the strategy. In the case of the Pinero municipality, the 2012 EDM was updated. So far, the fundamental components have been updated3 and the prioritized lines are: L1. Food production, L2. Capacity building and communication, L3. Local industry, L4. Identity and sense of belonging, L5. Local tourism. As part of the governmental visits, this process was accelerated and the EDM was approved in March/2021.
It is worth mentioning that in neither of the two cases have local development projects been carried out that demonstrate the implementation of the EDM, the first was only a written document to comply with a directive and the second is being perfected without materializing during this process (which has already been underway for two years) any project born from the identified potentialities.
Thus, according to the Territorial Policy approved in 2020 and Decree No. 33 for the strategic management of territorial development, it is established that in order to materialize the strategies, development programs must be prepared for each strategic line and public policies that make it possible to implement the local development projects that make up each of the programs. Isla de la Juventud has only had one local development project in 2016, a sweet cookie factory, for which the territory must import all the raw materials.
What has been the development of the Isla de la Juventud, after the approval of the PDI-EDM?
To approach the effectiveness of the PDIs, the comparison of goals and results of some of the decisive productions that appear in the PDIs, as well as indicators of food consumption4 and sociodemographic behaviors, will be taken as variables.
The study of socio-economic indicators speaks about the health of this territory economy, the productions planned in the PDI will be examined, contrasting them with the values that appear in the yearbooks of the municipality that would come to be the results of the implementation of the development program.
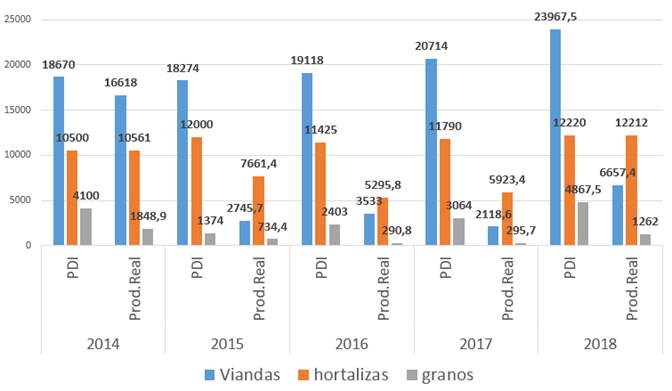
Graph 1 shows the actual production behaviors for the years 2014-2018. If it is assumed that the productive results constitute one of the elements to evaluate the effectiveness in the design, goal setting and execution of the PDIs, then we have that:
In all cases, viands production was significantly below (32%) of the targets set
The same occurred in grain production (compliance with the plan was between 45% and 12%)
Vegetable production was the closest (94 %) to the pre-established goals
 Source: Taken from PDI MEIJ and Statistical Yearbook MEIJ 2018
Graph 1 Behavior of the relationship between planned productions PDI/Real Yearbook MEIJ (MU: t)
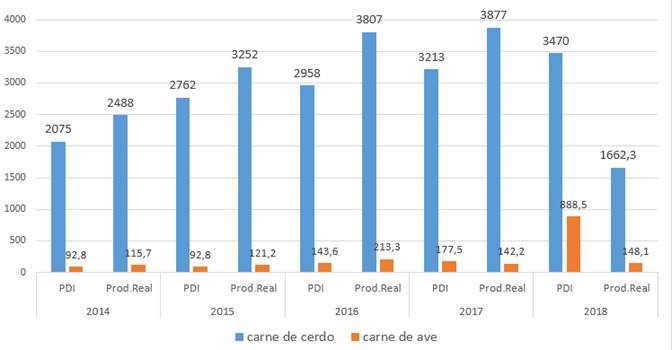
Graph 2 describes the performance of pork and poultry production with respect to what was planned in the development program. Pork production benefited from the decision in 2014 to create Gelma (Empresa de Logística para producciones agropecuarias) as part of an experiment that guaranteed about 80% of the animal feed to pig farmers.
This led to an increase in the number of farmers engaged in this activity and, of course, to an increase in pork production, to the point that the PDI plan was met at an average of 106.1% during the period under study.
Poultry meat production (which is one of the potentialities of the municipality) although it had an average overcompliance in the first three years of 34.6%; in the period 2017-2018, it experienced a substantial decrease and met its productions at 48.3% with respect to what was planned.
 Source: Taken from PDI MEIJ and Yearbook MEIJ 2018
Graph 2 Behavior of productions (pork-poultry) PDI/Real Yearbook MEIJ (MU: t)
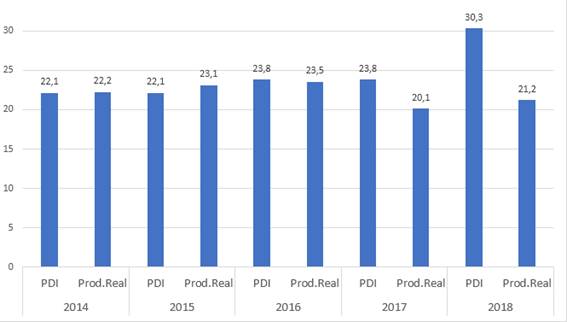
Likewise, egg production (Graph 3) had a similar behavior to poultry meat and in the first three years exceeded the plan by 117.1% on average, but in 2017-2018 it exceeded 77.1% of what was planned in the PDI, mainly as a result of the shortage of feed, caused by the reduction of inputs from Gelma and farmers had to produce the food for their animals.
Analysis of the behavior of some food consumption indicators
In the process of preparing the plan, the indicators established by the Ministry of Public Health, expressed in a unit of measurement that is easily understood by the entire population, should be used as a basis for calculation; a per capita consumption per inhabitant of 14 kilograms per month is recommended, with the following structure of products by generics.
Table 1 Consumption rates recommended by Public Health by product type
| Product | Per capita | |
|---|---|---|
| kg | pounds | |
| Viands | 7.0 | 15.0 |
| Vegetables | 4.6 | 10.0 |
| Grains | 1.0 | 2.0 |
| Fruit trees | 1.4 | 3.0 |
| Total | 14.0 | 30.0 |
Source: Methodological indications for the preparation of the 2018 plan
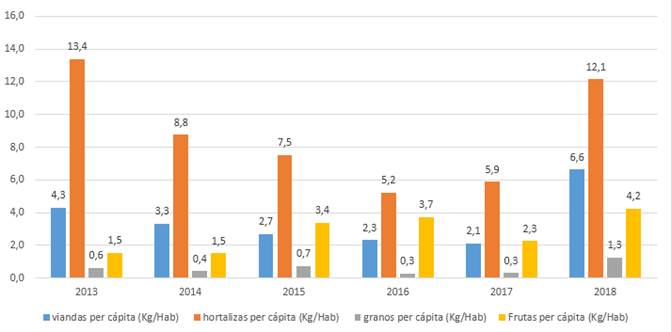
On the Isla de la Juventud (Graph 4), the recommended Consumption Index (CI) for viands is not met. According to the reported productions, this index behaves between 4.3 and 6.6 kg/inhabitant per month with respect to the recommended 7 kg/inhabitant and the CI for grains was between 0.6 and 1.3 kg/inhabitant in relation to the 1 kg/inhabitant established by the plan. Vegetable productions have a different situation, a CI of 4 kg/inhabitant per plan is established and annual productions have exceeded them, being between 13.4 and 12.1 kg/inhabitant; fruit productions have a similar situation with productions that represent a per capita between 1.5 and 4.2 kg/inhabitant.
 Source: Calculations based on figures from the 2018 Statistical Yearbook, Isla de la Juventud
Graph 4 Behavior of per capita production of MEIJ viands, grains, vegetables and fruit
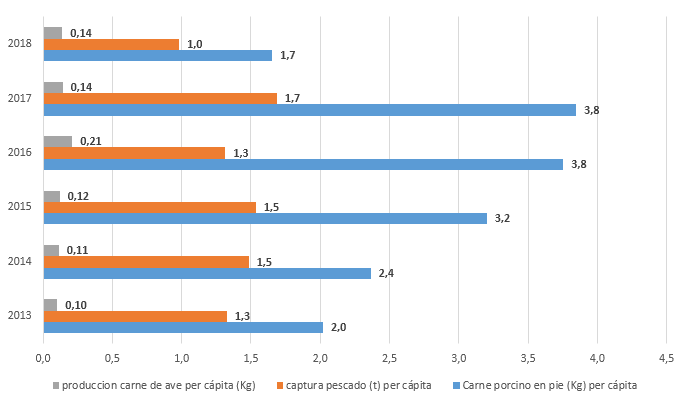
The information in graph 5 shows the per capita productions of pork, poultry and fish5; the calculated figures show that, even if the total of these productions were destined to the local market, the recommended consumption indexes, which are oriented in the national food security program of 5 kg, would not be met.
In the case of pork production (during the five-year period analyzed), the number of pig farmers and production has decreased, which has led to a significant increase in prices. From 2013 to 2017, the standing price of pork was quoted at 11 cup/lb standing, while consumption maintained an upward behavior, going from 2.0 to 3.8 kg/inhabitant and then decreasing, going from 3.8 kg/inhabitant to 1.7 kg/inhabitant at the end of 2018.
Poultry production per capita does not exceed kg/inhabitant with a rather discreet growing behavior, going from 0.1 kg/inhabitant to 0.14 kg/inhabitant at the end of 2018.
The fish catch shows a stable and discrete growth. The per capita catch ranges between 1.3 kg/inhabitant and 1.7 kg/inhabitant, but as mentioned above, not all of this production goes to the population; part of it is exported.
Analysis of socio-demographic indicators
Graph 6 shows the population behavior of the municipality in the period 2013-2018, which experienced an average population decrease of 3.8% from 84,776 inhabitants to 83,801 at the end of 2018.
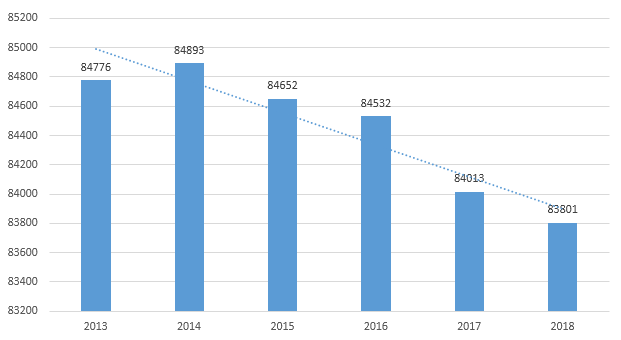 Source: Statistical Yearbook 2018 Isla de la Juventud
Graph 6 Behavior of the number of inhabitants MEIJ
The decrease in population has been accompanied by an increase in the aging rate (Graph 7), which has ranged between 18% and 18.6%. At the end of the period analyzed, the situation presented by these two indicators makes the management of local development complex, since it requires (among other things) a labor force to produce goods and services that have an incidence on growth of the territory's market production.
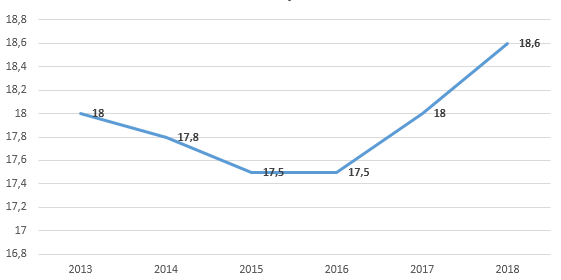
On the other hand, closely related to the aging rate, it is worth analyzing the age dependency ratio, which represents the pressure on people of working age, those who are not yet old enough to work and those who are no longer old enough to work.
The dependency indicator (ADR)6 in the territory has an upward behavior and went from 509 persons per thousand in 2013 to 547 per thousand in 2018 (Onei, 2018). This behavior is explained because the aging rate increases, the population decreases and there is a negative migratory balance (Graph 8).
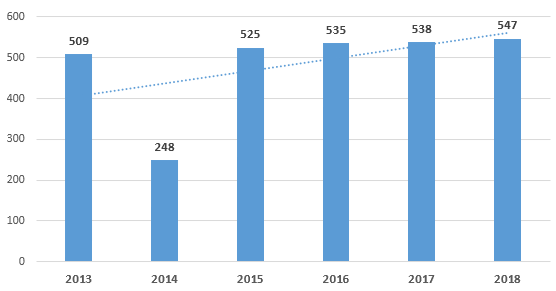 Source: Statistical Yearbook 2018 Isla de la Juventud
Graph 8 Behavior of the age dependency ratio indicator MEIJ
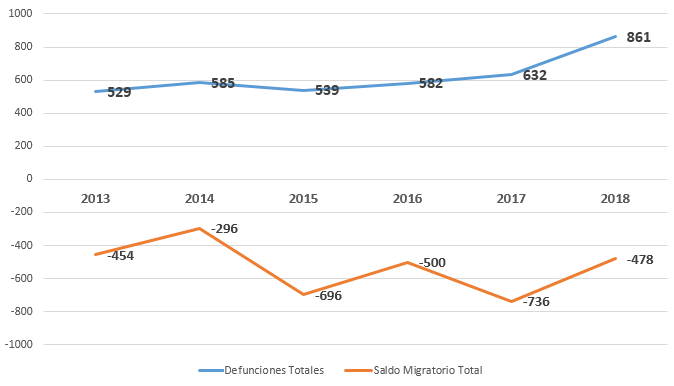
To support the above approach, grahp 9 reflects the number of deaths and the migration balance from 2013-2018. The figures for the number of deaths increase each year. At the beginning of the stage there were 529 deaths with an increase in absolute value of 332 people at the end of 2018, which represented a growth of 161.7% at the end of the period.
On its part, the migration values of the island show the existence of a negative migratory balance that oscillated between 454 and 478 persons per year, although the average in the six years of study was 527 persons. Going deeper into this, it can be said that people of working age tend to leave the municipality, which is supported by the percentage decrease experienced by the population between 15-59 years of age. In 2013 this age range represented 66.3% of the total population and at the end of 2018 it decreased to 64.6%.
 Source: Statistical Yearbook 2018 Isla de la Juventud
Graph 9 Behavior of the number of deaths and migratory balance MEIJ
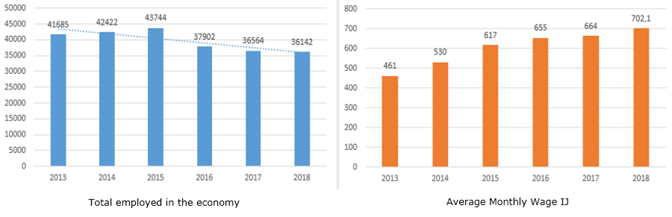
Graph 10 shows the evolution of employment between 2013 and 2018. The behavior expresses a decreasing trend, fluctuating between 41 685 and 36 141 employed, with an average absolute frequency in the period analyzed of 1 109, which represented a decrease of 2.63 % on average in the stage studied. Wages, on the other hand, experienced a discreet growth of 8.9% for the same period, while in absolute values, on average, they grew by 48 CUP, from 461 CUP to 702.1 CUP. These figures are among the lowest at the national level, a reason that also reveals the exodus of professionals from the territory.
To promote better management of local development
Today it is not possible to see territorial development as something separate, outside the context of the effort to achieve better government management at all levels. In this sense, the Science and Innovation-based Government Management System (SGGCI in Spanish) proposes:
The territorial dimension (T) is fundamental. As opposed to the preferably sectorial, vertical approach, based on the supply of research results whose target is usually assumed to be, above all, the so-called technology-based companies, local, territorial development is assumed to be a privileged component of the SGGCI. Local development demands knowledge management and innovation processes with intersectoral, transdisciplinary visions, which favor the production, dissemination and use of knowledge, adjusted to the local needs of these areas. It is essential to mobilize territorial creativity associated with "situated knowledge" (Díaz-Canel Bermúdez, 2021a).
It also defines a group of actions that the territorial component of the SGGCI must carry out (Díaz-Canel Bermúdez, 2021a):
Strengthen the government-university-local stakeholders nexus to generate innovative dynamics in the territories
Strengthen the role of the Cum (University Municipal Centers) as actors in knowledge management and innovation for local development
Strengthen training processes in the Cum, including university graduates in key programs for local development, such as food and housing
Boost the training of local managers
Boost local innovation systems that support local development projects that contribute to the strategic lines of the municipal development strategy
Promote intersectoriality and multilevel dialogue
In addition, there is a favorable institutional context, where the complete regulatory framework has been approved, consisting of:
Mep: Territorial Policy to Promote Local Development
Decree 33/2021 for the strategic management of territorial development
Resolution No. 29/2021: general bases of the organization of the working system for the strategic management of territorial development, as well as the management of local development financing
Ministry of Finance and Prices: Resolution No. 114/2021: Budgetary financing of territorial development, tax treatment of prices and accounting of territorial development projects
Central Bank of Cuba: Resolution 147/2021 establishes the procedure for financing local development projects
The policy defines local development as an essentially endogenous, participatory, innovative and innovative process of articulation of interests between actors, territories and scales and establishes that the Municipal Administration Council should promote integration between state and non-state actors on the basis of productive linkages, with emphasis on strategic economic sectors and territorial priorities, as well as evaluate the feasibility and approve local development projects, which will operate independently (Díaz-Canel Bermúdez & Delgado Fernández, 2021, p. 8).
The policy and then the norms also establish ways to solve one of the bottlenecks of local development, that of financing. In this regard, they establish the following as sources (Council of Ministers of the Republic of Cuba, 2021).
Territorial contribution for local development, funds for local development projects, National Fund for Environment, National Fund for Forestry Development, National Fund for Science, Innovation and Technology Development and other budgetary sources
International cooperation, foreign direct investment, own sources from different forms of ownership and other external sources
Any other lawful source in accordance with current legislation
It is also true that it is something relatively new and challenging, among other things, because there is a lack of culture and tradition of handling local development issues in this way, but also because achieving an adequate balance between the commitments with the National Economic and Social Development Program and the municipal development strategy is an exercise rarely practiced7, also because it will depend a lot on the quality of these development strategies, something that is still a subject in learning.
The greatest challenges in the management of local development do not depend on material or financial resources, but on the coherence of public policies, the skills of public servants, the existence and/or formation of capable teams8, the quality of leadership and the capacity of this leadership to promote the real participation of citizens in the design, implementation, control and evaluation of the strategy (Campos Alfonso, 2011).
The work analyzed some socioeconomic indicators to explain the situation prevailing in the municipality after the implementation of the PDI (2014-2018) and elaboration of the EDM. In this sense, it can be said:
The PDI and EDM that have been prepared at different times have repeated the same objectives over and over again, which is difficult to understand given the changes that have taken place in the municipality during this period (for better or worse) and also the change in the national context
There has been a lack of a correct socioeconomic diagnosis, and there has been no evidence of coherence between development programs and strategies as instruments for conceiving territorial development
In relation to the measurement of the effect of the PDIs on the economy, it was identified that there is no system/team that has this as one of its functions
During the five-year period 2014-2018, the actual results in terms of production have not been in line with those planned, and the PDI has not been met every year
The production of viands, vegetables, grains and fruits on the Isla de la Juventud does not meet the per capita consumption rates recommended by the Ministry of Public Health
The demographic indicators of the municipality in the period 2013-2018 reflected the decreasing trend of the population, increase in deaths, increase in the aging rate, a sustained negative migratory balance and all as a whole influence on the increase of the age dependency ratio indicator
Meat production (pork, poultry and fish) in the municipality does not guarantee the per capita levels established in the national food security program
The total number of employed persons in the period 2014-2018 showed a decreasing trend, but not the average monthly salary, which experienced a discreet increase that places it among the lowest at the national level
The absence of the population's criteria and the almost null participation of scientific centers result in a lack of scientificity and objectivity in local development planning
REFERENCES
Campos Alfonso, J. M. (2011). Cuba frente al desarrollo local: Consideraciones teórico-metodológicas y reflexiones para su aplicación. Revista Economía y Desarrollo, 146(2), 19-41. http://www.econdesarrollo.uh.cu/index.php/RED/article/view/297 [ Links ]
Colina la Rosa, J., Campos Brito, I. M., Sánchez Guerra, J. C., Gort, S. A., Ramírez Ramos, N., Vives Pérez, M., Quintana Veiga, J. A., & González Leyva, Y. (2011). Síntesis histórica municipal: Isla de la Juventud. Ediciones El Abra. https://www.worldcat.org/title/sintesis-historica-municipal-isla-de-la-juventud/oclc/859153566 [ Links ]
Consejo de Ministros de la República de Cuba. (2021). Decreto 33 Para la gestión estratégica del desarrollo territorial. Gaceta Oficial de la República de Cuba, Edición Ordinaria No. 40. https://www.gacetaoficial.gob.cu/es/decreto-33-de-2021-de-consejo-de-ministros [ Links ]
Díaz-Canel Bermúdez, M. (2021a). ¿Por qué necesitamos un sistema de gestión del Gobierno basado en ciencia e innovación? Anales de la Academia de Ciencias de Cuba, 11(1), e1000. http://revistaccuba.sld.cu/index.php/revacc/article/view/1000 [ Links ]
Díaz-Canel Bermúdez, M. (2021b, abril 19). Discurso pronunciado por Miguel Mario Díaz-Canel Bermúdez, Primer Secretario del Comité Central del Partido Comunista de Cuba y Presidente de la República de Cuba, en la clausura del Octavo Congreso del Partido. Presidencia de Cuba. https://www.presidencia.gob.cu/es/presidencia/intervenciones/discurso-pronunciado-por-miguel-mario-diaz-canel-bermudez-primer-secretario-del-comite-central-del-partido-comunista-de-cuba-y-presidente-de-la-republica-de-cuba-en-la-clausura-del-octavo-congreso-del-partido/ [ Links ]
Díaz-Canel Bermúdez, M., & Delgado Fernández, M. (2021). Gestión del gobierno orientado a la innovación: Contexto y caracterización del modelo. Revista Universidad y Sociedad, 13(1), 6-16. http://scielo.sld.cu/scielo.php?script=sci_abstract&pid=S2218-36202021000100006&lng=es&nrm=iso&tlng=es [ Links ]
Jané, P. (1988). Isla de la Juventud informe de Rendición de Cuenta a la Asamblea Nacional del Poder Popular (La realidad de un sueño). Ediciones Plaza Vieja. https://www.worldcat.org/title/1011182806 [ Links ]
Mep. (2019). Indicaciones metodológicas para la elaboración del Plan 2020. Ministerio de Economía y Planificación de Cuba. https://www.mep.gob.cu/es/documento/methodological-guidelines-preparation-2020-plan [ Links ]
Onei. (2018). Anuario Estadístico Isla de la Juventud 2017. Oficina Nacional de Estadística e Información. [ Links ]
Peña Hijuelos, W., González Valenzuela, B., Colina la Rosa, J., Núñez Jauma, R., & Pérez Milham, R. (1986). Con todo derecho: Isla de la Juventud. Monografía. http://www.worldcat.org/es/title/50595147 [ Links ]
Únger Pérez, R. (2016). La Isla de los Pinos Nuevos. Ediciones El Abra. [ Links ]
2The first in 2012 and the second in March 2020 (an improvement process was approved and started in May).
3The vision, barriers and potential of the territory, strategic allies, sources of financing, work commissions for each line, as well as the prioritized axes, which in relation to the 2012 version, L5. Local tourism was incorporated.
4As part of the directives of the (Mep, 2019) the plan of municipal self-sufficiency of agricultural products is one of the components of the Territorial Plan of the Economy and the Municipal Development Strategy, its main objective is to ensure the needs of these products, progressively, in all municipalities of the country that have a minimum agricultural area, which is in correspondence with the population and per capita approved.
5The per capita figures do not represent real consumption, since they do not take into account the differences associated with the income of each family/individual. As is known, part of the production goes to other destinations and is not part of the real supply to families/individuals.
Received: July 18, 2022; Accepted: October 27, 2022

