


 Servicios personalizados
 Inglés (pdf)
 Articulo en XML
 Referencias del artículo
 Enviar articulo por email
 Citado por SciELO
  Similares en
SciELO
Similares en
SciELO 
 Permalink
Introduction
A renewable energy hybrid system is an electrical system that uses multiple power sources, at least one of which is renewable. The hybrid energy system may incorporate a storage device and therefore can function independently or in conjunction with the grid [1, 2]. Because of its ease of availability and environmental benefits, solar energy is widely advocated across the world as a viable alternative source of power to fossil fuels. Solar photovoltaic applications offer potential alternate alternatives to power delivery in most metropolitan settings, where energy demand dominates.
Research on hybrid power systems based on renewable sources started about 30 years ago. Although the first publications were published in the mid-1980s [3], the research on hybrid systems did not flourish until the early 1990s [4]. The publications dedicated to photovoltaic hybrid systems with conventional sources, present the results from existing and installed systems [5, 6], while others examine the possibility of adding photovoltaic panels as a source of additional energy in existing conventional source installations [7, 8]. Other authors conducted theoretical studies on the analysis of processes taking place within the system [9, 10], the optimization of the hybrid system design [11, 12], or the energy management strategy [13]. The purpose of this research was to answer the following question: are hybrid systems technically, commercially, and ecologically viable in contrast to the conventional diesel solution alone for supplying a certain isolated location in Algeria? If so, how effective are these systems? Our goal is to address the aforementioned questions using a technique and a plan.
Description of system analysis
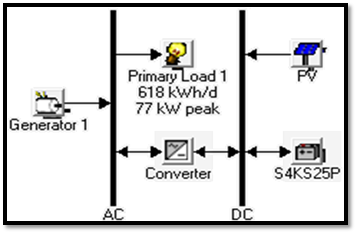
The simulated system includes the following components (figure 1): a solar generator, a diesel generator, a storage system, a converter, and an electrical load. We chose the parallel design for this study because it provides greater benefits than other configurations [14, 15], in which the system operates in standalone mode and must produce an average load of 618Wh/d with a peak of 77kW.
Methodology
It is critical to developing a process to achieve conclusive outcomes. We took the following actions in our case:
Display of the hybrid system installation location.
Assessment of the available energy sources in the location.
Demand for energy assessment (the load profile).
Manual equipment pre-sizing
Enter the required information.
Begin the computation and examine the findings.
a) Presentation of the hybrid system installation site
Table 1, summarizes the site's geographical features.
Table 1 Geographical features of the location
| City | Longitude | Latitude | Optimum angle for PV panels | Optimal orientation for PV panels |
|---|---|---|---|---|
| Sidi Bel Abbes | 0° 38’ W | 35° 11’ N | 45 | South |
b) Evaluation of the site's available energy source
To obtain solar radiation data, just input the required location's longitude and latitude, connect the software to the radiation data source, and click the acquire data through the internet icon. The sun radiation values for the research region are shown in figure 2.
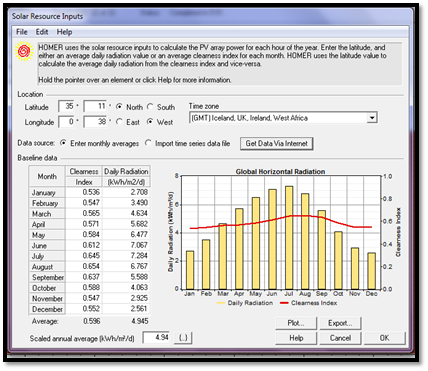
It can be shown that the radiation fluctuates between 2.561 kWh/m2/day in December and 7.28 kWh/m2/day in July, with an annual average of 4.94 kWh/m2/day. It should also be mentioned that the maximum radiation values are found from April to September, while the lowest values are observed from October to February.
According to figure 2, the monthly clarity index ranges from 0.536 in January (rainy season) to 0.654 in August (dry season), with an annual clarity index of 0.596. The following solar radiation parameters are used for the pre-sizing step:
Solar radiation of the least sunny month: 2.56 kWh/m2/day
Annual average of the solar radiation: 4.94 kWh/m2/day
c) Demand for energy assessment (the load profile)
The characteristics of the load make it possible to specify the type of application, connected to the network, off-grid and pumping water [16]. The application in our case study is off-grid (isolated site). The goal is to provide a rural hamlet with a HES (Hybrid Power System) for the generation of power. To make things simpler, we imported a file database to display the load profile (figure 3).
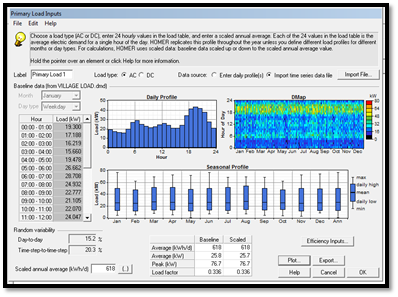
According to figure 3, this is a load with an annual value of 618 kWh/day and an instantaneous power peak of 76.7 kW. For the next step (pre-sizing), we need to calculate the average daily consumption per month (kWh/day). This data is not available in the HOMER software, but the file used for the load profile can be exported as an Excel file. The exported file contains 8760 values; each value represents the average hourly consumption for the 365 days of the year (24 × 365 = 8760). After data processing we obtained the results shown in figure 4.
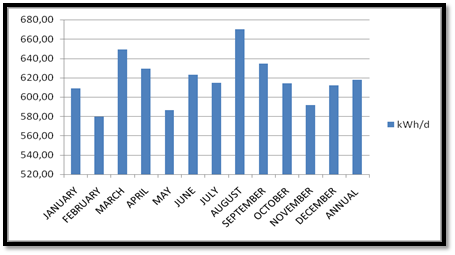
It can be seen that the highest consumption is recorded in August with a value of 670.05kWh/day. To summarize, the following values were utilized for the next step:
Highest monthly consumption: 670 kWh / day
Average annual consumption: 618 kWh / day
Peak instantaneous power: 77 kW
d) Manual equipment pre-sizing
Pre-sizing is a basic computation based on particular knowledge that looks for an order of scale of the system's size; it is also a method of confirming the findings given by the HOMER program.
d.1) PV Generator Sizing
For the sizing of the PV panels field, two equations are needed [17]. The relation between solar radiation and the equivalent number of hours is given by the following equation (1):
With:
E sol |
solar radiation (Wh/m2/days) |
N e |
number of hours of sunshine equivalent (h/days) |
1000 |
optimal sunshine (W/m2) |
The relationship between energy demand and crest power is given by the following equation (2):
From the two equations cited above, one can find the power of the necessary panels by the following equation (3):
 (3)
(3)
So you just have to use the metrological data (step 2) and the energy demand data (step 3) to calculate the power of the panels. For systems with a battery bank, the coefficient C p is generally between 0.55 and 0.75 [17]. The approximate value used for battery systems will often be 0.65.
As a result of the design, several crest power values can be obtained, as shown in table 2:
Table 2 PV generator power obtained after pre-sizing
| Energy demand | |||
|---|---|---|---|
| Max (670 kwh/d) | Average (618 kwh/d) | ||
| Radiation Solar | Min (2.56kWh/ m2/d) | Pc=403 kW | Pc=371 kW |
| Average(4.94kWh/m2/d) | Pc=209 kW | Pc=192 kW | |
These values are interesting to obtain an interval of possibilities. It is therefore suggested to use these values as entries in HOMER, adding other mediating values and zero to be in the case of diesel alone. The system voltage can be determined. The latter depends on several parameters: type of application; total power of the photovoltaic system; availability of materials and the geographical extension of the system. The recommended voltage according to the size of the system is given in table 3 [17]:
Table 3 PV generator power obtained
| Power of the PV field [W] | 0-0.5 | 500 - 2 | 2-10 | >10 |
| Recommended voltage [V] | 12 | 24 | 48 | > 48 |
So the system voltage should be at least 48 V.
The regulator is sized according to the nominal voltage and the maximum current delivered by the solar panels. The maximum current I m required is given by the following equation (4):
 (4)
(4)
d. 2) Batteries Sizing
The pre-sizing of the accumulators is also decisive. The batteries are generally defined in Ah, so we use the daily needs, B j , in Ah/days, who is given by the following equation (5), [17, 18]:
 (5)
(5)
Then the capacity of the batteries is calculated taking into account the reduction coefficients as described in equation (6) [17, 18, 19]:
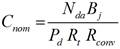 (6)
(6)
With:
C nom |
nominal capacity; |
N da |
number of days of autonomy (the number of days likely to be without solar energy input); |
P d |
depth of discharge; |
R t |
reducing coefficient that takes into account the effect of temperature (low temperatures are harmful to batteries [19]); |
R conv |
converter efficiency. |
The pre-sizing details of the batteries are summarized in the following table 4:
Table 4 Pre-sizing details of the batteries
| Eelec (kWh/day) | 618 | ||||
| VDC (V) | 48 | ||||
| Bj (kAh/d) | 13 | ||||
| Selected battery capacity (Ah) | 1900 | ||||
| Battery voltage chooses (V) | 4 | ||||
| Pd | 0.6 | ||||
| Rconv | 0.9 | ||||
| Rt | 0.85 | ||||
| Number of days of autonomy | 1 | 2 | 3 | 4 | 5 |
| Total Capacity (kAh) | 28.05 | 56.1 | 84.15 | 112.2 | 140.25 |
| Total number of batteries | 15 | 30 | 44 | 59 | 74 |
| Number of series batteries | 12 | ||||
| Number of parallels batteries | 2 | 3 | 4 | 5 | 7 |
| Total number of batteries revised | 24 | 36 | 48 | 60 | 84 |
| Revised Total Capacity (kAh) | 45.60 | 68.40 | 91.20 | 114.00 | 159.60 |
d.3) Sizing of other Equipment
The regulator, the converter and the cabling can also be sized for a better approximation of costs. The sizing of other accessory equipment (lightning protectors, fuses, circuit breakers and others) is superfluous for a macroscopic study.
The regulator must be included in the costs of solar panels as well as the cabling and other necessary supplies. The regulator and the cabling can be sized according to [17, 18], and their associated costs are thus estimated.
d.4) Converter Sizing
For the inputs of the software, only one parameter is needed which is the maximum output power of the converter which must be higher than the maximum power demanded by the consumers (peak of the instantaneous power).
To ensure the parallel operation of the system, the converter used for our application is bidirectional and will be sized by the following equation (7), [20, 21]:
P max |
maximum instantaneous power (kW) |
coeff |
it is a factor of safety that must hold losses in the cables and the efficiency of the converter. We take coeff = 1.25 [20] |
After the calculation, there is a power for the converter of 96 kW. A single converter or several converters equivalent to the power calculated according to the availability of the product in the market can be used.
d.5) Diesel Generator Sizing
In general, the diesel generator (DG) is sized to cover the peaks of load demand. For this, we use the following equation (8), [20]:
C s |
factor of safety takes account of the evolution of the load in the future, it is equal to 1.3 [20] |
The values of the power of the DG used are 0, 9, 13, 20, 28, 30, 55, 80, 100 kW. These are standard values of commercial products whose technical and economic data are available [22].
e) Necessary Data
e.1) PV Generator Data
The cost of acquiring and replacing a kW for the PV generator is considered to be 1400 $ [22, 23], and the costs of maintenance and operations are 1% of the investment each year.It is important to note that the purchase price takes into account the price of solar panels (65%), regulator (5%), other fastening components and cabling (20%), and installation costs (10%) [18, 22, 23, 24].
Then input the solar panel properties: the current type (DC), the lifetime (25 years), the losses due to heat and fouling (85%), the inclination (45 °), the direction (South), and the soil reflectivity (20 percent). The influence of temperature has been ignored to simplify the computation. The regulator is supposed to be an MPPT (Maximum Power Point Tracking) regulator.
e.2) Batteries Data
The selected storage solution unit was a Surette 4KS25P rated at 4V and 1900Ah, with an efficiency of 80 percent, a discharge depth of 60 percent, and a lifespan of 12 years. The storage system is set up so that each row of batteries in series comprises 12 units, resulting in a 48V DC bus voltage.
The original cost of a battery is expected to be 1175$, with the replacement cost being the same [24], while the cost of maintenance and operation is anticipated to be 10$ [25].
e.3) Converter Data
The initial cost (buying and installation) of the reversible inverter chosen for our application is anticipated to be 700 $/kW, which is the same as the replacement cost. The annual operating and maintenance expenditures are projected to be 1% of the investment. Its lifespan is anticipated to be 15 years. The efficiency of the converter is considered to be 90% in inverter mode and 85% in rectifier mode [25, 26].
e.4) Diesel Generator Data
Table 5, shows the generator price as a function of power.
Table 5 Cost of a diesel generator varies with its power
| Power (kW) | 9 | 13 | 20 | 28 | 30 | 55 | 80 | 100 |
| Price ($) | 4224 | 4655 | 5074 | 6198 | 7380 | 8949 | 9782 | 10929 |
The replacement cost is considered to be the same as the initial cost, and the cost of maintenance and operations is assumed to be 0.03 $ per hour. The generator has an anticipated lifespan of 15,000 running hours with a minimum charging rate of 30% of its rated capacity [18, 27].
e.5) Fuel Data
Primarily, you have to find the price of fuel, so in this case, the price of diesel per liter. Like all fossil fuels, the price of diesel is constantly increasing. It is, therefore, necessary to find updated data for the fuel price.
According to research conducted by GIZ (Gesellschaft für Internationale Zusammenarbeit), a German organization specializing in multi-sectoral knowledge at the regional and international levels, Algeria is one of the top ten nations in the world in terms of gasoline affordability [28]. Currently, the price of diesel in Algeria is 23.06 Algerian dinars (AD) per liter, or 0.19 $ per liter [29].
In truth, the cost of gasoline varies by region, and in remote areas, the price would be greater due to transportation costs. A gasoline scarcity is another source of increased fuel costs; in extreme situations, fuel prices might reach 75 AD per liter (0.625$/L) [29].
e.6) Economic and Control Data and System Constraints
For the control data, a time step of 60 min is assumed, and the desired hybrid system operates according to the cycle charging strategy. Constraints are the conditions that the system must satisfy. HOMER sets aside systems that do not meet the constraints, so they do not appear in the optimization results. We can indicate whether we allow an energy deficit and impose a minimum proportion of renewable energy required in the system. We utilize the software's default values for our application. Table 6, summarizes the economic, control, and system restrictions.
Table 6 Economic and control data and system constraints
| Economic Data | Control Data | Constraints | |||
|---|---|---|---|---|---|
| Annual real interest rate (%) | Lifetime of the project (years) | Time step used in the simulation (min) | operating strategy | Energy deficit capability (%) | Minimum fraction of renewable energy (%) |
| 6 | 25 | 60 | Cycle Charging | 0 | 0 |
Results and discussion
HOMER simulates system setups with all possible combinations of the input components. It removes any infeasible system designs that are out of sync with the energy requirements and are incompatible with the provided resources and limitations.
We acquired the overall findings presented in figure 5, after simulating all feasible setups.
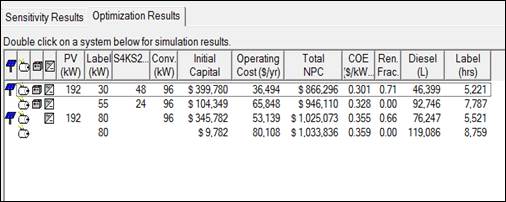
According to the NPC, the outcomes are rated from most lucrative to least profitable (top to bottom) (Net Present Cost). It should be highlighted that the hybrid system is the least expensive option across the project's life cycle, with an NPC of 866.296 $ and a COE (Cost of Energy) of 0.301 $/kWh. This system has a 192 kW PV field, a 30 kW diesel generator, a 48-battery storage system, and a 96 kW converter, with the highest investment cost of 399780 $.
To demonstrate the dependability and profitability of hybrid systems, a comparison between this configuration and the other most commonly used options, such as diesel alone and PV alone, is useful.
Comparison of HES with PV Alone
Because we required a constant supply of uninterrupted demand, the PV alone does not appear in the software's offered solutions. As a result, the HES is more profitable than PV alone.
Comparison of HES with Diesel Alone
Table 7, outlines the important parameters that differ between the two setups (hybrid and diesel alone).
Except for the initial cost, which is negligible in the traditional method, all of the characteristics of the hybrid system are more lucrative than Diesel alone. The majority of the overall cost of this solution is due to the consumption of gasoline. The use of fuel to raise the NPC and the COE. When we examine the technical performance of each solution, we can see that the hybrid system produces more electrical energy than the diesel system alone, which is primarily due to the fraction of renewable energy used in the hybrid system, which results in an energy surplus greater than the standard solution. As a result, the hybrid system enables the delivery of a bigger power source, whilst the capacity of the DG has nearly quadrupled in the conventional arrangement.
The DG performs better in the hybrid arrangement since it is still more essential than the full load, but it is still operating, causing energy losses when the load level is low. As a result, the DG's lifetime fell from the hybrid to the regular option. Finally, the emissions of all gases are much reduced when compared to the second choice (conventional), and the results obtained emphasize the significance of renewable energy in reducing gas emissions.
Table 7 Comparison between HES and diesel alone
| Settings | Diesel Alone | HES |
|---|---|---|
| System composition | 80 kW DG | 192 kW PV, 30 kW DG, 48 batteries and 96 kW converter |
| Production of electrical energy kwh/year | 252132 | 459739 |
| Renewable energy fraction | 0 % | 70 % |
| Excess energy | 10,5 % | 45% |
| energy deficit | 0 % | 0 % |
| Hours of operation of the DG h/year | 8759 | 5221 |
| number of start and stop | 2 | 597 |
| fuel consumption L/year | 119086 | 46399 |
| Specific consumption L/kwh | 0,472 | 0,342 |
| DG's performance | 21,5 | 29,7 % |
| DG's service life | 1,71 | 2,87 |
| Carbon dioxide kg/year | 313592 | 122184 |
| Carbonmon oxide kg/year | 774 | 302 |
| Unburnehydro carbons kg/year | 85,7 | 33,4 |
| Particulate matter kg/year | 58,4 | 22,7 |
| Sulfur dioxide kg/year | 630 | 245 |
| Nitrogen oxides kg/year | 6907 | 2691 |
| Initial cost $ | 9782 | 399780 |
| Replacement cost $ | 70163 | 100983 |
| Operation/Maintenance Cost and Fuel $ | 954807 | 382531 |
| Cost price $ | -915 | -16998 |
| NPC $ | 1033837 | 866296 |
| COE $/kwh | 0,359 | 0,301 |
Conclusion
We attempted to answer the study question posed in the introduction about the technical, economic, and environment efficiency of the hybrid system compared to other traditional methods utilized to service isolated sites in Algeria in this publication. To do this, we followed a well-defined process and used the HOMER program as a simulation tool. The results reveal that the hybrid system is the ideal choice compared to the other solutions, namely PV alone and diesel alone, given the location chosen with the local resources and the characteristics of the load to be supplied. At the same time, the HES offers several technological, economic, and even ecological benefits over diesel alone.

