


 Servicios personalizados
 Español (pdf)
 Articulo en XML
 Referencias del artículo
 Enviar articulo por email
 Citado por SciELO
  Similares en
SciELO
Similares en
SciELO 
 Permalink
Introduction
One-third of the deaths globally caused by non-communicable diseases are due to cardiovascular diseases, constituting the first cause of death worldwide. Above three-quarters of CVD deaths occur in low- and middle-income countries ENT#091;1ENT#093;. In 2020 in Cuba, heart disease claimed the lives of about 30 thousand people, positioning it as the principal cause of death in the country. Among heart diseases, cardiac arrhythmias are common. In Cuba, arrhythmias were responsible for 921 deaths that year ENT#091;2ENT#093;.
The electrocardiogram (ECG) is the principal method and current gold standard for detecting and diagnosing arrhythmias. The ECG allows us to determine the relationships between the different segments and intervals of the signal and the alterations of the cardiac rhythm, elements that facilitate the identification of the type of arrhythmia. The study and diagnosis of arrhythmias are commonly performed with ambulatory monitoring ENT#091;3ENT#093;. The Holter method allows monitoring and recording of the heart's electrical activity of the patient while performing daily activities. One disadvantage of the ECG is that it requires electrodes attached to the skin. These electrodes are usually uncomfortable and might limit patient movements. Besides, due to the long monitoring time, the gel between the electrodes and the patient's skin loses conductive properties and can cause skin irritation ENT#091;4ENT#093;.
Photoplethysmography (PPG) is a simple, non-invasive, low-cost optical monitoring technique. PPG measures fluctuations induced by cardiac activity in tissue blood volume. The photoplethysmographic waveform is made up of a pulsatile component (AC), attributed to synchronous cardiac changes in blood volume with each heartbeat, superimposed on a slowly varying baseline (DC) with low-frequency components attributed to respiration, the sympathetic nervous system, and thermoregulation ENT#091;5ENT#093;. PPG signal acquisition requires a single sensor and is less complex than ECG acquisition. The PPG sensor is easier to use and less sensitive to skin contact than standard ECG electrodes. These characteristics reveal PPG analysis as a promising method for investigating vascular diseases. New studies indicate the potential of the photoplethysmographic waveform to detect cardiac arrhythmias ENT#091;6, 7, 8, 9ENT#093;.
For the study of cardiac arrhythmias, there are several ECG databases. However, the availability of annotated PPG signals that allow such studies is limited. Physionet ENT#091;10ENT#093; is one of the largest sources of clinical data. In March 2022, Physionet's data repository had 17 annotated databases of ECG signals for the study of various arrhythmias. However, the number of PPG databases available in the same section until July 2022 was 5. Furthermore, the goal of such signals is the heart and respiratory rate estimation and the evaluation of wave morphology variation due to exercise stress ENT#091;11, 12, 13, 14, 15ENT#093;. Most of the studies based on PPG signals for the detection of various types of arrhythmias use proprietary databases that are not publicly available ENT#091;6, 7, 8, 9ENT#093;.
There are several tools for the analysis and annotation of ECG signals. For instance, ENT#091;16ENT#093; proposes a software tool designed and optimized for analysis of the ECG signal during the detection of arrhythmias using machine learning techniques. On the other hand, ENT#091;17ENT#093; proposes the open-source WaveformECG platform that supports analysis, visualization, and interactive annotation of ECG signals. This tool has been used in several cardiac disease studies and is available on GitHub (https://github.com/PALMS-gui/PALMS) under the CVRG project open-source repository under the Apache 2.0 license. The study in ENT#091;18ENT#093; present the development platform and capabilities of internet-based software tool for the purpose of user-friendly manual annotation and delineation of heartbeats in 12-lead ECG databases. Another study used the ECG analysis software Pathfinder SL for detecting atrial fibrillation in long-term ECG signals ENT#091;19ENT#093;. The open-source software ECGAug in ENT#091;20ENT#093; includes a new method that generates an augmented training set of QRST signals (individual beats or rhythm bands) with precise reference point annotations.
Up to the authors' knowledge, there are a few software tools for analyzing and marking fiducial points and the occurrence of events in the PPG signal. The study in ENT#091;21ENT#093; proposes a computer program for analyzing the photoplethysmographic signal recorded by PPG sensors of smart-watches or portable devices. The aim of this software is the detection of atrial fibrillation. Another study presents a software application that allows the automatic detection, visualization, and manual correction of the annotations of biomedical signals such as ECG and PPG ENT#091;22ENT#093;. This software features three types of manual annotations: fiducial point detection, event detection, and signal quality.
The search performed in international datasets suggests few annotated PPG signals for studying arrhythmias. Furthermore, there is a lack of software tools that allows analyzing and marking this signal. This paper proposes a software tool for annotating arrhythmia events and artifacts in electrocardiographic and photoplethysmographic signals. ''PPG & ECG Annotation Tool'' is a software tool with a simple and intuitive graphical interface aimed at cardiologists and medical science specialists. This tool processes both signals, i.e., ECG and PPG, in parallel. Such a feature is handy when processing recordings from multiparametric databases such as MIMIC ENT#091;10ENT#093;.
Materials and methods
Python 3.6.8 for Linux is the developing platform. The user interface uses PyQt 5.9.1. The tool requires several third-party packages like NumPy, SciPy, and Sklearn. NumPy is a base package for scientific computing with Python that contains functions for linear algebra, Fourier analysis, basic statistics, and others. SciPy is an algorithms collection from mathematics, science, and engineering based on Python. Sklearn is a library for machine learning and data analysis. Another component is the PyQtGraph library. PyQtGraph is a library for developing graphical user interfaces in data acquisition, signal processing, and analysis applications. The integrated development environment is the free version of the IntelliJ IDEA PyCharm 2018.2.4. PyCharm is a dedicated IDE for Python and Django, which provides a wide range of essential tools for developers. Figure 1 shows the general block diagram of the software.
The preprocessing block includes a fourth-order, zero-phase bandpass Butterworth filter. The cut-off frequencies for the photoplethysmographic signal are 0.5 Hz and 10 Hz, while for the electrocardiographic signal, the low cut-off frequency is 0.05 Hz, and the high cut-off frequency is 40 Hz. Once the signals are filtered, the user may perform three groups of operations: (1) fiducial points detection on both signals, (2) annotation of arrhythmia events or artifacts, and (3) the use of support tools such as measurement of time intervals and heart rate in segments chosen by the user.
The software allows the detection of the R wave peak in the ECG signal and peak, foot, and dichrotic points in the PPG signal. For the detection of R peaks, the algorithm based on thresholds of the first and second derivative of the ECG signal was used ENT#091;23ENT#093;. Detection of PPG signal peaks uses the method proposed in ENT#091;24ENT#093;. Firstly, the algorithm detects possible peaks using the derivative's method. Then, aiming to reduce the false positive rate, the algorithm filters out detected peaks using the heart's refractory period and a heuristics process. In the next step, the algorithm groups the peak candidates into clusters. The maximum amplitude within each group is the algorithm output and corresponds to a signal peak.
The method for detecting the pulse wave foot is an adaptation of the method proposed by Zhang et al. ENT#091;25ENT#093; to estimate the end of the T wave in ECG signals. This method uses the output of the PPG waveform peak detector algorithm. First, at each systolic peak, the algorithm searches backward for each wave where the area under the curve is maximum. The maximum area under the curve corresponds with the minimum point in the signal trace and the pulse wave foot.
The study in ENT#091;26ENT#093; shows a dichrotic-notch point detection algorithm that is fast and easy to implement. In this study, we implemented a variation of the method proposed in ENT#091;26ENT#093;. This method uses the first and second derivatives of the signal and three fundamental steps: 1) amplitude threshold search, 2) derivative slope inversion, and 3) empirical formulae. The algorithm searches candidates in the interval between one systolic peak and the foot of the next pulse wave. These points come from the two detection algorithms implemented in the tool and described above.
After the automatic fiducial points detection stage, the user can manually correct the generated annotations to ensure accuracy. The recommended workflow for the software is to: (a) apply automatic detection algorithms, (b) check the generated points, and (c) manually correct the points where necessary. In addition, the software allows annotations of 11 types of arrhythmias (asystole, bradycardia, tachycardia, ventricular fibrillation, ventricular tachycardia, atrial fibrillation, flutter, isolated ventricular premature beats, isolated atrial premature beats, bigeminy, and trigeminy) and of low quality in the signals, for example, due to the occurrence of artifacts. Finally, the tool allows you to save all the annotations made.
For the validation of the implemented detection algorithms, we propose the use of synthetic signals with controlled features. For this purpose, we generated twenty PPG signals using the PPGSynth tool ENT#091;27ENT#093;. PPGSynth allows the generation of synthetic PPG signals from a single PPG pulse pattern composed of two combined Gaussian functions. PPGSynth synthesizes the PPG waveform for regular heartbeats and three types of irregular heartbeats: compensation, reset, and interpolation.
Premature heartbeats change the PPG signal, causing the occurrence of irregular segments. There are two types of premature heartbeats, premature atrial contractions, and premature ventricular contractions. PPGSynth supports irregular PPG signals resulting from premature atrial contractions. Premature atrial contractions change the PPG waveform for two consecutive beats. Based on the difference between the duration of the first beat and the second beat, the study in ENT#091;27ENT#093; classifies beats into four types: compensation, reset, interpolation, and reentry. The definitions of these heartbeats are as follows:
Compensation heartbeat: the second beat is prolonged, and the sum of the duration of the first beat and the duration of the second beat is the duration of two reference beats.
Restart heartbeat: The second heartbeat is prolonged, but the sum of the duration of the first heartbeat and the duration of the second heartbeat is less than the duration of two reference heartbeats.
Interpolation heartbeat: the sum of the duration of the first beat and the duration of the second beat is equal to the length of a reference beat.
Reentry heartbeat: The sum of the duration of the first beat and the duration of the second beat is less than the duration of a reference beat.
PPGSynth includes the first three classes of irregular heartbeats and allows the generation of signals with different sampling frequencies, time durations, and noise levels. Given a type of irregular heartbeat, PPGSynth adds those heartbeats randomly in the generated interval.
The synthetic dataset for the evaluation includes 20 signals of 5 min duration with a sampling frequency of 300 Hz and a heart rate of 60 beats per minute (bpm). The generated synthetic dataset includes four groups: regular heartbeats, compensation heartbeats, reset heartbeats, and interpolation heartbeats. Each group contains five PPG signals with a different signal-to-noise ratio (SNR). The added noise is Gaussian white noise. Noise levels were selected by reference to the Noise Stress Test DatabaseENT#091;10ENT#093; used to assess the robustness of ECG processing algorithms. SNRs lower than 6 dB strongly affect the morphology of the PPG signal. Thus, only levels equal to or above 6 dB were used in the evaluation.
PPGSynth does not allow direct access to the fiducial points of the generated signal. Thus, we modified the application's code to store these values in a MATLAB file. The saved feet, peaks, and dichrotic points were used as a reference to evaluate the detection algorithms contained in the tool proposed in this study.
The performance evaluation of the algorithm requires computing the sensitivity (Se) and the positive predictive value (+P) using the formulae, (1, 2)
 (1)
(1)
 (2)
(2)
In this study, a point is "considered detected" -True Positive- when the algorithm's output is within a window of 66 ms around the annotation generated by the PPGSynth tool, or equivalently, ±10 samples at 300 Hz. When the previous condition does not hold for a given point, it will be a False Negative, i.e., the point detection fails. Furthermore, the detected point is also a False Positive since it does not correspond to any fiducial point in the signal trace.
Other metrics for evaluating performance in detection tasks are accuracy (μ) and precision (σ). In this study, we compute both of them for each record (3, 4):
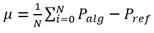 (3)
(3)
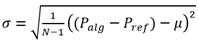 (4)
(4)
Results
Tables 1, 2, 3 show the evaluation results of the algorithms for detecting the foot, peak, and dichrotic points of the PPG signals. Each table contains the results of TP, FN, FP Se, +P, accuracy (μ), and precision (σ) for the four groups of signals with different SNRs. The most unfavorable results for each algorithm are in bold letters.
Table 1 Results of detecting the foot of the photoplethysmographic wave.
| Rhythm type | Noise Type (SNR) | TP | FN | FP | Se | P+ | μ (ms) | σ (ms) | ||||
|---|---|---|---|---|---|---|---|---|---|---|---|---|
| Regular | None (∞) | 303 | 2 | 1 | 0.99 | 0.99 | -11.2 | 4.9 | ||||
| Gaussian (24 dB) | 300 | 2 | 1 | 0.99 | 0.99 | -8.6 | 19.3 | |||||
| Gaussian (18 dB) | 296 | 11 | 11 | 0.96 | 0.96 | -4.8 | 29.1 | |||||
| Gaussian (12 dB) | 245 | 51 | 51 | 0.83 | 0.83 | -3.3 | 33.8 | |||||
| Gaussian (6 dB) | 175 | 125 | 126 | 0.58 | 0.58 | 3.2 | 36.0 | |||||
| Compensation | None (∞) | 300 | 1 | 0 | 0.99 | 1 | -10.7 | 4.6 | ||||
| Gaussian (24 dB) | 300 | 1 | 0 | 0.99 | 1 | -5.7 | 20.7 | |||||
| Gaussian (18 dB) | 291 | 10 | 10 | 0.97 | 0.97 | -7.4 | 27.8 | |||||
| Gaussian (12 dB) | 251 | 50 | 50 | 0.83 | 0.83 | -3.3 | 34.7 | |||||
| Gaussian (6 dB) | 174 | 127 | 128 | 0.58 | 0.58 | -2.7 | 36.9 | |||||
| Restart | None (∞) | 300 | 1 | 0 | 0.99 | 1 | -10.8 | 3.8 | ||||
| Gaussian (24 dB) | 301 | 0 | 0 | 1 | 1 | -7.3 | 20.5 | |||||
| Gaussian (18 dB) | 284 | 17 | 17 | 0.94 | 0.94 | -6.1 | 26.7 | |||||
| Gaussian (12 dB) | 235 | 66 | 66 | 0.78 | 0.78 | -0.4 | 34.8 | |||||
| Gaussian (6 dB) | 201 | 100 | 100 | 0.67 | 0.67 | -4.9 | 36.8 | |||||
| Interpolation | None (∞) | 302 | 1 | 0 | 0.99 | 1 | -10.4 | 4.1 | ||||
| Gaussian (24 dB) | 300 | 3 | 2 | 0.99 | 0.99 | -10.4 | 19.7 | |||||
| Gaussian (18 dB) | 288 | 15 | 14 | 0.95 | 0.95 | -4.7 | 28.9 | |||||
| Gaussian (12 dB) | 259 | 44 | 43 | 0.85 | 0.86 | -5.3 | 35.8 | |||||
| Gaussian (6 dB) | 188 | 115 | 115 | 0.62 | 0.62 | 0.0 | 36.6 | |||||
Table 2 Results of detecting the peak of the photoplethysmographic wave.
| Rhythm type | Noise Type (SNR) | TP | FN | FP | Se | P+ | μ (ms) | σ (ms) | ||||
|---|---|---|---|---|---|---|---|---|---|---|---|---|
| Regular | None (∞) | 304 | 0 | 0 | 1 | 1 | 3.3 | 0 | ||||
| Gaussian (24 dB) | 301 | 0 | 0 | 1 | 1 | 2.8 | 6.5 | |||||
| Gaussian (18 dB) | 306 | 0 | 1 | 1 | 0.99 | 3.3 | 11.4 | |||||
| Gaussian (12 dB) | 295 | 0 | 0 | 1 | 1 | 5.1 | 19.2 | |||||
| Gaussian (6 dB) | 291 | 8 | 9 | 0.97 | 0.97 | 1.4 | 29.4 | |||||
| Compensation | None (∞) | 300 | 0 | 0 | 1 | 1 | 3.2 | 12.3 | ||||
| Gaussian (24 dB) | 300 | 0 | 0 | 1 | 1 | 3.6 | 6.0 | |||||
| Gaussian (18 dB) | 300 | 0 | 0 | 1 | 1 | 2.6 | 11.8 | |||||
| Gaussian (12 dB) | 298 | 2 | 2 | 0.99 | 0.99 | 1.8 | 19.3 | |||||
| Gaussian (6 dB) | 287 | 13 | 14 | 0.96 | 0.95 | 2.1 | 30.1 | |||||
| Restart | None (∞) | 299 | 1 | 0 | 0.99 | 1 | 3.2 | 1.2 | ||||
| Gaussian (24 dB) | 301 | 0 | 0 | 1 | 1 | 3.6 | 6.0 | |||||
| Gaussian (18 dB) | 300 | 0 | 0 | 1 | 1 | 3.8 | 11.7 | |||||
| Gaussian (12 dB) | 298 | 2 | 0 | 0.99 | 1 | 3.4 | 19.6 | |||||
| Gaussian (6 dB) | 293 | 7 | 7 | 0.98 | 0.98 | 2.4 | 27.5 | |||||
| Interpolation | None (∞) | 301 | 1 | 0 | 0.99 | 1 | 3.4 | 1.1 | ||||
| Gaussian (24 dB) | 302 | 0 | 0 | 1 | 1 | 3.4 | 5.8 | |||||
| Gaussian (18 dB) | 302 | 0 | 0 | 1 | 1 | 3.1 | 11.0 | |||||
| Gaussian (12 dB) | 300 | 2 | 2 | 0.99 | 0.99 | 4.2 | 18.6 | |||||
| Gaussian (6 dB) | 295 | 7 | 8 | 0.98 | 0.97 | 0.4 | 29.2 | |||||
Table 3 Results of detecting the dichrotic point of the photoplethysmographic wave.
| Rhythm type | Noise Type (SNR) | TP | FN | FP | Se | P+ | μ (ms) | σ (ms) | ||||
|---|---|---|---|---|---|---|---|---|---|---|---|---|
| Regular | None (∞) | 293 | 12 | 10 | 0.96 | 0.97 | 6.6 | 11.6 | ||||
| Gaussian (24 dB) | 275 | 26 | 25 | 0.91 | 0.92 | 2.9 | 25.7 | |||||
| Gaussian (18 dB) | 263 | 44 | 44 | 0.86 | 0.86 | 3.4 | 32.1 | |||||
| Gaussian (12 dB) | 220 | 76 | 75 | 0.74 | 0.75 | 7.2 | 33.0 | |||||
| Gaussian (6 dB) | 210 | 89 | 90 | 0.70 | 0.70 | 12.6 | 36.2 | |||||
| Compensation | None (∞) | 297 | 4 | 3 | 0.99 | 0.99 | 4.2 | 9.0 | ||||
| Gaussian (24 dB) | 283 | 18 | 17 | 0.94 | 0.94 | 0.1 | 28.0 | |||||
| Gaussian (18 dB) | 266 | 35 | 34 | 0.88 | 0.88 | 3.8 | 32.3 | |||||
| Gaussian (12 dB) | 233 | 68 | 67 | 0.77 | 0.77 | 8.3 | 36.1 | |||||
| Gaussian (6 dB) | 184 | 117 | 118 | 0.61 | 0.61 | 5.5 | 38.3 | |||||
| Restart | None (∞) | 294 | 7 | 5 | 0.97 | 0.98 | 4.7 | 8.7 | ||||
| Gaussian (24 dB) | 270 | 31 | 30 | 0.89 | 0.90 | -1.1 | 26.7 | |||||
| Gaussian (18 dB) | 264 | 37 | 36 | 0.88 | 0.88 | 3.7 | 31.5 | |||||
| Gaussian (12 dB) | 236 | 65 | 64 | 0.78 | 0.79 | 5.2 | 34.5 | |||||
| Gaussian (6 dB) | 193 | 108 | 107 | 0.64 | 0.64 | 4.6 | 39.2 | |||||
| Interpolation | None (∞) | 294 | 9 | 3 | 0.97 | 0.99 | 4.2 | 9.2 | ||||
| Gaussian (24 dB) | 284 | 19 | 15 | 0.94 | 0.95 | 0.6 | 24.5 | |||||
| Gaussian (18 dB) | 265 | 38 | 35 | 0.87 | 0.88 | 3.3 | 33.1 | |||||
| Gaussian (12 dB) | 229 | 74 | 70 | 0.76 | 0.77 | 11.8 | 33.1 | |||||
| Gaussian (6 dB) | 199 | 104 | 99 | 0.66 | 0.67 | 9.1 | 36.6 | |||||
Figure 2 shows the graphic user interface of the application, including the main menu, the toolbar, and the graphical area divided into two sections.
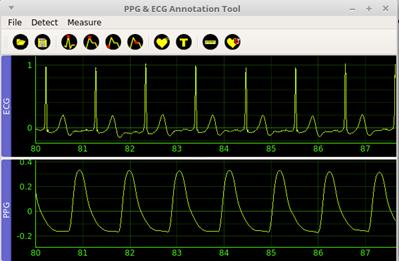
The main menu and toolbar provide access to the software options. Figure 3 shows the layout of the toolbar with a description below.
The File menu provides the following actions: Open, Save, and Exit. The Exit option is only available in the main menu. The Open (1) option allows loading a .mat file with an ECG signal and a PPG signal. Save (2) allows storing the signals and the annotations made by the user in .mat files, Matlab's proprietary format. This action will only be available if some action is performed on the record, whether it detects characteristic points of any of the signals or labels any segment.
The Detect menu options are available to the user after opening a record. The actions included in this menu are (3)- Peak R (ECG), (4)- Peak (PPG), (5)-Foot (PPG), (6)-Dichrotic (PPG), (7)-Arrhythmia and (8)-Type.
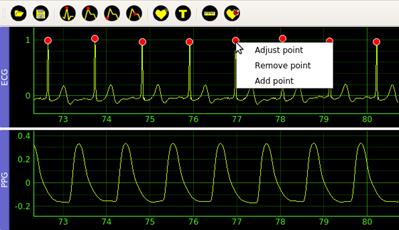
Fiducial point detection actions (3)-(6) automatically detect the points in the corresponding previously filtered signal. The user can manually correct the positions of each point in case of errors after finishing the automatic detection process. For each detected point, the software displays a popup menu with three entries: Adjust point, Remove point, and Add point, see Figure 4. Adjust point allows the user moving the current point around the window, Remove point removes the selected point, and Add point adds a new point.
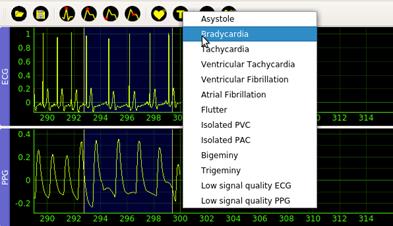
The Arrhythmia (7) option in the Detect menu creates a sliding window that the user can place and size at will. The beginning and end of the window mark the interval that the user will subsequently classify. The Type (8) action is available once the user adjusts the window. This action selects the annotating mark for the corresponding segment, see Figure 5. Possible annotations marks are Asystole, Bradycardia, Tachycardia, Ventricular Tachycardia, Ventricular Fibrillation, Atrial Fibrillation, Flutter, Isolated PVC, Isolated PAC, Bigeminy, Trigeminy, Low signal quality ECG, Low signal quality PPG.
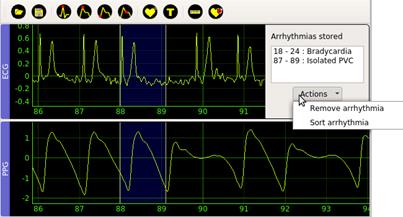
Each time the user performs segment labeling in a window, the application shows in a panel on the top-right the beginning, the ending, and the label of the current window, see Figure 6. This information panel includes a button called Actions that allows the user to delete selected annotations or chronologically order previously marked arrhythmias.
The Measure menu provides two information tools to the user: Distance (9) and Heart rate (10). With the Distance option, the user can show the time interval in seconds between two points, for example, two R peaks. The Heart rate tool allows the calculation of the heart rate value in the selected interval. Both options show the computed values in the graphical area, see Figure 7.

Discussion
From the Tables 1, 2, 3, it is clear that the performance of the detection methods is almost independent of the type of rhythm. Of the three algorithms evaluated, the best results correspond to peak detection, while the most unfavorable ones belong to the dichrotic point detection algorithm. All three algorithms show a decline in sensitivity, positive predictive value, and precision as the signal-to-noise ratio worsens.
Table 1 states the algorithm output has high Se and +P for signals with high SNR, i.e., above 18 dB. In PPG signals with high SNR, the region around the foot of the photoplethysmographic wave undergoes a few variations, so the algorithm exhibits high performance. Figure 8a shows the output of the algorithm for detecting the foot of the pulse waveform using a signal with irregular compensation heartbeats and SNR of 18 dB. It is clear that in this low-noise scenario, the algorithm performs well.
When the SNR is below 18 dB, the signal morphology is compromised. The method fails when the noise incorporates fluctuations in the region close to the foot of the pulse wave because the calculation of the area under the curve, which is the indicator used for detecting the foot, is biased due to noise. Figure 8b shows a signal with irregular compensation heartbeats and SNR of 6 dB. The segment illustrates three cases where the output of the detection algorithm (+) and the reference value (ο) differ by more than 10 samples (33 ms). This interval is highlighted with black dashed lines. In the three cases where the algorithm output is out for region of interest, 3 FN and 3 FP are added to the performance statistics. The figure shows how the algorithm fails when a signal fluctuation occurs to the right of the reference point; this causes the algorithm to find a minimum that does not correspond to the foot of the pulse wave. The decrease of the SNR negatively influences the algorithm's results due to the deterioration of the signal morphology.
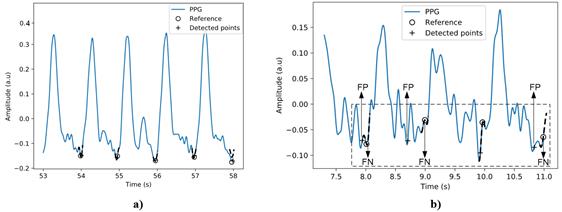
Figure 8 Detection of the beginning of the waves of the PPG signal, a) signal with irregular compensation heartbeats and SNR of 18 dB, b) signal with irregular compensation heartbeats and SNR of 6dB
The algorithm for detecting the systolic peak of the PPG signal shows better results. The main reason is that the SNR of the pulse wave peak is the largest of all the signal components. Besides, using clusters in the algorithm considerably reduces the number of FP and FN since the detection is usually more robust. However, the algorithm is also affected, although to a lesser extent, by the decrease in SNR. The algorithm fails when the noise introduces a new peak of greater amplitude in the search region. Figure 9 shows the output of the detection algorithm (+) and the reference value (ο) for the signal with irregular compensation heartbeats and Gaussian white noise of 6 dB. This signal has the highest number of FP and FN in Table 2. The figure illustrates a case where the algorithm output differs by more than 10 samples from the reference.
The evaluation of the algorithm for detecting the dichrotic point of the photoplethysmographic wave shows the most unfavorable results, see Table 3. This algorithm uses the derivative method, so the increase in noise levels considerably affects the detection accuracy. Figure 10 allows comparing the performance of the algorithm between two signals. As can be seen in the figure, the decrease in the signal-to-noise ratio causes noticeable variations in the morphology of the signal around the dichrotic point. These fluctuations negatively influence the result of the algorithm.
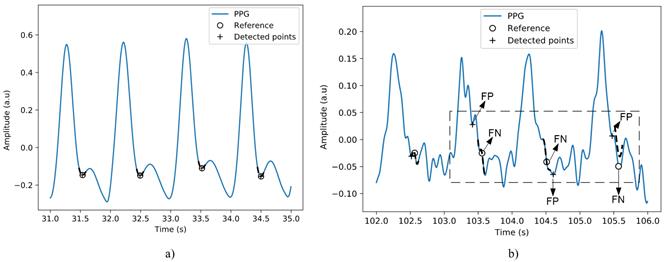
Figure 10 Detection of the dichrotic point in the PPG signal, a) performance of the algorithm on a signal with irregular interpolation heartbeats without noise and b) signal with irregular restart heartbeats and an SNR of 6 dB.
The three evaluated algorithms show better results for signals with lower noise levels. Comparatively, the best results correspond to the systolic peak detection algorithm because the systolic peak is the most prominent fiducial point and, consequently, the easiest to detect. Moreover, the algorithm for detecting pulse wave peaks incorporates a clustering stage that allows for reducing detection errors. This stage acts as a selective filter of amplitude peaks. The detection algorithms implemented in the tool are a support method for the user. The principal purpose of these algorithms is to speed up the fiducial points annotation, so the reported performances can be considered acceptable. Although it is clear that the method performances are strongly affected by noise, a signal with low SNR, for instance, 6 dB SNR, is unsuitable for arrhythmia diagnosis because of the loss of information due to noise.
Conclusions
The three evaluated algorithms show better results for signals with lower noise levels. Comparatively, the best results correspond to the systolic peak detection algorithm because the systolic peak is the most prominent fiducial point and, consequently, the easiest to detect. Moreover, the algorithm for detecting pulse wave peaks incorporates a clustering stage that allows for reducing detection errors. This stage acts as a selective filter of amplitude peaks. The detection algorithms implemented in the tool are a support method for the user. The principal purpose of these algorithms is to speed up the fiducial points annotation, so the reported performances can be considered acceptable. Although it is clear that the method performances are strongly affected by noise, a signal with low SNR, for instance, 6 dB SNR, is unsuitable for arrhythmia diagnosis because of the loss of information due to noise.

