


 Servicios personalizados
 Inglés (pdf)
 Articulo en XML
 Referencias del artículo
 Enviar articulo por email
 Citado por SciELO
  Similares en
SciELO
Similares en
SciELO 
 Permalink
1. -INTRODUCTION
Near-Infra-Red (NIR) light (in the range of 780 nm to 840 nm) is capable of effectively capturing the iris pattern since light in this range is scattered in the internal structures of the iris regardless of the color it is, or the possible low contrast between the iris and the pupil in those individuals with dark irises. However, most commercial sensors, such as video surveillance cameras, or webcams do not have NIR sensors to perform this type of capture. On the other hand, the rise of mobile devices such as smart phones and their integrated cameras are already used for various biometric applications. Nevertheless, in the case of iris biometry this can be hampered by the limiting factor of not having NIR sensors. Therefore, if you intend to use a sensor that works in the visible spectrum (in the range of 380 nm to 720 nm) to capture iris patterns, the success could be limited only to those instances of light color iris and that are captured in a controlled scenario. In view of the growing popularity of iris biometry based on this type of sensor [1], it is important to address this problem due to the wide spectrum of applications that can be developed. The acquisition of video-based eye images for iris recognition is an interesting alternative in the current context of the extensive use of mobile devices and video surveillance cameras [2-3]. This modality can provide more information from video capture of eye region.
The problem in these systems is the generated large amount of information from the video capture and how to decide what information will be passed to the system in order to perform the recognition process. A metric for evaluating the quality of eye images combined with automatic image detection can be an alternative. In this work, an approach for video iris recognition is proposed; it is based on a scheme based on the quality evaluation of the eye image in real time simultaneously with process of video capture. For this purpose, a measure of eye image quality is proposed, it takes into account the elements defined in the ISO/ IEC 19794-6: 2005 standard [4]. The combination of the proposed measure with automatic eye detection method ensures that eye images are extracted so that they do not have elements that negatively influence the identification process such as closed eyes and out-of-angle look. The work is structured as fallows. Section 2 discuss the related works, section 3 presents the proposed approach, in section 4 the experimental results are presented and discussed, and finally the conclusions of the work are set.
2. -RELATED WORKS
Evaluating the quality of iris images is one of the recently identified topics in the field of iris biometry [5-6]. In general, quality metrics are used to decide whether the image should be discarded or processed by the iris recognition system. The quality of iris images is determined by many factors depending on the environmental and camera conditions and on the person, being identified [5]. Some of the quality measures reported in literature [6] focus on the evaluation of iris images after the segmentation process, which makes the systems in their capture stage, allow the processing of poor and good quality images. The main problem of these approaches is that the evaluation of the iris image quality is reduced to the estimation of a single or a couple of factors [3], such as out-of-focus blur, motion blur, and occlusion. Other authors [6-7] use more than three factors to evaluate the quality of the iris image: such as the degree of defocusing, blurring, occlusion, specular reflection, lighting, out of angle. Its main lack is they consider that the degradation of some of the estimated parameters below the threshold brings to zero (veto power) the measure that integrates all the evaluated criteria. This may be counterproductive in some systems where the capture conditions are not optimal.
The ISO / IEC 19794-6: 2005 [4] standard identified several properties of the iris image that influence the recognition accuracy. These factors include the distance of the acquisition system from the user, the pixel density of the iris texture and the degree of image blurring. In practice, some of these factors can be controlled by the correct selection of the camera, the correct analysis of the Depth of Field (DOF) and the Field of Vision (FOV). A quality measure that considers the parameters established in the standard [4] and evaluates detected eye image before the segmentation can produce a reduction in errors in the next steps of the system with a consequent increase in recognition rates.
3.-THE PROPOSED APPROACH
Figure 1 shows the general scheme of the proposed approach. Our proposal is based on a new quality metric and it combination with a previous stage of eye image detection. This approach will ensure that the detected eye images do not have elements that negatively influence the identification related with: illumination, sharpness, blurring, gaze, occlusion, pixel density of image.
3.1.IRIS VIDEO CAPTURE AND EYE DETECTION
In [9] the authors perform an analysis of the implication of using iris images in the Visible Spectrum (VS). They demonstrated how the use of a white LED light source positively influences the recognition rates of an iris recognition system. In our proposal, these precepts using a similar design to capture the video were assumed. Detection of eye images is achieved through the classical Viola and Jones algorithm [10]. A detector was trained to detect open eyes containing pupils and iris with or without specular light reflection. The iris training set consisted of 1000 labeled eye images taken from the MobBio [11], UTIRIS [12] databases and an own dataset (see 4.2). The region training set was manually prepared by means of the selection of the rectangular regions enclosing the eye region, and then these samples were saved and rescaled all to a size of 24 x 24 pixels. In the training phase, the classifier was exhaustively trained using these sets of regions by the cascade detectors in a wide variety of training images.
3.2.IMAGE QUALITY EVALUATION
Among the parameters established by the standard [4], the FOV and the focal length are two parameters required to determine the distance between the subject and the camera. The FOV indicates the optimal distance between the subject and the camera for a given pixel density and the focal length is the zoom of the subject in the image. The FOV can be calculated by equation 1.
Where (𝑛) are the pixels “through the sensor” or the number of pixels of the eye image and (d) is the pixel density of the iris within the image of the eye captured by the sensor. The word density is defined in the standard as the sum quantity of the pixels that are on the diagonal length of the iris image. The standard [4] states that the pixel density of an iris image should be at least 200 pixels and contain at least two lines of pixels per millimeter (2 lppmm). If from detected eye images we can know their pixel density (EDens), it is possible to establish a percentage relation between the eye region and the iris region. It will allow us to estimate the iris pixel density (IDens) in the image captured, for this, it can be assumed that the iris represents 25 -30% of an eye image. Therefore, if the concept of pixel density is extrapolated from the iris to the eye using the classical Pythagorean Theorem, it is possible to determine the pixel density of an eye image (equation 2). Where w and h are the width and height in pixels of the detected eye image. Then it is possible to estimate the value of IDens by equation 3.
Where, ciris is the approximate percentage (25-30) of the detected eye image representing the iris.
3.3.QUALITY MEASURE FOR EYE IMAGES
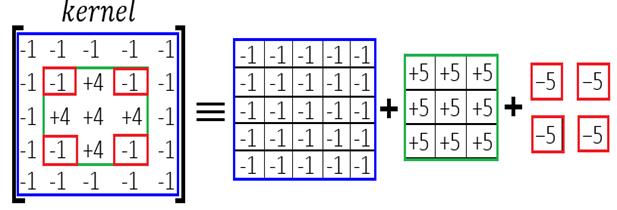
When an image is blurred or out of focus, it loses the details of the edges. In [3], the Kang & Park method was used to evaluate the quality of NIR iris images. This method applies a high-pass filter in the spatial domain and then calculates the total power using Parseval's theorem, which states that the total power has been conserved in the spatial and frequency domains. The method proposes a convolutional kernel of 5x5 pixels and consists of three square box functions, one of 5x5 size with amplitude -1, one of 3x3 size and amplitude +5, and four of 1x1 size and amplitude of -5 (see figure 2). Theoretically, the operator can detect the high frequency of the iris texture much better and the processing time is reduced due to the small size core. It is possible that this behavior can be similar in different conditions of iris image capture and in images captured in the Visible Spectrum. Taking into account, that the sensor pixel density of an iris is a very important element that influences the quality of the images, we propose its combination with the Kang & Park method to obtain a quality measurement of the iris image (Qindex) that is calculated by equation 4.
Where:
kpm is the average value of the image pixels obtained as result of the convolution of the input eye image with the Kang and Park kernel.
UDens is the threshold established by the standard [4] for the minimum IDens with which it will be possible to obtain a quality image.
Ukpm is the estimated threshold of kpm with which it will be possible to obtain a quality image, in [3] it is recommended from experimental results that it be =15.
ent is the entropy of the eye image. The entropy of an iris image only depends on the amount of gray levels and the frequency of each gray level, so it has proven to be a good indicator of the amount of texture information present in the images.
Uent is the estimated threshold of ent with which it will be possible to obtain a quality image. Experimentally, we have verified that the images of iris that have a quality according to the international standard have an entropy higher than 4. For this experiment, we took a set of 300 images from the MobBio [11] and UBIRIS [12] databases and perform the evaluation of their quality by the parameters of pixel density and response of the Kark and Park filter. The experimental results established that those with an index of quality equal to or greater than 1 have an entropy with a value equal to or greater than 4, so we assume this value as the value of Uent.
The values that Qindex can reach will depend on the thresholds selected for IDens, kpm, and ent. Thus considering the threshold UDens= 200 established by the standard, Ukpm=15 experimentally obtained in [3] and Uent= 4 experimentally obtained by us, the minimum value of Qindex to obtain a quality eye image would be 1, higher values would denote images of higher quality and values less than 1 images with a quality below the standard:
If Qindex <1, the image has a quality below the parameters established by the standard.
if Qindex = 1, the image complies with the quality parameters established by the standard.
If Qindex> 1, the image has a higher parameters set by the standard quality.
One aspect to explore in this case would be to determine under what minimum values of Qindex it is possible to obtain acceptable recognition accuracies for a given configuration of a system.
4. EXPERIMENTAL RESULTS AND DISCUSSION
In order to validate the proposal, our experimental design was divided into two parts. The first part was aimed at verifying the influence of the proposed quality measure in the verification task by evaluating it using two benchmark iris image databases. The second part was oriented to verify the influence of the proposed quality measure in the identification task, by evaluating it using our iris video dataset.
4.1. IMPLEMENTED PIPELINE FOR EXPERIMENTS
Four basic modules compose the implemented pipeline for experiments. Figure 3 shows the scheme of the implemented pipeline.
Iris image acquisition: The Iris image acquisition module is based on the approach described in the previous sections. The camera used was a Logitech C920 HD Pro Webcam. It is a high resolution camera designed for visual communication via the web, telephone calls, and virtual conferences among others.
For the support of the camera was designed a device that allows its integration with a source of white LED light. The use of white led light has proven to be very effective in iris recognition [13]. The LED illumination source is used to illuminate the region of the eye so that the iris pattern is visible and in turn does not disturb the user's eyes. The white LED light is medically accepted because it does not affect or damage the vision. Similar white LEDs are also used in smart phones. The placement of the LED lighting source is shown in the figure 4, this allows to maximize the visibility of the iris pattern.
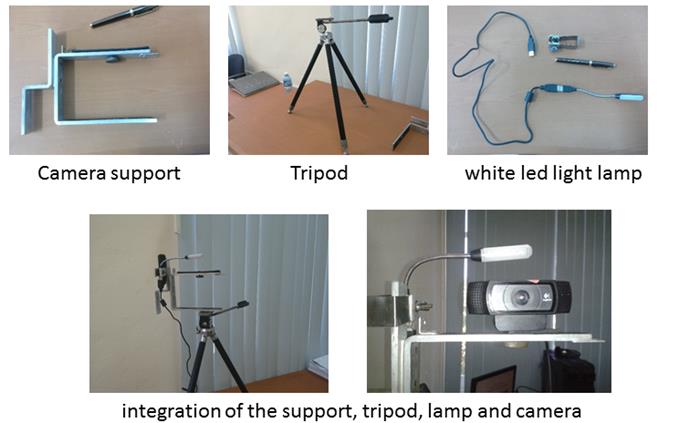
Image segmentation: In this module we used segmentation algorithm proposed in [14]. This method is based on the information of the different semantic classes present in an eye image (including sclera, iris, pupil, eyelids and eyelashes, skin, hair, glasses, eyebrows, specular reflections and background regions) by means of a Fully Convolutional Network (FCN). The experimental results of this work showed that, for the segmentation of the iris, the use of the information of the different semantic classes present in an image of the eye is better than the iris and non-iris segmentation.
The proposed in [14] method demonstrated its robustness for critical cases of images of dark skin people with low contrast between the iris and the pupil, which are correctly classified when the number of classes in an image of the eyes increases to 10 semantic classes. Figure 5 shows an example of an iris image segmented by FCN, the image belongs to a dark-skinned person, note the low contrast between the iris and the pupil and how the algorithm is able to correctly differentiate the two classes.

Iris texture feature extraction. For the purpose of experiments in this work, we experimented the combination of two feature extraction methods with the segmentation proposed in [14] in order to verify the robustness of the proposed quality measure with respect to the use of different features for the recognition.
One of the methods used was Scale-Invariant Feature Transform which extracts SIFT-based key points [15]. This method extract sets of local key points and corresponding key point descriptors, i.e. extracted feature vectors are of variable size. This method allows for an efficient trimming of false positive key point correspondences using geometrical constraints.
Comparison (feature matching): Taking into account that we use SIFT method for feature extraction, for the comparison it is also necessary to use this method which estimates dissimilarity score by matching two sets of SIFT key points trimming false matches [15].
The second method used was the Uniform Local Binary Patterns (LBP) [16]. In the LBP. The texture is divided into blocks to retain local information and one feature histogram, comprising obtained feature values, is extracted per texture block. LBP simply processes neighboring pixel values of each pixel.
Comparison (feature matching): Taking into account that we use LBP method for feature extraction, the Chi-square distance metric [16] is a non-parametric test to measure the similarity between images of a class. The minimum distance found between two images gives the measure of maximum similarity between them.
The average time it takes to analyze a frame of 1920 x1080 pixels, in a PC with an Intel Core i5-3470 processor at 3.2 GHz and 8 GB of RAM, is 20-30 milliseconds. This allows it to be used in any video iris recognition application.
4.2.IRIS DATASETS
MobBio [11] is a multi-biometric dataset including face, iris, and voice of 105 volunteers. The iris subset contains.16 images of each individual at a resolution of 300 × 200 (see an example in figure 3). The database contains images of people with light skin of Caucasian origin, dark skin of African origin.
UTIRIS dataset [12] is an iris biometric dataset containing iris images of the same persons in VS and NIR. The database is constructed with 1540 images from 79 individuals and 158 classes. For our experiments, we used the VS set (806 images of 2048 x 1360, see an example in figure 6).
Our (CENATAV) database consists of 82 videos of 41 people taken in two sessions of 10 seconds each at a distance of 0.55 m. The camera used was a Logitech C920 HD Pro Webcam. It is a high resolution camera designed for visual communication via the web, telephone calls, and virtual conferences among others. In order to guarantee a high-resolution iris image, the videos were captured at resolution of 1920 x1080. The videos were taken in indoor conditions with ambient lighting and presence of specular reflections to achieve an environment closer to the poorly controlled conditions of a biometric application (see figure 7a). The database contains images of people of clear skin of Caucasian origin, dark skin of African origin and mestizo skin, it is composed by 26 men and 15 women, in a range of ages from 10 to 65 years (see an example in figure 7b).
4.3. EXPERIMENTAL RESULTS
The evaluation of accuracy of the proposed approach was assessed by the degree of influence of the eye image quality on recognition accuracy (verification and identification).
The verification accuracy was estimated by Equal Error Rate (EER) at False Acceptance Rate (FAR) ≤0.001%. The EER is the location on ROC or DET curve, where the False Reject Rate (FRR) and FAR are the same, or is computed as the point where False Nonmatch Rate = False Match Rate (FNMR = FMR). Table 1 and 2 show the comparison of the EER obtained by the implemented system on MobBio and UTIRIS databases, taking 3 different intervals of Qindex to reject or accept the eye images to be processed.
Additionally, we conducted a verification experiment in our video database (CENATAV), taking images from videos in real time from 40 people and comparing them against a database of images created from the videos taken in the first session. The database contains 82 images, an image for each eye of the people enrolled, which have Qindex > 1. Table 3 shows the results obtained using the combination of FCN and LBP.
Table 1 Experimental results on MobBio, and UTIRIS datasets using FCN for segmentation and SIFT for feature extraction.
| Database | Qindex | % of images processed | images | EER | d‘ |
|---|---|---|---|---|---|
|
MobBio FCN+SIFT (106 persons, 212 classes) |
0.0 | 100 | 806 | 0.31 | 0.93 |
| 0.7-1.0 | 52.6 | 424 (2 im. x class) | 0.27 | 1.07 | |
| 1.01-1.32 | 26.3 | 212 (1 im. x class) | 0.25 | 1.14 | |
|
UTIRIS FCN +SIFT (79 persons, 158 classes) |
0.0 | 100 | 1540 | 0.08 | 2.13 |
| 0.7-1.0 | 20.5 | 316 (2 im. x class) | 0.07 | 2.16 | |
| 1.01-1.32 | 71.8 | 1106 (8 im. x class) |
Table 2 Experimental results on MobBio, and UTIRIS datasets using FCN for segmentation and LBP for feature extraction
| Database | Qindex | % of images processed | images | EER | d‘ |
|---|---|---|---|---|---|
|
MobBio FCN+LBP (106 persons, 212 classes) |
0.0 | 100 | 806 | 0.27 | 0.87 |
| 0.7-1.0 | 52.6 | 424 (2 im. x class) | 0.25 | 1.09 | |
| 1.01-1.32 | 26.3 | 212 (1 im. x class) | 0.22 | 1.18 | |
|
UTIRIS FCN +LBP (79 persons, 158 classes) |
0.0 | 100 | 1540 | 0.15 | 1.93 |
| 0.7-1.0 | 20.5 | 316 (2 im. x class) | 0.06 | 2.28 | |
| 1.01-1.32 | 71.8 | 1106 (8 im. x class) |
Table 3 Experimental results on our dataset using FCN for segmentation and LBP for feature extraction
| Database | Qindex | % of images processed | images | EER | d‘ |
|---|---|---|---|---|---|
| CENATAV (41 persons, 82 classes) | >1.0 | 100 | 40 (1 im. x person) | 0.001 | 5.2 |
The results in the experimented databases show that the UTIRIS contains higher quality images than MobBio, since the number of images with a Qindex value > = 1 represents 71.8 % in UTIRIS and only 26.3% in MobBio. It is observed that as the value of the Qindex increases, the system supports high quality images and rejects low quality images (See examples in figure 8). This increase in quality, results in a decrease in the EER, with the most significant result in UTIRIS where an EER = 0.04 is achieved with the 71.8% of the database and Qindex>1 when FCN is combined with LBP. However, in the MobBio, increase in the Qindex threshold results in a significant decrease in the number of images to be compared.
The results obtained on the CENATAV dataset show a high performance of the verification process obtaining an EER of 0.001, which corroborates the relevance of the use of the proposed quality index in a real application.
The identification accuracy was estimated by the Correct Identification Rate (CIR) which is the probability that the system correctly matches the input pattern (IrisCode) to a pattern (template) in the database. It measures the percent of valid inputs which are correctly identified. The CIR is computed for four position in the candidate list. The combination of FCN and LBP was used.
In the experiment the three databases were used. In the case of the MobBio database, a subset of 600 images of the 106 people as query subset was taken. As a test database a subset of 212 images representing one image per class was created. For the UTIRIS database we created a query subset composed of 400 images of the 79 enrolled people. As a test set, a subset of 158 images was created (1 image per class). All images were selected with a qindex > 0.7.
Also our CENATAV video database was used. To create the iris database, the videos of the first session were processed and 4 images of each person's eyes were extracted (two from the right eye and two from the left). For the detection of the best images a Qindex> = 1 was used. For the segmentation and feature extraction (FCN +LBP) the implemented pipeline was used. As a test set, an image of each eye per person was taken from the processing by the same scheme described in the videos of the second session. For this, images with four Qindex values were taken (0.7, 1, 1.1 and 1.2).
Tables 4 shows the comparison of the CIR obtained for the first four positions of the list of candidates for MobBio and UTIRIS datasets. The results show how the best results are obtained in the UTIRIS database that contains images with higher quality
Table 4 Experimental results for identification on MobBio and UTIRIS datasets
| Database | CIR at position 1(%) | CIR at position 2 (%) | CIR at position 3 (%) | CIR at position 4 (%) |
|---|---|---|---|---|
| MobBio | 64 | 72 | 75 | 78 |
| UTIRIS | 098 | 99 | 100 | - |
Table 5 shows the comparison of the CIR obtained for the first four positions of the list of candidates for each of the three experimented Qindex values on CENATAV dataset. The results show that as the value of Qindex is increased, the captured images have better quality for identification, when Qindex = 1.2 the identification rate reaches 100% in the first position of the candidate list.
5. CONCLUSIONS
In this paper, we propose a new eye Image Quality Evaluation Approach for Biometric Iris Recognition in the Visible Spectrum. It combines automatic detection methods and a new image quality measure, based on the elements defined in the ISO / IEC 19794-6: 2005 standard, to ensure the high quality of eye images to be processed. We analyzed the relevance of the image evaluation stage as a fundamental step to filter the information generated from the iris video capture. The experimental results showed that the inclusion of the proposed approach within an iris recognition system limits the passage of low quality images to the system, which results in an increase of recognition rates.

