


 Servicios personalizados
 Español (pdf)
 Articulo en XML
 Referencias del artículo
 Enviar articulo por email
 Citado por SciELO
  Similares en
SciELO
Similares en
SciELO 
 Permalink
INTRODUCTION
The southeastern region of Cuba is located in the zone of influence of the Oriente fault, which constitutes a limit of transform plate boundary to the North of the Caribbean region (Figure 1). This fault system is the most active seismogenic zone of Cuba; it is where 85% of the 28 strong earthquakes reported in the island were originated and 20 out of those 28 earthquakes originated to the South of Santiago de Cuba province (Chuy 1999).
Knowledge about the regional seismic hazard and the effects caused by strong earthquakes has demonstrated the importance of conducting vulnerability and seismic risk assessment of engineering works. Some results achieved, related seismic hazard assessment (Arango 2014; Álvarez 2015; Álvarez, Lindholm and Villalón 2017) have been used in several researches to assess seismic risk and vulnerability based on the use of elastic response spectra for each type of soil present in the country (Pérez et al. 2015; Pons & Álvarez 2018).
However, the evolution of seismic engineering has shown that best results, closer to the most likely performance of the structures, are obtained using earthquake signals (acceleration, velocity or displacement) that allow modeling their action with greater accuracy. This criterion is validated by García (2012) who affirms: "the most objective way to measure seismic action within the structure is by applying a direct calculation to it introducing an accelerogram". This method has been used in Cuba, using signals from strong earthquakes generated in other seismogenic zones with similar characteristics and also synthetic seismograms obtained from soil information from structure site (Álvarez 2005; Martín & Elena 2012; Rodríguez 2016).
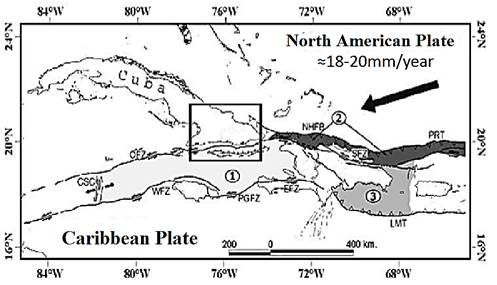
Figure 1 Tectonic context of the northern Caribbean. 1-Gonave microplate, 2. Septentrional Microplate, 3- Puerto Rico Microplate - Hispaniola. NHFB-Northern Hispaniola Fault Basing, OFZ- Oriente Fault Zone, PGFZ- Plantain-Garden Fault Zone, CSC- Cayman Expansion Center, WFZ-Walton Fault Zone. LMT-Los Muertos Trench. PRT- Puerto Rico Trench. EFZ- Enriquillo Fault Zone. SFZ - Septentrional Fault Zone. The black rectangle delimits the eastern region of Cuba. Modified from García (2007) in Arango (2014).
Nowadays, the definition of the records to be used is one of the most complex problems, especially in areas with little information on strong earthquakes. According to García (2012) "getting a set of accelerograms to represent the seismic hazard of the area where a particular structure is projected for a given period of time is not an easy task ..." (p.12). In these areas, it is essential to use methods in order to get signals, artificial or synthetic. The nature of these signals depends on the mechanism of the seismic source; on the wave propagation medium, which includes the local conditions of the site; and on the receiver (Bormann & Bergman 2002).
In this paper, the analysis of some existing methods for strong ground motion simulation and their potential application in seismic risk assessment of structures located in Santiago de Cuba city is presented.
Taking as starting point the previous analysis, the method that most consistently fits with the existing information is selected and example are evaluated for their probable application in the vulnerability studies. The originality of the results is based on the fact that moderate earthquakes (Mw> 4) are used for the first time in Cuba to obtain a set of strong earthquakes.
Background
Hurtado, Barbat and Canas (1996) described the classification of three groups of methods for the simulation of seismic signals: a) based on seismological information; b) based on real records obtained from different earthquakes, and c) formed by all those methods consistent with a given spectrum. These authors proposed a procedure to simulate compatible accelerograms with induced energy spectra because according to them, this spectrum allows to easily consider the effects of the duration of the earthquake in the design, like the stiffness degradation, the resistance deterioration and the progressive increase of the deformation.
On the other hand, Bonett, Pujades and Hurtado (2002) propose a method for accelerograms generation compatible with the real earthquake response spectra and with the design spectra of the Seismic Resistance Code from Colombia and Spain.
Other authors like Orozco, Haarala and Barbat (2006) refer two groups of methods aimed at the artificial accelerograms generation: empirical methods and seismological models, they affirm that the generation models that apply to structural analysis, which have an eminently engineering sense, follow the way of empirical methods. These authors propose a procedure that takes into account the application of empirical and seismological models, establishing the parameters that must be analyzed to control the process of generating signals with certain characteristics.
Gómez, Oller and Barbat (2002), Choi, DesRoches and Nielson (2004), Nielson & DesRoches (2007), Mohseni (2012) and Morejón, Llanes and Frómeta (2018) in order to estimate damages and obtain fragility curves of structures, used synthetic and artificial signals generated with methods that consider the uncertainties of the seismic source, the attenuation laws during wave propagation and the local conditions. These methods are valid for this type of research, however, the attenuation laws used, are obtained from the analysis of soil responses in other geographic areas, therefore the site effect and the transmission trajectory are not considered in the wave signal. Kramer and Scawthorn (2003) additionally explain that attenuation laws depend on regional geology and the inherent characteristics of the earthquake and its source.
Coinciding with the Federal Electricity Commission of Mexico (CFE 2008), García (2012) affirms that one of the most effective methods to simulate strong ground motion for simulating an earthquake of considerable intensity for a given area is using records of smaller events, registered in that same area. This criterion is valid, because it guarantees the mitigation of the uncertainty introduced by the previously analyzed methods by not considering the characteristics of the site and the trajectory of the signal, and consequently its influence on the structure response. The use of records of smaller events makes it possible to guarantee the consideration of the geotechnical characteristics of the site (site effect), the wave’s propagation paths, and some of the characteristics of the seismogenic source.
Hartzell in 1978 introduced the idea of using smaller event logs as empirical Green’s functions, which represent the terrain response, ie, trajectory and site effects (García 2012). Comino et al. (2012) affirm that this method uses events of smaller magnitude as models of propagation between the source and the receiver.
According to Naya, Corboulex and Vallée (2011) this procedure consists of the sum of small earthquake records, used as Green’s functions, to simulate a great magnitude earthquake. These authors express that small earthquakes must have been generated in the same region and have had the same focal mechanism as the strong earthquake to be simulated.
Mayorga (2010), Courboulex et al. (2010) and Comino et al. (2012) have used smaller events as empirical Green’s functions to simulate strong ground motion, and in some cases historical earthquakes occurred in the analyzed zones. However, Hutchings & Viegas (2012) analyzed the main limitations of the use of smaller earthquakes as Green's empirical functions, among them: in virtually all practical applications, there is insufficient number of EGFs to provide, an impulse response for all portions of a fault rupture to be modeled; empirical Green´s functions (EGFs) cannot accurately model variations in focal mechanism solutions and a distribution of stations with good azimuthal coverage is necessary to ascertain the locations and source parameters of the small earthquakes that would provide EGFs.
Reinoso & Jaimes (2009), express that this method has advantages but there are still uncertainties in the estimation of parameters like: the drop in forces, the seismic moment and the attenuation.
The conditions required by this method for its application, as well as the mentioned difficulties, limit its application for obtaining signals for seismic analysis in countries with small seismological networks and moderated seismicity. However, the use of small - and moderate - magnitude earthquakes is assumed to be an effective technique since, in the opinion of the authors, it makes it possible to guarantee the consideration of the geotechnical characteristics of the site (site effect), the wave’s propagation paths, and some of the characteristics of the seismogenic source.
For these reasons, it is preferable to select a method based on the use of lower energy seismogram scaling laws (Gusev 1983). By using these laws and the moderate earthquakes generated in the same fault, there can be obtained strong earthquake signals suitable for behavior analysis of buildings and bridges. The efficient use of these laws for the scaling of seismograms to different magnitudes in regions such as Italy and Latin America has been demonstrated in previous studies by several researches, amongs them: Panza, Romanelli and Vacari (2001), Álvarez et al. (2013), Álvarez (2015) and Morfe et al. (2015).
This method has the essential advantage of allowing considering, in the obtained signals, elements related to the characteristics of the source earthquake, the propagation trajectory of the seismic waves and the effect of site, elements that influence, in a determinant way, the behavior of the soil and with it, the structure.
DATA AND METHODS
The scaling law proposed by Gusev (1983) was derived from various data sources. The main attributes of these data are based on the lack of similarity among them and on the analysis of two characteristic frequency values: around 0.2 Hz and between 5 and 10 Hz. In opinion of the authors of this research article, in this element lies its main advantage since the statistical analysis performed by Gusev (1983) reduces the uncertainty introduced by the use of non-local laws in the modeling of the seismogenic source of simulated earthquakes.
For the scaling of lower energy seismograms recorded in Cuba using the law of Gusev (1983), it is conducted a detailed analysis of the seismicity and the potentialities of each seismogenic zone that could affect the study area, as well as the earthquake records existing in the databases of the Cuban National Seismological Service (SSNC).
To fulfill the proposed objective, the following tasks were done:
Identification and characterization of the seismogenic zones with influence the structures under study.
Selection of the base earthquakes for is scaling.
Selection of the optimal magnitudes to be scaled.
Identification and characterization of the seismogenic zones that influence the structures under study
The structures under study are located in the city of Santiago de Cuba, which represents the biggest exposed to seismic hazard in the country (NC 46 2017). This city is located in the southeastern region of the island, to the north of the Oriente Fault. According to Arango (2014), the sector of the Oriente fault with the greatest influence in the study area is located between 74.90° W and 76.10° W, where the so-called Deformed Belt of Santiago de Cuba is located (Figure 2). This author states that in this sector, which can be considered the most active one of this structure, there have been located earthquakes of great intensity that have historically affected the city of Santiago de Cuba, among which we can highlight those of 1766, 1852 and 1932. Most of the earthquakes registered in this sector of the transcurrent fault system are characterized by the fact that their focal mechanisms present a reverse mechanism, strike slip or a composition of these two (Moreno, Grandison and Atakan 2002, González et al. 2012). In this sector, during the months of January and February of 2016, it was registered the most important seismic activity recorded in Cuba in the present century, whose most important events evidenced inverse type focal mechanisms (see IRIS catalog) .iris.edu / spud / moment tensor (Dziewonski, Chou and Woodhouse 1981, and Ekström, Nettles and Dziewonski 2012).
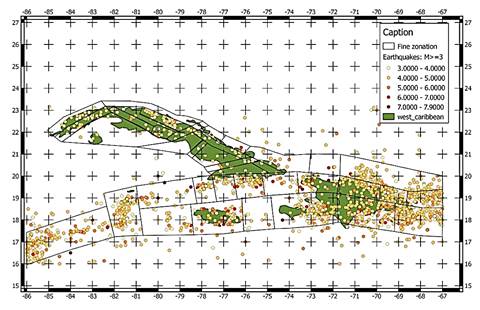
Figure 2 Detailed zoning map for the quantification of the seismic hazard south of the island of Cuba. Source: Álvarez, Lindholm and Villalón (2017).
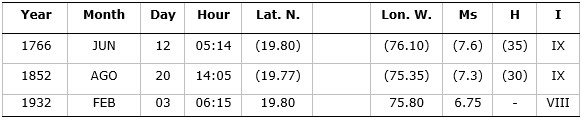
Álvarez, Lindholm and Villalón (2017) assign a maximum magnitude of 7.8 Mw to this sector of the Oriente Fault, however, to be consistent with the values of magnitude of the most important historical earthquakes that have impacted this city (Table 1), the authors consider adopting 7.5 Mw as the maximum magnitude for the scaling of strong earthquakes.
The calculated coordinates for the earthquakes that have produced the highest intensity in the city of Santiago de Cuba (Table 1), allow estimating the locations of the zones where the most important events have been generated. Moderate earthquakes that have been used as a basis for scaling must have been generated in such areas.
Selection of base earthquakes for scaling
The scaling base earthquakes (seismograms and accelerograms) are obtained from the Río Carpintero station (RCC, located at 19.99° N and -75.70° W) of the SSNC (Spanish acronym) network. Founded in 1965, the station is located in an area where there can be observed intrusive rocks (granites) and magmatic rocks from the Formative Structure Association (A.E.F., Spanish Acronym) of the volcanic arch of the Paleogene (Morejón et al. 2007). This description corresponds to the A type soil of the Cuban standard for the design of seismic resistant structures (NC 46 2017). The station is located at a distance from 30 to 90 km of the epicenters determined for the historical earthquakes analyzed, which in turn are located at this same distance from the zone of placement of the structures to be studied.
In order to guarantee that the scaling of the signal is performed only on a signal generated by the seismic events, an analysis of the noise levels present in this site was carried out. In Figure 3 it is observed that the noise levels, from the power spectral density, are among the values allowed by the method of Peterson (1993) and are low in the frequency bands under study.
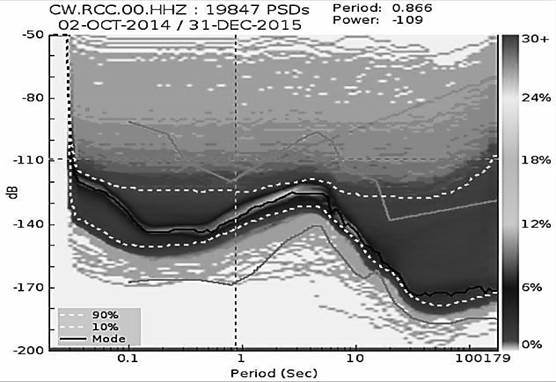
Figure 3 Graph of noise analysis Río Carpintero Station. Santiago de Cuba. The black line represents the average of the measurements made and the continuous gray lines the maximum and the minimum permissible according to Peterson (1993).
The events used as scaling basis have been chosen taking into account the coordinates of their epicenters and their magnitudes, as well as their signal-to-noise ratio in the study frequency band. To this end, there are chosen those that have been generated in areas close to the historical earthquakes (Table 1) and then those whose moment magnitude (Mw) is equal to or greater than 4.0. This last condition is included due to the need of reducing the uncertainty generated by the use of moderate magnitude earthquakes in relation to the spectral load, taking into account that strong earthquakes generate a non-linear behavior of the soil and therefore the spectral charge of the signal differs from that for moderate earthquakes. In opinion of this article authors, the consideration by Gusev scaling law of the effective duration; the effective frequency bandwidth; spectral peak frequency and the corrections factors, to take into account the empirical results from statistical analysis, also contributes to mitigate this uncertainty.
Event processing was performed with the SAC programs (Goldstein 1999) and SeismoSignal 2020.
Selection of optimum magnitudes
The accelerograms are scaled for magnitudes 6.0, 6.5, 6.75, 7.0 and 7.5 Richter, considering the following criteria:
The magnitude of the most important historical earthquakes in the region (Chuy 1999).
The acceleration values established for soils B, C and D in the current code (NC-46 2017) and the maximum magnitude adopted, which according to the hazard studies can show the earthquakes generated in the analyzed seismogenic zone (Chuy et al. 1997; García 2007; Álvarez, Lindholm and Villalón 2017).
The value of 6.75 is taken considering that this was the magnitude of the event that in 1932 affected the city of Santiago de Cuba and that unlike the values for the earthquakes of 1766 and 1852, was calculated instrumentally.
RESULTS AND DISCUSSION
From the analysis of the seismogenic zones of the region, as well as from the SSNC database, three moderate events were selected to be scaled (Table 2). The signals in the three components (vertical, north-south and east-west) of the three earthquakes chosen were processed and scaled, using software created by Álvarez (2009), to the five magnitude values afore mentioned. Fourtyfive accelerograms scaled for rocks (soil A according to the standard NC-46 2017) were obtained. The obtained signals were filtered using a frequency range of 0.3 to 12 Hz, which corresponds to values of periods of 0.08 - 3.3 seconds, which were selected on the basis of the fundamental vibration period of the structures to be evaluated. This analysis is essential because, from the engineering point of view, the signals used in the evaluation of seismic safety must be seismograms or accelerograms that show a significant impact on the structural response, therefore, buildings and bridges, which have higher periods to the above, must be studied with accelerograms obtained for this purpose.
In order to consider the site effect, they were compatibilized with response spectra according to the characteristics of the soil of each structure to be analyzed. These spectra are modeled from an analysis of the seismic hazard of that area and a characterization of the present lithological profile, which must be identified by means of bays (perforations) and geophysical methods (electrical or refraction seismic tomography) (Candebat 2017).
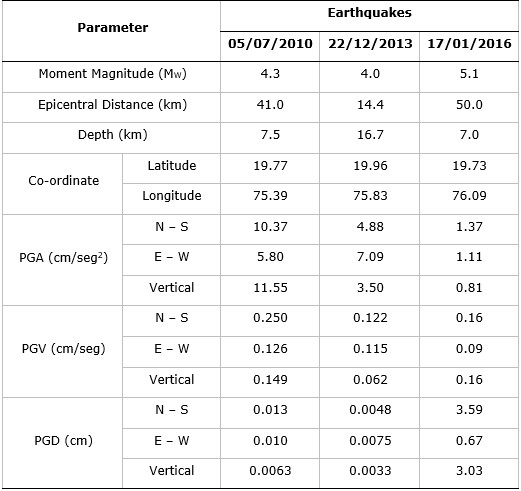
Table 2 Earthquakes selected for scaling. Key parameters (Moment magnitude, peak ground acceleration, velocity and displacement)
From the 45 accelerograms obtained (15 earthquake signals in the three components), there were selected those that meet the following criteria:
Acceleration values that are approximate to those indicated in the design code proposal of seismic resistant structures (NC-46 2017).
Range of periods for the maximum amplitudes that are coincident with the periods of the structures under analysis.
Similarity of their response spectra to those corresponding to the strong earthquakes that can be generated in the Oriente fault, characterized by maximum amplitudes at low periods (high frequencies).
This last condition is based on the fact that nearby (local) earthquakes show their greatest amplitudes at high frequencies (greater than 1 Hz) due to the short length of the seismic wave transmission path that does not allow the filtering of these.
Table 3 lists the fundamental parameters of interest of nine signals (three groups) of earthquakes selected to represent the design or ordinary earthquake for the analysis of bridges considering 75 years of useful life (475 years of recurrence period and 15 % probability of exceedance) for soil type D according to the classification of NC-46 (2017). Soil profile type D is a stiff soil, characterized by a SPT blow count between 15 and 50, undrained shear strength between 50 and 100 kPa and a shear wave velocity between 180 and 360 m/s. The soil surface layer is composed by alluvial soils, underlying a clayey-loam rocky soil. Some of the accelerograms are shown in Figure 4.
Table 3 Main parameters of the obtained accelerograms in the earthquake scale design (475 years of recurrence), for soil type D. NS-north-south component, EW-east-west and Z-vertical
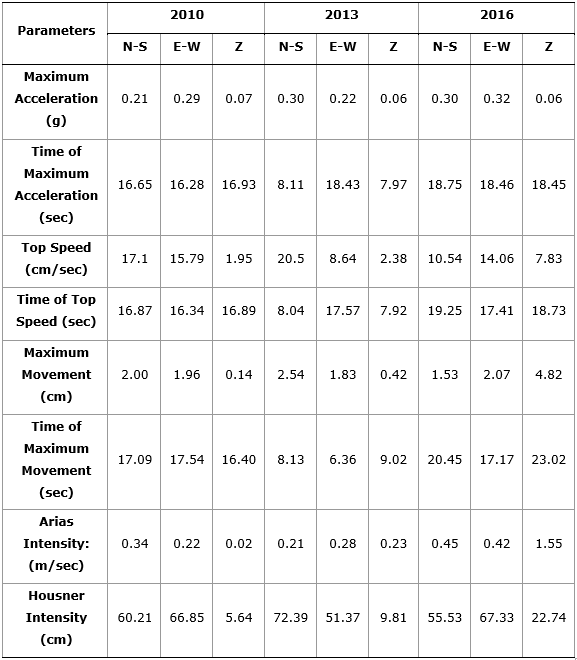
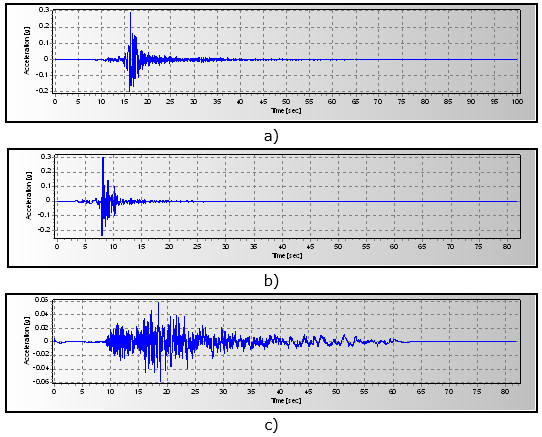
Figure 4 Images of the accelerograms of the scaled earthquakes. a) 05/07/2010, Mw = 6.5, Comp. E-W. b) 22/12/2013, Mw = 6.5, Comp. N-S. c) 17/01/2016, Mw = 7.5, Comp. Z.
The accelerograms obtained are compatible with local seismicity and previous studies of seismic hazard, since the acceleration values that they manifest (see Table 3) are related in a range of ± 15% to the peak ground acceleration value establish by NC 46 (2017) for soil type D (0.273 g). The acceleration values of the vertical component are between 20% and 33% of the horizontal acceleration values. In addition, such compatibility is demonstrated by analyzing the elastic response spectra for the 5% damping (Figures 5), where it is observed that the maximum spectral amplitudes are presented at low period values, validating the similarity of the earthquakes obtained with the characteristics of the strong events that can be generated in the Oriente fault, identified as local events with high frequencies. Similarly, the simulated earthquake spectra present similarities with the horizontal and vertical elastic response spectra for the 5% damping, constructed according to the requirements of NC-46 (2017).
Concerning Housner and Arias intensities, Orozco and Alfaro (2008) affirm that they are parameters used to determine the earthquake intensity.
Arias Intensity expresses the energy contained in the accelerograms so, according to Li, Kotronis and Wu (2017) “is very effective in representing the damage potential of a ground motion” (p. 2). However, Orozco and Alfaro (2008) have demonstrated that not always these parameters describe appropriately the mentioned damage potential of the earthquake ground motion.
More specifically, others authors like Céspedes, Boroschek and Ruíz (2019) state that an increase in the earthquake magnitude involves an increase in the Arias Intensity but, on the other hand, a greater rupture distance involves a reduction in the Arias Intensity. Additionally, the results obtained by Liu et al. (2016) reveal that Arias Intensity- Peak Ground Acceleration (PGA) correlation is a function of earthquake magnitude and Vs30. Thus, is not suitable to establish a direct relationship between PGA and Arias Intensity.
In this specific research, most of the values of Arias Intensity shown in Table 3 are contained in the value range obtained by Pardo (2014) for shallows soil sites, from 0.11 to 0.32 m/sec for corresponding PGA values from 0.12 g to 0.20 g. Also they are contained in the interval from 0 to 3 m/sec for soil sites, presented by Peláez; Delgado and López (2005).
Regarding Housner Intensity, is defined by Garinis and Gazetas (2012) as the integral of the pseudo-velocity spectrum over the period range [0.1 s, 2.5 s]. The values obtained are consistent with those PGA values of simulated earthquakes.
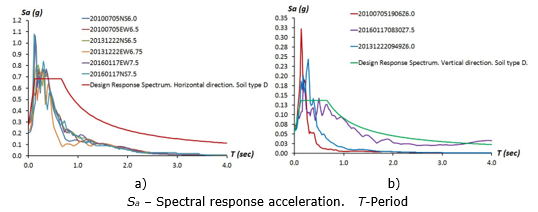
Figure 5 Elastic response spectra for 5% damping. 475 years of return. a) Horizontal direction. b) Vertical direction.
In relation to the structural analysis, the response spectra show that the maximum amplitudes of the earthquakes obtained are in period intervals of 0.10 sec. - 0.60 sec. These values are consistent with the periods manifested by the most common structures in the city of Santiago de Cuba: buildings up to five floors, single and double-level dwellings and reinforced concrete bridges with moderate height. Consequently, by performing linear and non-linear dynamic analysis based on these accelerograms, it is assessed a seismic action that, because of its frequency, influences the appearance of damages in such structures.
On the other hand, Figure 5 also shows a difference among the design response spectrum from NC-46 (2017) and the response spectra of simulated earthquakes, for periods greater than 0.60 sec. This difference is based on its own characteristics. According to Rajasekaran (2009) “A response spectrum is a jagged plot of peak response of all possible SDOF systems, and hence is a description of a particular ground motion. A design spectrum is smooth and is the envelope of the different elastic response spectra” (p. 651-652). This author state that “In general, the response spectrum and the design spectrum do not yield the same result since the former represents the response to a specific earthquake, while the latter represents only the predicted response to an earthquake having the same PGA (peak ground acceleration)” (p. 652).
CONCLUSIONS
There are several methods to obtain synthetic signals that can be used in structural seismic studies. However, the scaling of low-magnitude earthquakes occurred and registered in the area object of analysis, guarantees the consideration of the engineering and geological conditions of the medium, the site effects and the characteristics of the seismogenic source.
The accelerograms obtained fulfill the desired characteristics for the analysis of engineering works with low periods (high frequencies). This aspect is considered to be significant, since these accelerograms allow personalizing the analysis using signals that show a significant incidence in the damage to these structures.
The response spectra for soil type D of the simulated earthquakes are contained in the design response spectrum developed according to the specifications of NC 46 (2017). This fact ensures the proper consideration of the seismic hazard that characterizes the study area. However, there are some differences among them, relative to their maximum amplitudes and their corresponding periods. These are reasonable differences supported by their own characteristics since the design response spectrum is the envelope of the different elastic response spectra.
The period values to which the greatest amplitudes of the earthquakes obtained manifest, correspond to those that characterize most engineering works in the city of Santiago de Cuba: buildings of up to five structural levels, houses of one and two levels and bridges of moderate height.

