


 Servicios personalizados
 Inglés (pdf)
 Articulo en XML
 Referencias del artículo
 Enviar articulo por email
 Citado por SciELO
  Similares en
SciELO
Similares en
SciELO 
 Permalink
Introduction
The progressive increase in the quality of life achieved by humanity in the 20th and 21st centuries has been carried out by the use of resources and energy to the limit of putting at risk their availability for future generations. Faced with this situation, and with the emergence of the concept of sustainable development, governments have taken action trying to stop the contemporary environmental crisis. In this context, cleaner production (CP) arises, which, as Vieira &Amaral (2016), comment, can be defined as a process of continuous improvement that seeks an efficient use of natural resources while reducing the environmental impacts of processes, products and services thus generating benefits for organizations.
According to the United Nations Environment Program CP presents a preventive approach to environmental management and considers the economic and technological restrictions of organizations in the minimization of environmental impacts. It is characterized by seeking actions that lead to a more rational use of raw materials and in parallel to a more efficient management of wastes (Mantovani, et al., 2017). Among its benefits Urbaniec, et al. (2017), point out that the implementation of CP programs allow companies a better understanding of their industrial processes, as well as constant monitoring of these to preserve and develop eco-efficient production systems. In addition, they can also be integrated with quality, environmental and occupational safety management systems, providing improvements in the whole management systems.
When considering resources, water has always been of special interest since it undoubtedly plays a fundamental role for life, in addition to being inherently scarce. Approximately 97% of the water on the planet is salty and the distribution of the fresh fraction is quite uneven between regions. Due to its physical and chemical characteristics it is prone to contamination, and even in the case when scarcity is not a problem, it is usually necessary to spend large amounts of energy to transport it, or in order to obtain the appropriate quality for different applications (for example: the generation of steam in systems industrial). Therefore, it is undeniable that a proper water management plays a fundamental role in the analysis of sustainability in production systems. For this reason it is important to apply with this resource the same hierarchy as with other raw materials in the search for solutions for savings which, in order of importance are: (1) avoid its use or reduce its consumption from the source, (2) recirculation and reuse, (3) recycling towards less demanding processes and (4) treatment to an acceptable level for its final disposal (Valdés, et al., 2019).
Gomes da Silva & Gouveia (2020), highlight that the reuse of water in its current form is a concept that can be innovative in global terms, although it has been practiced empirically for more than five millennia in water courses and river basins around the world. However, Asano, et al. (2007), point out that this phenomenon is influenced by various factors such as opportunity and need, droughts, the reliability of water supplies, urban expansion and the perception of security, as well as by political will. For this reason, in spite of significant advances in this field, a very conservative response is still observed in the business community, ignoring that the implementation of CP strategies for saving water can bring benefits not only in improving the corporate image, but also economically.
The lack of water in Cuba was identified for the first time as one of the main environmental problems in the 2007-2010 National Environmental Strategy, even though when Cuban hydraulic development had risen considerably in the preceding decades. The combination of natural and anthropogenic factors, as well as the worsening of climate change impacts condition that the issue of water is a determining element to sustainability analysis. Traditionally cement, oil, sugar and food industries are among the most water consuming in the country; however, given the constant urban growth Valdés, et al. (2020), alert that the construction materials industry is increasingly significant. In this sector, sandstone washing plants stand out because the available technology, in addition to being outdated, it has suffered decades of exploitation.
Therefore, it is necessary to analyzed possible improvements in these systems to achieve a more efficient use of resources. Then, the objective of this research is to carry out a technical-economic analysis of possible alternatives for the recovery of wastewater in a sandstone washing plant, taking into consideration the socioeconomic conditions of the province of Cienfuegos, Cuba.
Materials and methods
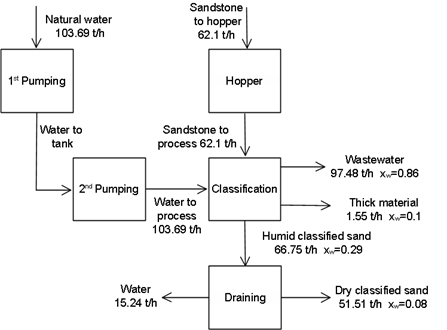
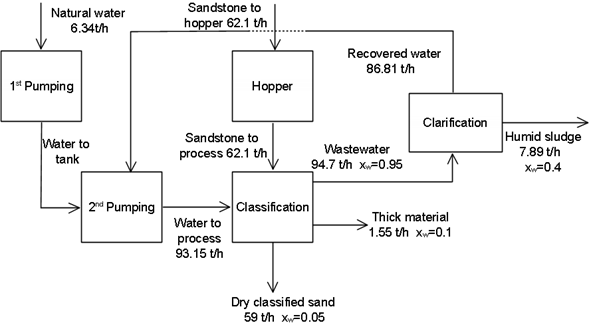
The objective of the analyzed plant is the classification of sandstone. The current installed technology is the mechanical classification by worm screw which allows obtaining a product size in the range 0.15 mm-5 mm. The plant has a capacity of 62.1 t/h for which it requires 103.69 t/h of water. The water is transported from a natural reservoir over a considerable distance, so this process is carried out in two pumping stages. The coarse fraction of the aggregate with a size higher than 5 mm is separated by a screen and it is used as filler to mitigate the environmental impact of the mining process. The fraction of the product with size less than 0.15 mm gets lost in the wastewater, and due to these are not recovered, they represent approximately 80% of the natural water incorporated into the process. A material balance for the current process is shown in Fig. 1.
Torres (2010), points out that with the introduction of centrifugal classification, the efficiency in the use of resources in these systems can be improved because it allows to obtain a fraction up to a particle diameter of approximately 63 µm. This alternative (A1) would consist of replacing the mechanical classifier with a hydrocyclone and adding a gravity settler to recover part of the wastewater. According to Bouso (2008) water consumption of hydrocyclones in this type of processes ranges between 1.5 m3 to 3.5 m3 per ton of sand to be treated, the solids content in wastewater ranges between 5% to 10% by weight for an adequate work of the settler, and in this operation a residual sludge with a moisture content of 40% by weight is obtained. The efficiency of the classification increases up to 95%, however, even higher values have been reported depending on the characteristics of the aggregate (Torres, 2010).
In addition to the previous operations, another alternative (A2) consists of recovering part of the water contained in the sludge through a filtration process. According to Bouso (2008) the moisture content of the sludge can be reduced to a value of 30% by weight in filtration cycles requiring between 10 min and 60 min depending on the filter and sludge characteristics. Therefore, due to the high water consumption of the current technology and the loss of a considerable fraction of product in the wastewater, it is believed that the implementation of these more efficient technologies would have a positive economic impact because it would increase productivity requiring a lower consumption of energy carriers.
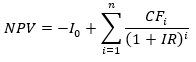
Then, in order to analyze the economic feasibility of the technological alternatives proposed for the recovery of wastewater in the process described the steps outlined below were followed. Initially, a material balance was made which served as the basis for sizing the equipment to be introduced in the technological alternatives. Then, to determine the capital investment, the Hand method explained in Sinnot & Towler (2020), was used. The potential economic benefits of the introduction of each alternative were estimated according to an incremental analysis and as economic indicators the Net Present Value (NPV), the Discounted Cash Flow Rate of Return (DCFROR) and the Payback Period (PBP) were analyzed. Finally, as the value of these indicators are stochastic by nature their uncertainty was determined modeling the variables which influence their results using probability distributions and conducting a Monte Carlo simulation.
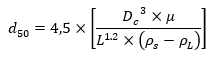
In order to size the hydrocyclone, equations 1 and 2 showed by Sinnot & Towler (2020), were used where d is the selected particle diameter (µm), d50 is the particle diameter (µm) for which the equipment is 50 % efficient, Dc is the diameter of the hydrocyclone chamber (cm), L is the feed flow rate (L/min), ρ L is the density of the liquid (g/cm3), 𝜌 𝑆 the density of the solid, 𝜇 the liquid viscosity (cP) and 𝜂 the efficiency of the equipment in separating any particle of diameter d (%). It was considered that d = 63 μm, the density and viscosity of water are 𝜌 𝐿 =0.997047 g/cm3 and μ=0.89 cP (Haynes, et al., 2017), and the density of sandstone 𝜌 𝑠 = 2.3 g/cm3, average value for this mineral reported by Green & Southard (2019).

To estimate the area of the settler, the Archimedes number was first calculated according to equation 3 where d is the diameter of the particle to settle (60x10-6 m), ρ the density of the water (997.047 kg/m3), g the acceleration due to gravity (m/s2), ∆ρ the difference in densities between the solid (2620 kg/m3) and the fluid and μ (0.89x10⁻³ Pa×s) the viscosity of the fluid. Knowing the Archimedes number, the terminal velocity of a single particle was estimated according to equation 4, which is valid for all flow regimes according to Darby and Chhabra (2017). This velocity was corrected according to equation 5 where φ is the solids volume fraction, considering that fine particles behave differently compared to coarse particles due to for the most critical case (bottom of the equipment) sedimentation is hampered by the clumping of solids. Finally, as a settler is designed to separate the solid particles from the clarified flow, at all times it must be fulfilled that the liquid rising rate (Q0/A) must be less or equal than the particle settling rate (Q0/A≤Vs), therefore, the area was estimated by equation 6, highlighting that this is an approximation since for a more rigorous design, laboratory sedimentation tests (jar tests) are necessary, as pointed out by Concha (2014).


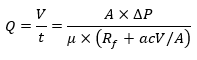
In order to size the filter, it was considered that it operates at constant rate of filtration. It was used equation 7 to estimate the filtering surface where α is the specific resistance of the cake (m/kg), Rf the resistance of the filter medium (m-1), c the weight of solids/ volume of liquid (kg/m3), µ the viscosity (Pa×s), ΔP the pressure diference (Pa), V the volume of filtrate (m3) and t the time of operation (s). The parameters α y Rf are constants of the equipment and slurry and must be evaluated from experimental data but as an estimate were assumed the reported by Couper, et al. (2012), for a similar system (colloidal clay). It was also assumed that the filter medium is sintered metal with 8μm of pore size and 6 mm of thickness (Rf=6×10⁹ m-1).
Finally, the pump was selected from the graphs in appendix H presented by Darby & Chhabra (2016), with the premise of maximizing the efficiency at which the equipment works.
To apply the Hand method, it is necessary to estimate the purchase equipment costs; then a factor (Table 1) is applied to obtain the installed cost and finally, these costs are summed to give the battery-limits installed cost. The costs were updated until 2020 through the indices reported by Chemical Engineering magazine as shown in equation 8 and as an additional expense for transportation, 10% of the purchase equipment cost was assumed as recommended by Peters, et al. (2003).
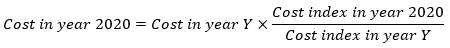
Table 1 - Hand Factors.
| Equipment type | Installation factor |
|---|---|
| Compressors | 2,5 |
| Distillation columns | 4 |
| Fired heaters | 2 |
| Heat exchangers | 3,5 |
| Instruments | 4 |
| Miscellaneous equipment | 2,5 |
| Pressure vessels | 4 |
| Pumps | 4 |
Source: Sinnot & Towler (2020).
According to Peters, et al. (2003), the most accurate method for determining process equipment costs is to obtain firm bids from fabricators or suppliers, however, in their absence, estimates can be made based on size parameters. In the case of hydrocyclone (CH) and settler (CS), the purchase costs were estimated using equations 9 and 10 respectively, both presented by Seider, et al. (2017). These are valid for hydrocyclones with liquid feed rate (Q) in the range of 8 gal/min-1200 gal/min and for settlers with a settling area (A) in the range 80 ft2-8000 ft2.


The purchase cost of the filter press was estimated, presented by Green & Southard (2019), and the purchase cost of the pump was calculated according to equation 11 taken from Couper, et al. (2012), where Cb and FT are calculated using equations 12 and 13. In these, Q is the capacity of the pump (gal/min) and H the head (ft). Parameters b1, b2 and b3 depend on the characteristics of the pump such as the number of stages and the specific speed, while FM is used to correct the cost based on the material used for the construction of the equipment. In the research, stainless steel was assumed as material, so FM = 2.

The selected profitability indicators were calculated according to equations 14, 15 and 16 where I0 is the initial capital investment, CFi the cash flow in year i and n the time horizon considered (10 years). The interest rate (IR) was represented as a triangular distribution where the minimum, mode and maximum values for annually percent are ten, twelve and fifteen percent respectively.
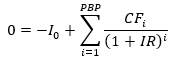
The cash flows (CF) for year i were determined by equation 17 where R, C, D and t are
The revenue, cash operating expenses, depreciation and tax rate respectively. Depreciation was considered linear and 35% was assumed for the tax rate as stipulated by the Cuban Tax System Law. The cash operating expenses were neglected due to the high degree of automation of the analyzed systems that hardly need personnel for their operation.

As income, the economic benefits of implementing the alternatives proposed were considered, which are given by: the increase in productivity, the saving of energy carriers (water and electricity) as well as the reduction in the discharge of wastewater. To avoid the discharge of wastewater allows to avoid the expenses for the concept of taxes but also due to the expense of fuel and services for the cleaning of the evacuation channels
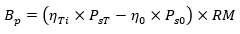
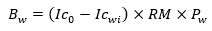
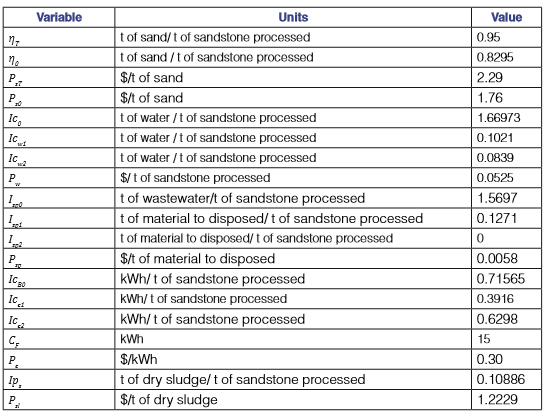
The benefits for the increase in productivity (Bp) were calculated using equation 18 where 𝜂 𝑇𝑖 and 𝜂 0 are the efficiency in the classification with the proposed alternative i and in the current technology respectively, RM is the raw material processed annually in the plant (t/year) and 𝑃 𝑠𝑇 and 𝑃 𝑠0 are the price of sand in the market using the proposed alternatives and current technology. The difference between the prices is based on the fact that with the centrifugal classification a higher quality aggregate is obtained. Similarly, the benefit for saving water was calculated (equation 19), where 𝐼𝑐 0 and 𝐼𝑐 𝑤𝑖 are the water consumption indices (tones of water / tons of sandstone processed) of the current technology and the proposed alternative, while 𝑃 𝑤 is the cost of water.
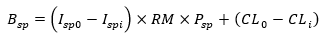
The benefits of avoiding wastewater discharge was estimated using equation 20 where 𝐼 𝑠𝑝0 and 𝐼 𝑠𝑝𝑖 are the amount of wastewater disposed to the environment per ton of sandstone processes in the current technology and proposed alternatives, 𝑃 𝑠𝑝 is the tax per tons of water discharged, while CL0 and CLi are the cost of cleaning the discharge channels in the current and proposed alternatives.
The potential savings in electrical energy are given by avoiding the transportation of water from the natural deposit which is located far from the plant. In the current technology the energy spend for each stage of pumping was measured determining the energy consumption in the pumping of natural water to the tank (CB1), and the pumping to incorporate the water into the process (CB2). Then the total energy used in the pumping process divided by ton of sandstone processed ( 𝐼𝑐 𝐵0 ) was calculated using equation 21 where Qnw is the mass flow rate of natural water pumped (t of water/h), Qpw mass the flow rate of water incorporated into the process (t of water/h) and C the capacity of the plant (t of sandstone/h).

In the case of the new alternative i, the energy consumption per ton of sandstone processed (kWh/t) is given by equation 22 where the amount of natural water and water incorporated into the process are updated depending on the technological variants, CBri is the energy consumption for recirculate the water into the process and CF the energy consumption in the filtration process in alternative two. The way to estimate CBr is shown in equation 23 where Vwr is the volume of water to be recirculated by alternative i, CEbi the capacity of the pump (m3/h) and PBi the installed power of the equipment. Then the energy savings due to water transport is estimated using equation 24 where 𝐼𝑐 𝐵0 and 𝐼𝑐 𝑒𝑖 are the energy consumption per ton of sandstone processed (kWh/t) and 𝑃 𝑒 is the cost of energy.


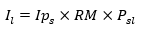
An additional income in the second alternative is the sale of dry sludge. Equation 25 presents the way for its estimation where 𝐼𝑝 𝑠 is the amount of dry sludge produced per ton of sandstone processed and 𝑃 𝑠𝑙 is the price of this byproduct ($/t).
As it is almost impossible to forecast the amount of raw material to be processed annually (RM) for each year of the time horizon considered, this parameter was modeled using a uniform distribution in the interval [225 333-240 462] t/year. These values are the lowest quantity and an average of the material processed by the entity in recent years. Once these data were known, a Monte Carlo simulation was carried out in 100,000 scenarios.
Results and discussion
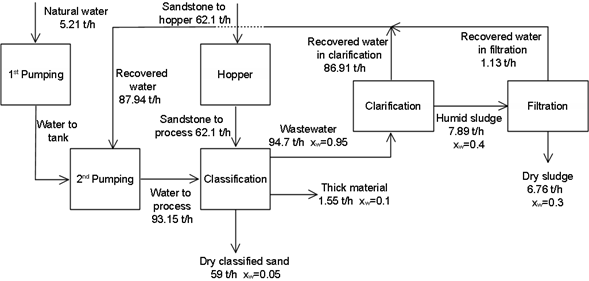
Fig. 2 and 3 show the material balances of the possible alternatives for the recovery of water in the sand washing process. It is remarkable that when process water is recovered the use of natural water decreases from the current value of 1.67 t water/t of sandstone to 0.1021 t water/t of sandstone in alternative one and 0.0839 t water/t of sandstone in alternative two. It is also significant that with these technologies it is possible to produce approximately 0.1206 more tons of product per ton of processed aggregate, which is important to extend the useful life of the mine and as well as for a more efficient use of this resource.
It was found through measurements in the process that approximately 67% of the electrical energy consumed is due to the transportation of water, where more than 56% is consumed in the first pumping stage. In the first pumping stage is used 0.2411 kWh/t of pumped water while 0.1875 kWh/t of pumped water is used in the second stage. Energy not directly associated with production is estimated at 33%. Due to this considerably high value, it is necessary to investigate more deeply the facilities in order to identify its cause, as well as possible alternatives for its reduction.
The pump selected in the graphs presented by Darby & Chhabra (2017), for water recirculation is 4LR-II model. The capacity of the equipment recommended is 90 m3/h for an oversizing less than 5%. According to Couper, et al. (2012), for a 1760 rpm one-stage pump, b1=5.1019, b2=-1.2217 and b3=0.0771. The installed power of this model ranges from 5 hp to 20 hp and approximately for the given conditions its value is 7.5 hp (5.52 kW). Table 2 shows the design parameters and the purchase cost of the equipment for the analyzed technological proposals. Then, according to these results, after applying Hand's method, the required capital investments for the alternatives are $335 114 and $1 747 022 respectively.
Table 2 - Technical specifications of the equipment.
| Equipment | Size parameters | Purchased cost ($) |
|---|---|---|
| Hydrocyclone | Q=530.24 gal/min | 6658 |
| Dc≈50 cm | ||
| Settler | A=28.5729 m2 (307.5566 ft2) | 100 898 |
| Pump | Q=396.258 gal/min | 13 529 |
| H= 50 ft | ||
| Filter Press | A=6.3 m2 | 543 037 |
Table 3 shows variables necessary to estimate the potential benefits of the proposed alternatives. It can be seen that the use of energy carriers is reduced in both alternatives, however although the filtration favors less water use, this is done at the expense of higher energy expenditure. This happen because this type of equipment presents a high energy demand as highlighted by Sinnot & Towler (2020), which in the process studied is in the order of 30-40% of the energy used directly in production. On the other hand, historical records show that $ 14 185/year are spend in order to clean the discharge channels 6 times per year as an average. According to the amount of solids discharge in the wastewater it was estimated that with the implementation of alternative 1 the frequency of cleaning can be reduced in half while in alternative 2 this activity it is not necessary.
The histograms of the profitability indicators for the first alternative can be seen in Fig. 4 while in Table 4 it is presented their statistical summary. As the NPV is strictly positive in all the analyzed scenarios, there is a strong incentive to carry out the investment, also considering that the investment is recovered quickly (PBP <3 years).

Table 4 Statistical summary of the Monte Carlo simulation for alternative one.
| NPV ($) | DCFROR | PBP (years) | |
| count | 100000 | 100000 | 100000 |
| mean | 517984.3 | 0.4446 | 2.7233 |
| std. | 35728 | 0.0035 | 0.0605 |
| min | 422453 | 0.4335 | 2.5459 |
| 25% | 492142 | 0.4421 | 2.6800 |
| 50% | 519233.9 | 0.4446 | 2.7202 |
| 75% | 543527.2 | 0.4472 | 2.7644 |
| max | 613695.8 | 0.4561 | 2.9364 |
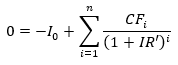
According to Turton, et al. (2018), the DCFROR is defined as the interest rate at which all the cash flows must be discounted in order to the Net Present Value of the project to be equal to zero; therefore it represents the highest after-tax interest or discount rate at which the project can just break even. The decision heuristic considering DCFROR is to accept the alternative when the Minimum Attractive Rate of Return (MARR) is equal to or higher than the DCFROR (Blank & Tarquin, 2018) however when this research was carried out the MARR was unknown. Because of that the DCFROR was compared with the suggested values of MARR as a function of risk (Table 5). It can be verified that the risk in this alternative is almost zero and the project should be accepted.
Table 5 - Suggested values for risk and MARR.
| Investment description | Level of risk | MARR (after income taxes) %/year |
|---|---|---|
| Basis: Safe corporate investment opportunities or cost of capital | Safe | 4-8 |
| New capacity with established corporate market position | Low | 8-16 |
| New product entering into established market, or new process technology | Medium | 16-24 |
| New product or process in a new application | High | 24-32 |
| Everything new, high Research & Development (R&D) and marketing effort | Very high | 32-48+ |
Source: Peters, et al. (2003).
In the case of alternative two, the profitability indicators were unfavorable given that for all scenarios NPV << 0. For this reason, it is not profitable to recover the water from the residual sludge according to local socioeconomic conditions. Table 6 shows the potential benefits percentage related to the total revenue for each alternative. As expected, the increase in productivity is the factor with the highest relevance, but it is significant that the benefit due to energy carrier’s savings does not exceed 20%, and the savings due to avoiding the discharge into environment is less than 1%. This is given by the differences between the prices of the resources, as can be seen in Table 3. Also due to the lower environmental taxes, which according to Vilaseca & Cruz (2018), although they constitute a modest contribution to the protection of the environment practically play symbolic measure.
Table 6 - Percentage contribution of potential economic benefits.
| Potential Benefit | A1 | A2 |
|---|---|---|
| Average of the total economic benefit ($/year) | 217 258 | 239 428 |
| Increased in productivity (%) | 76.54 | 69.58 |
| Water saving (%) | 8.83 | 8.12 |
| Electricity saving (%) | 10.44 | 2.51 |
| Saving due to avoided discharge (%) | 4.19 | 6.82 |
| Benefit of selling dry sludge (%) | 0 | 12.97 |
Therefore, although alternative two closes the materials cycle and achieve an increase in economic benefits in the order of 22 170 $/year compare to alternative one, this is not enough to cover the capital investment. On the other hand, as the cost of water is low and the potential benefits due to avoiding the discharge of wastewater will be low too, it is important that Cuban ministries responsible for environmental protection and economic regulation establish dialogues to close this gap, which will contribute to encourage the business sector to search for benefit-cost alternatives. This is consistent with the sustainable development objectives and with the efforts of the government to achieve a better environmental protection policy.
Conclusions
The use of centrifugal classification in the sand washing process is economically attractive. For its execution an initial capital investment of $ 335 114 is required, being recovered in less than 3 years. With this technology 1.56763 t of water/t of sandstone processed and 0.32405 kWh/ t of sandstone processed are saved in the analyzed plant. In addition, the increased in productivity allows to obtain an additional 0.1205 t of sand/ t of sandstone processed which condition a better performance of the plant, both economically and environmentally.
Although the recovery of the water contained in sewage sludge is a common practice globally under local socioeconomic conditions this process is not economically viable. This result is influenced by the low cost resources, specially water, and the negligible tax for its discharge. Therefore, government agencies should analyze this problem because it hinders the incentives in order to companies to look for benefit-cost alternatives that promote a higher protection of the environment.

