


 Servicios personalizados
 Inglés (pdf)
 Articulo en XML
 Referencias del artículo
 Enviar articulo por email
 Citado por SciELO
  Similares en
SciELO
Similares en
SciELO 
 Permalink
Introduction
The use of renewable energy sources, such as solar, is fundamental to mitigating climate change and achieving sustainable production systems. Although new technologies have been developed to improve the efficiency of photovoltaic systems, their implementation remains a challenge in the energy transition. However, the solar energy market has grown significantly due to cost reduction and environmental concerns (Carrera et al., 2023; Guzmán et al., 2017; Carrera et al., 2021).
The sun is a sphere of 1.39 × 10⁶ km in diameter and is located, on average, 1.5 × 10⁸ km from the Earth, its interior is like a nuclear fusion reactor where hydrogen is continuously converted into helium. Only 4.5% of the solar irradiance reaching the Earth’s surface is ultraviolet radiation: 43 % is visible and 53 % is infrared (Chakrabarti, 2019; Collado, 2022; Liu et al., 2023; Louwen & Sark, 2020), which allows for a large potential of energy to be harnessed.
The PV solar cells that make up a PV module can be connected in series and/or in parallel. However, the efficiency of these components decreases with increasing temperature. As the temperature increases, the short-circuit current of the cells increases while the open circuit voltage decreases, resulting in a reduction of the power generated. In addition, the efficiency of the cells is significantly affected by concentrated sunlight and partial shading, which can lead to hot spots and irreversible damage to the PV modules, ideally for such systems a trade-off between decreasing and increasing short-circuit current and open-circuit voltage is achieved as the so-called maximum power points (Ebhota & Tabakov, 2023; Hosseini et al., 2023; Panda & Gupta, 2023; Rouholamini et al., 2016).
The orientation of photovoltaic systems (PV systems) is crucial for their efficiency. Deviations of 48° from the optimal azimuthal angle can cause energy losses of 5%, while deviations of 21° from the optimal tilt angle can generate the same losses. These results vary by location (Abdelaal & El-Fergany, 2023; Al-Ghussain et al., 2023; Carrera et al., 2023; Jing et al., 2023).
It is essential to assess the feasibility of any PV system before its installation, considering its estimated performance. Various methods are employed for this assessment, such as numerical modeling, geo-parameter analysis, and experimental modeling. Simulation with power modeling tools, such as PVsyst, SketchupPro, PVGIS, PV Watts, SISSIFO, and RETScreen, is the most popular approach (Cox et al., 2023; Modu et al., 2023; Shrivastava et al., 2023).
From the above, it can be seen that irradiance, relative humidity, outdoor and working temperature and all this linked to the geolocation and layout angles of the SSFVs have a great influence on their efficiency and at the same time on the energy production. Therefore, it is of great importance to achieve the best characteristics and arrangements for the same, which can make the difference between the feasibility and closure of projects of this type. Therefore, this research aims to achieve an efficient sizing and an accurate analysis of all these variables in a case study, so that it can be replicated and taken into account for future projects. The objective of this research is to calculate the photovoltaic generation potential from the use of the roof surfaces of buildings using PVSyst simulation.
Materials and methods
For the study, a methodology was developed that allows the energy analysis of the installation based on the ISO 50001 standard and, at the same time, an analysis and sizing of a PV system, taking into account technical characteristics to achieve greater efficiency than common sizing (Figure 1) (Abo-Khalil et al., 2023; Hassan et al., 2023; Iturralde et al., 2022; Iturralde et al., 2023).

The company under study belongs to the agricultural sector and is located in the following areas with geographical coordinates 22.149410 0N, - 80.442323 0E, in the city of Cienfuegos. Table 1 shows the monthly and average meteorological data.
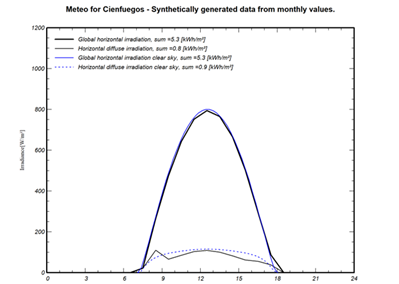
Table 1 Meteo for Cienfuegos. Synthetically generated data from monthly values.
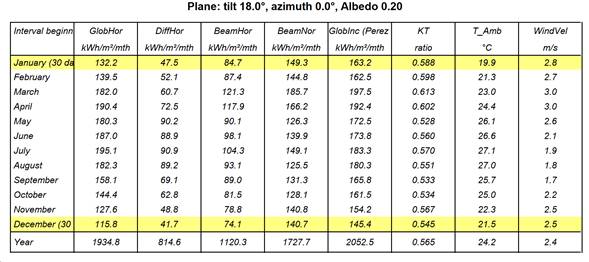
Source: Own production.
Figure 2 shows the behavior of the different types of irradiation throughout the day, as can be seen, horizontal irradiation is the most favorable for the most efficient operation of the solar modules.
Technical characteristics and analysis of the photovoltaic module to be used:
Mono-Crystalline PERC HALF CUT (550Wp)
Half-Cut Mono PERC solar modules contain solar cells that are split in the middle which causes it to have improved performance and durability. The main benefits of these types of cells are that performance-wise they can increase the panel efficiency by a few percentage points in addition to having better production numbers they are smaller in size and have more resistance to breaking (Tables 2, 3 and 4).
The thing about smaller cells is that they have reduced mechanical stresses, which allows them to have less chance of breaking. These types of panels have a higher output and are more reliable than conventional solar panels.
Half-cut cells can resist shade effects more than traditional solar panels due to the wiring methods used to connect the half-cut cell inside the panel.
Table 2 - Mechanical characteristics.
| Cell type | Mono-crystalline PERC 182x91 mm (Half-Cut) |
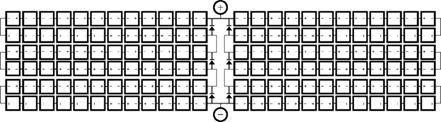
| Number of cells | 6x24 (144pzs) |
| Dimensions | 2 278x1 134x35 mm |
| Weight | 28 Kg |
| Frontal crystal | 3.2 mm of tempered glass |
| Frame | Anodized aluminum alloy |
| Encapsulating | Crystal/EVA/Cell/EVA/TPT |
| Relative humidity | 0 to 100% |
| Maximum static charge |
5 400 Pa (front side) 2 400 Pa (backside) |
| Connection charge | IP 68, three diodes, compatible connector with MC4 |
| Exit cable | 4m m 2 , 450mm or 1200 mm |
| Fire resistance | UL: Type 1, IEC: Class C |
Source: Own production.
Table 3 - Temperature coefficient.
| The nominal operating temperature for the cell | 45ºC + 2ºC |
| Maximum potency temperature | -(0.35 + 0.05) %/ºC |
| Open circuit voltage temperature | -(0.27 + 0.02) %/ºC |
| Short circuit current temperature | +(0.05 + 0.005) %/ºC |
| Maximum fusible current | 25 A |
Source: Own production.
Table 4 - Electrical properties.
| STC | STC | STC | STC | STC | |
|---|---|---|---|---|---|
| Module type | 540 M | 545 M | 550 M | 555 M | 560 M |
| Open circuit voltage (V) | 49.41 | 49.61 | 49.8 | 49.87 | 50.02 |
| Short circuit current (A) | 13.86 | 13.93 | 13.98 | 14.08 | 14.14 |
| Optimum circuit voltage (V) | 41.54 | 41.77 | 41.95 | 42.14 | 42.29 |
| Optimum circuit current (A) | 13 | 13.05 | 13.12 | 13.17 | 13.24 |
| Maximum operating power | 540 W | 545 W | 550 W | 555 W | 560 W |
| STC module efficiency | 20.90% | 21.12% | 21.31% | 21.48% | 21.68% |
| Operation temperature | -40 ºC to +85 | ||||
| Maximum system voltage | 1 500 V DC | ||||
| Exit potency tolerance | 0 ~ + 5 W |
Source: Own production.
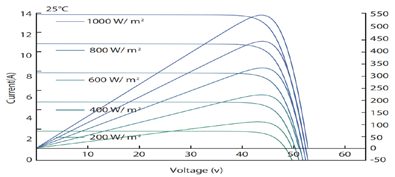
Figure 3 shows the behavior of the modules at different working ranges, which is fundamental at the time of being selected so that it can cover on a larger scale the geographic characteristics of the site and at the same time take it into account for the type of arrangement and equipment to be used. It can be observed that the maximum power points are around 40-50 V of open circuit working voltage, which has the greatest variation in the short circuit current at different irradiations and working temperatures, which allows us to achieve a subsequent arrangement of the system with greater accuracy and better prediction in the generation of electricity by the system.
The 6x24 array for 550 Wp generation allows maximum use of the available space in the solar module. By arranging the cells in an array, the efficiency of converting sunlight into electricity per unit area is optimized. It is a commonly used arrangement in solar photovoltaic modules and offers a good combination of efficiency, generation capacity, and space utilization (see Figure 4).
Calculations of the entity's photovoltaic generation potential. Proposed sub-arrangements for buildings
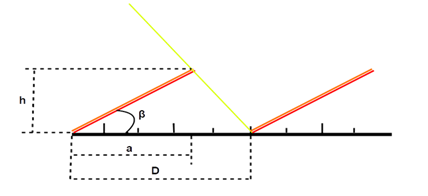
To calculate the PV system, it is essential to determine some key parameters for its sizing. The following are the distances and spacing between modules to be taken into account (see Figure 5):
Available area for photovoltaic modules: The space required for the placement of the solar panels must be taken into account, considering the creation of aisles between modules. These aisles ensure greater accessibility for the maintenance of the modules and their components. In this study, the aisles are estimated at the ends of the roof surface, at a distance of 0.5 m along the length and width of the roof.
Distance between rows of modules: For flat roofs or terrains (because the roof surfaces are not inclined horizontally), it is necessary to determine the distance between the rows of modules. This distance, measured horizontally and denoted as D, between rows of modules or between a row and an obstacle of height h that can cast shadows, can be calculated by the following expression:
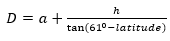
Ec.1
Donde:
 Ec.2
Ec.2
Ec.3
 length of modules or objects that cast shadows.
Results and discussion
Figure 6 presents the structure of energy carriers for the case study company in 2021 based on a Pareto diagram. The consumption is expressed in Tons of Conventional Fuel (TCC). As can be seen, diesel and electricity together account for 96.72% of this company's total carrier consumption.
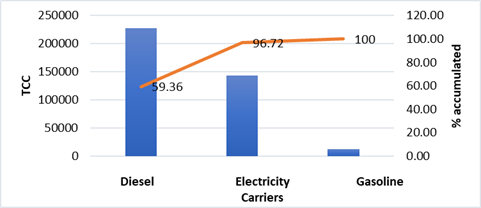
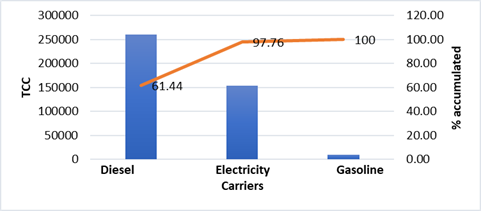
Figure 7 presents the structure of energy carriers for the year 2022 based on a Pareto diagram. As can be seen, diesel and electricity together represent 97.76 % of the total consumption of carriers of this company, very similar to what is represented in the year 2021.
In this study, based on an administrative request, the characterization of electrical energy will be developed to propose a set of measures to improve energy efficiency. This case study does not have any similar energy study so far, so it serves as a basis for future research on the subject.
Characterization of energy consumption. General direction
Figure 8 shows that the UEB with the highest electricity consumption is January I, a hatchery with significant technological equipment. Such energy consumption of 98 694.15 kWh/year and 96 435.30 kWh/year represented for the company 21.4 % in 2021 and 19.47 % in 2022 respectively.
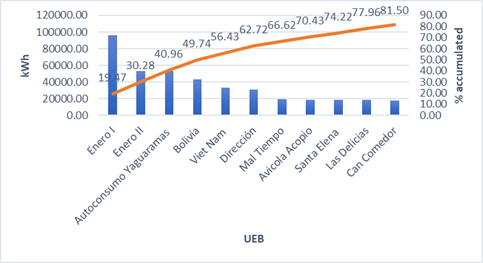
Even though the general management of the company is not positioned within the five large UEB consumers of electric energy, this management presented the proposal to update the situation in terms of energy management based on this study.
Sizing of the Photovoltaic Installation
In the process of sizing the photovoltaic installation, it is crucial to consider the maximum consumption of electrical energy by the institution under study in this work. After our analysis, we have determined that the company in question has an annual consumption of 495 267 kWh, which is equivalent to an approximate daily consumption of 1 356. 89 kWh. By taking into account the peak solar hours associated with Cuba, which are 4.7 hours, we can calculate the power required to size the installation, which amounts to 288.70 kW.
To satisfy this peak power, it is necessary to select suitable photovoltaic panels and inverters. Based on this calculation, 510 PV panels with a peak power of 550 Wp each would be required. Although the peak solar hours method does not guarantee exact dimensioning, it provides a sufficient approximation to establish a first proposal.
In this context, the use of two inverters with a nominal power of 113 kWac each is recommended to ensure an optimal energy supply and an efficient operation of the PV system. It is proposed to install 255 photovoltaic panels for each of these inverters, which have been previously described in detail. The connection of the photovoltaic panels to the corresponding inverter will be carried out in such a way as to meet the minimum requirements to ensure the safe and efficient operation of such devices.
The configured photovoltaic arrays were integrated into the professional software PVSyst, which allows simulating the performance of the sized systems taking into account the specificities associated with the geographical location of the institution under study. The results obtained during the execution of the tests to evaluate the performance of the proposed photovoltaic system are detailed below. Figure 9 shows how the generation of the proposed installation behaves together with the losses generated due to the operation of the inverters and the panels that make up the arrays. The data provided are normalized according to the peak power sized for the installation and are limited to daily production.
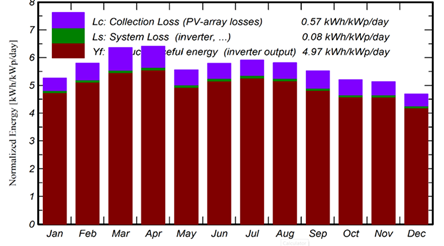
It was found that the highest normalized production obtained corresponds to the first half of the year, which is justified by the fact that during this time a certain radiation is obtained on the surface of the panels together with the existence of low temperatures, which guarantees that the losses caused by the heating of the photovoltaic panels decrease.
Table 5 below presents the estimated monthly generation of the proposed photovoltaic installation and compares it with the average monthly consumption of the institution, which was set at 41 272 KWh.
Table 5 - Monthly generation of the proposed photovoltaic installation.
| Month | Electrical Energy Generated (kWh) | % Corresponding to monthly average |
|---|---|---|
| Enero | 41 205 | 99.83 |
| Febrero | 40 214 | 97.43 |
| Marzo | 47 500 | 115.08 |
| Abril | 46 789 | 113.36 |
| Mayo | 42 912 | 103.97 |
| Junio | 43 470 | 105.32 |
| Julio | 45 864 | 111.12 |
| Agosto | 44 940 | 108.88 |
| Septiembre | 40 601 | 98.37 |
| Octubre | 39 883 | 96.63 |
| Noviembre | 38 578 | 93.47 |
| Diciembre | 36 460 | 88.34 |
| Total | 508 416 | 102.65 |
Source: Own production.
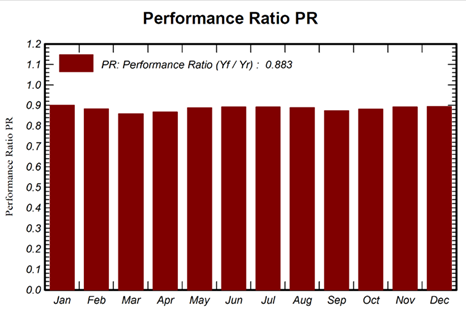
The results reveal that the proposed facility is capable of satisfying more than 85% of the entity's electricity demand, with December showing the lowest percentage of satisfaction. In general, the proposed facility proves to be capable of fully meeting the entity's electricity demand, since the annual generation of the system covers 102.65% of the annual electricity demand requested by the entity. One way to evaluate the performance of the facility is by using the performance ratio that characterizes it. Figure 10 shows the behavior of this parameter every month throughout a calendar year, with an average value of 0.883. This value indicates that the sizing was carried out adequately.
Conclusions
This study offers a significant contribution to the field of solar PV system implementation in Caribbean buildings by presenting an efficient and novel methodology to integrate these systems efficiently.
It highlights the importance of conducting a detailed energy study and a comprehensive analysis of the characteristics of the buildings to identify the potential for photovoltaic generation and ensure an efficient and cost-effective implementation of solar systems.
The results obtained show that the proposed installation of photovoltaic solar panels can cover more than 100 % of the facility's energy demand, which underlines the feasibility and effectiveness of the proposed methodology.
The PVSyst simulation showed that the company has an available building roof area of 1 317 m2, an area where it is possible to install a total of 510 photovoltaic modules, with a generation capacity of 281 kWp and a real annual generation of 508 416 kWh/year. This photovoltaic installation is capable of covering 102.65 % of the facility's energy demand.
These conclusions highlight the relevance of this study as a reference for future solar energy implementation projects in Caribbean buildings, providing a solid and replicable model that can contribute significantly to the transition towards cleaner and more sustainable energy in the region.

