


 Servicios personalizados
 Articulo en XML
 Referencias del artículo
 Enviar articulo por email
 Citado por SciELO
  Similares en
SciELO
Similares en
SciELO 
 Permalink
INTRODUCCIÓN
Chocolate is amongst the most popular favour worldwide and it is prepared by different technologies with cocoa products as main raw material mixed with other ingredients. Therefore, the flavour of cocoa products (cocoa powder, cocoa butter or cocoa liquor) is one of the most important organoleptic attribute which impacts its quality. The pleasant flavour of cocoa is mainly the result of bean genotype, geographical origin, and post-harvest treatments (fermentation and drying), roasting and storage (Afoakwa et al., 2008; Kongor et al., 2016).
Cocoa processing manufacturing is an important industry producing cocoa products and chocolate, but which also generate great amounts of wastes (Afoakwa, 2016). Some of these residues could provide other innovative by-products attractive to the food industry, and such is the case of cocoa husk, which can be used to yield high-value-added products as a source of valuable natural substances due the presence of polyphenols with antioxidant activity and theobromine with many stimulatory effects, and dietary fibers (Nguyen & Nguyen, 2017). Considering its intense cocoa flavour, another interesting probable use is as flavouring material.
Headspace solid-phase microextraction (HS-SPME) has been widely used to analyse the composition of food flavours (Jeleń et al., 2012; Souza-Silva et al., 2015). HS-SPME is a solventless technique, with simplicity and effectiveness in rapid sampling, as well as high sensitivity and reproducibility, therefore simplifying and speeding up sample preparation and analysis standardization. HS-SPME is a valuable tool for preparing samples for gas chromatography(olfactometry (GC-O) analysis, which is a procedure for the detection of aroma-active compounds in foods (Feng et al., 2016).
HS-SPME has been applied to evaluate the volatile compounds from several cocoa products and chocolate, such as cocoa mass (de Brito et al., 2002), cocoa powders and chocolate (Ducki et al., 2008), dark chocolate (Afoakwa et al., 2009), cocoa liquors (Pini et al., 2004; Di Carro et al., 2015), cocoa beans (Rodriguez-Campos et al., 2011, 2012; Tran et al., 2015), cocoa products and chocolate (Ascrizzi et al., 2017), and microencapsulated cocoa liquor (Sanchez-Reinoso et al., 2017). In some of those studies the isolation conditions were optimised because difference in the matrix of the samples generally influences the composition of the headspace, but in those reports (de Brito et al., 2002; Pini et al., 2004; Ducki et al., 2008; Rodriguez-Campos et al., 2012) the optimal conditions were selected bearing in mind only the highest number and content of volatile compounds without considering the sensory response of the HS-SPME isolated fraction.
The aim of the present research was to investigate the typical volatile compounds found in cocoa husk and their contribution to the aroma of this by-product using HS-SPME and GC-O analysis. This investigation optimised the analytical conditions, so that they can be reproduced in other researches and for quality control.
MATERIALS AND METHODS
Materials and sample
The SPME holder for manual sampling and fibers used were purchased from Supelco (Bellefonte, PA, USA). Fibers tested were 100 μm polydimethylsiloxane (PDMS), 85 μm Carboxen/polydimethylsiloxane (CAR/PDMS), 65 μm polydimethyl-siloxane/divinylbenzene (PDMS/DVB) and 50/30 µm divinyl-benzene/Carboxen/polydimethylsiloxane (DVB/CAR/PDMS).
A representative sample of cocoa husk (30 kg) was obtained from the major Cuban company Derivados del Cacao Baracoa (Guantánamo, Cuba). Cocoa beans were roasted in the proper industry by a progressive heating until 150 oC was reached (total roasting process time 20 min). The raw material was ground and sieved to a finely powder with a mean diameter of 550 ( 21 (m. The ground material was packed in 1-kg portions in polyethylene bags and stored at 25 oC until analysis.
Headspace solid-phase microextraction procedure
Extractions were performed in 8-mL vial PTFE/silicone septa vials (Supelco, Bellefonte, PA, USA) with 0.2 g of ground sample conditioned for 10 min at the selected temperature. The fiber was then exposed to the headspace for the selected time. To determine optimal extraction conditions of the HS-SPME technique: fiber type, extraction time and temperature were evaluated. Four fibers; extraction time (15, 20 and 25 min) and temperature (40, 50 and 60 oC) were tested. For the selection of the fiber, some initial conditions were fixed: 10 min pre-extraction and 20 min extraction at 60 oC. All analyses were made in triplicate for each sample.
Gas chromatography-mass spectrometry analysis
Gas chromatography-mass spectrometry analysis was carried out using a QP-2010 Ultra (Shimadzu, Japan) equipped with a FID and DB-5 ms (30 m × 0.25 mm i.d., 0.25 μm film thickness; J&W Scientific, Folsom, CA, USA) capillary column. Oven temperature was held at 50 oC for 2 min, increased at 4 oC/min up to 230 oC and held for 10 min. Carrier gas was helium at 1 mL/min. Thermal desorption was carried out at 250 oC for PDMS, PDMS/DVB and DVB/CAR/PDMS fibers, and at 280 oC for CAR⁄PDMS fiber in splitless mode for 2 min, using and inlet liner of 0.75 μm i.d. The mass spectrometer was setup with the source at 250 oC, electronic ionization energy 70 eV and the mass range from 35 to 350 u.
Compounds were preliminarily identified using NIST05, Wiley 7, NBS 75k, ADAMS 2001 and in-house Flavourlib mass spectra databases, then the identities of most were confirmed by comparison of their linear retention indices, relative to C6-C28 n-alkanes, with those of reference standards or with reported data in (NISTwebbook, 2020). Relative concentration was calculated based on the area of the corresponding GC peak. Each measurement was conducted in triplicate.
Direct SPME-Gas chromatography-Olfactometry
SPME-GC-O was performed following the methodology described earlier (Pino & Roncal, 2016). A HP-6890 (Hewlett-Packard Co., Palo Alto, CA, USA) was used. The injector was connected via a deactivated fused silica capillary (25 cm × 0.25 mm) to a sniffing port consisted of a cylindrically shaped aluminium device with a bevelled top and a central drill hole housing the capillary. The oven was maintained at 250 oC. Because no chromatographic separation was carried out by the short capillary, volatile compounds arrived simultaneously at the sniffing port. Three trained sniffers perceived and evaluated the resulting global odour. Sniffers were asked to smell first the ground cocoa husk (1 g) contained in a plastic cup sealed with a pierced cap at 25°C and memorise the odour. Then they evaluated with the direct GC-O device the different SPME extracted samples, rating their similarity to the reference using a 10-cm line scale ranging from 0 (close to the reference) to 10 (far from the reference). Panelists had to smell the reference before each sample evaluation. All analyses were replicated three times.
Gas chromatography-olfactometry analysis
Gas chromatography analysis was performed in a HP-6890 (Hewlett-Packard Co., Palo Alto, CA, USA) fitted with the same capillary column and GC setup used in GC-MS. The end of the capillary column was connected to a deactivated Y-shaped glass splitter dividing the effluent into two equal parts, which were transferred via two deactivated fused silica capillaries (25 cm × 0.25 mm) to a sniffing port and an FID, respectively. Two trained sniffers (replaced at 30 min intervals to avoid fatigue) evaluated the effluents.
An approach of the analysis extract dilution analysis (AEDA) developed for GC-O analysis of roasted pistachios to estimate the odour contribution of the volatile compounds was applied in the present study (Aceña et al., 2011). A series of sequentially reduced samples of cocoa husk (0.2(0.0016 g, each trial half the weight of the preceding trial) were subjected to SPME(GC(O. To these amounts were assigned FD factors of 2, 4, 8, 16, 32, 64, and 128. For each analysis, panelists recorded the detection time and gave an odour description until no odours were perceived in the GC(O effluent. The last dilution step where an odourant was detected was its flavour dilution (FD) factor. To check the linear recovery of the procedure previously described, the total peak area of the GC analyses of the initial sample and the successively reduced samples was measured and correlated with the proper sample reduction.
Statistical analysis
Results for fiber selection were processed by one-way ANOVA and Duncan’s multiple range test.
The optimisation of the HS-SPME procedure was evaluated by response surface methodology. The response evaluated during the experiments was the total peak area from the volatile compounds by the GC-FID analysis. The experimental factors extraction time and temperature were evaluated by a 2-factor-3-level design with four replicates at the centre point was selected using Design-Expert 8.07 (Stat-Ease Inc., Minneapolis, MN). The second-order polynomial models were assessed by the analysis of variance, determination coefficients and test for the lack of fit. Numeric optimisation was made to find a stationary point set as maximum total peak area.
RESULTS AND DISCUSSION
Selection of fiber coatings
Different types of HS-SPME fibers were compared for the extraction of the volatile compounds from cocoa husk: PDMS, CAR/PDMS, DVB/CAR/PDMS, and PDMS/DVB. In general, GC-MS analyses showed that more than 200 volatile compounds were isolated by the four fibers. The extracted components with LRI from less than 700 (LRI = 645 for acetic acid) to almost 2200 (LRI = 2197 for ethyl octadecenoate). A total of 169 of them were identified (Table 1), including 28 acids, 23 esters, 22 pyrazines, 16 terpenes, 12 ketones, 8 alcohols, 3 aldehydes, among others. These volatile compounds have been reported in previous studies related to cocoa products (Counet et al., 2002; Pini et al., 2004; Serra-Bonvehí, 2005; Frauendorfer & Schieberle, 2006; Krings et al., 2006; Ducki et al., 2008; Rodriguez-Campos et al., 2011, 2012; Tran et al., 2015; Di Carro et al., 2015; Sanchez-Reinoso et al., 2017; Ascrizzi et al., 2017).
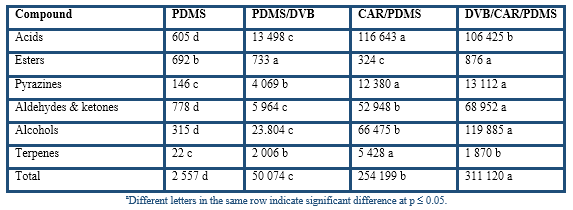
The chromatographic areas of several constituents grouped according to their chemical nature (Table 2) clearly indicate that the apolar PDMS fiber had the lowest affinity whereas the DVB/CAR/PDMS fiber had the highest affinity for the volatile compounds from cocoa husk. The dual-coated fiber only was overcome by the CAR/PDMS fiber in the extraction of acids and terpenes; however, it had the highest extraction of pyrazines, aldehydes and ketones, which has been related to chocolate and cocoa odours (Counet et al., 2002; Frauendorfer & Schieberle, 2006; Krings et al., 2006). Nevertheless, considering that this study was to develop a procedure based on the use of HS-SPME-GC-O to analyse the volatile compounds from cocoa husk, it is important to evaluate the global odour of the extracts at the sniffing port. The similarity scaling resulted for the four SPME global odours with respect to the reference sample were DVB/CAR/PDMS (1.0 ± 0.3), PDMS/DVB (3.3 ± 0.2), CAR/PDMS (6.2 ± 0.3), and PDMS (8.3 ± 0.4). Therefore, the DVB/CAR/PDMS fiber was selected to characterize the volatile compounds from cocoa husk based on the use of SPME-GC-O.
Selection of temperature and extraction time
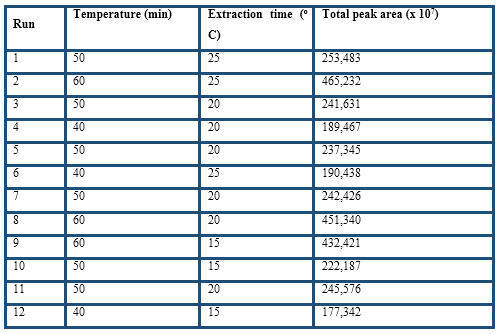
The experimental factors extraction time and temperature were evaluated by response surface methodology considering total peak area as the response, which is one of the most useful parameters for the optimisation of the HS-SPME conditions (Table 3). The regression model with coded values for the variables is given by the following equation:
Y = 2.42 × 10⁵ + 1.32 × 10⁵ A + 1.29 × 10⁴ B + 4.93 × 10³ AB + 7.86 × 10⁴ A 2 + 3.98 × 10³ B 2
where Y is the total peak area, A is the coded temperature and B is the coded extraction time.
The F-value was highly significant (p ( 0.001) and the lack of fit F-values was not significant, whereas the determination coefficient (R2) was 0.99. Therefore, the fitted model was suitable to assess the response variables as function of the selected factors.
Both factors were significant and their positive values indicate that by increasing them, the total peak area increased too. Higher extraction temperatures were not considered because Pini et al. (2004) found that for temperatures higher than 60 ºC, Maillard reactions are likely to occur in cocoa samples. From the 15 predicted solutions, the optimal values for temperature and extraction time were 60 oC and 22 min, respectively, were selected. At this point, the desirability function hits the maximum value of 0.99 and the highest total peak area was obtained. Therefore, the selected conditions were: DVB/CAR/PDMS fiber, 0.2 g ground cocoa husk, 10 min pre-extraction, extraction at 60 oC for 22 min, and GC desorption at 250 oC in splitless mode for 2 min.
Other reported optimum HS-SPME conditions were extraction at 60 oC and 45 min for cocoa mass (de Brito et al., 2002) and cocoa liquors (Pini et al., 2004), 60 oC and 15 min for cocoa and chocolate powders (Ducki et al., 2008), and 60 oC and 30 min for cocoa beans (Rodriguez-Campos et al., 2012). These differences in extraction time should be explained considering the different type of matrix analysed in each study. Thus, the high fat content in samples like cocoa mass and liquor causes a low release of volatile compounds affecting their extraction (Ducki et al., 2008).
GC-O analysis
With the SPME technique, no physical extract is obtained contrary to other conventional techniques and therefore, the usual AEDA cannot be practical. However, the AEDA approach based of the analysis of sequentially reduced samples from the initial sample could be a valuable tool for ranking aroma-active compounds according to their relative odour potency. The linear recovery of the volatile compounds was confirmed via correlation of the total peak area of the GC analyses of the initial sample and the successively reduced samples with the ratio 1/FD factor. The determination coefficient (R2) was 0.99, significant at p ( 0.001. No bias was found because the confidence limits of the independent variable included the zero. Likewise, the slope of the line resulted significantly different from zero, and hence there is proportionality of the chromatographic response. Because there were no deviations from the linear trend in total peak areas, it was assumed that this procedure can be applied to assess FD factors of the aroma-active compounds considering the last sample reduction.
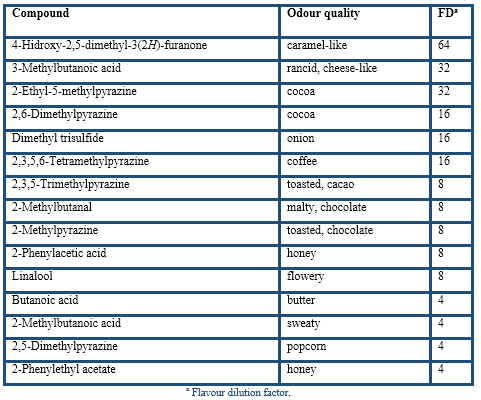
Under the HS-SPME optimum conditions the cocoa husk was analysed by the described AEDA (Table 4). The results yielded 21 aroma-active compounds in the FD factor range of 4(128, so they are probably very important to the aroma of cocoa husk. According to their chemical group, the most aroma-active compounds in cocoa husk were 9 pyrazines, 5 acids, 3 Strecker aldehydes (3-methylbutanal, 2-methylbutanal, and phenylacetaldehyde), and one furanone (4-hidroxy-2,5-dimethyl-3(2H)-furanone), sulphur-compound (dimethyl trisulfide), terpene (linalool) and ester (2-phenylethyl acetate). Compounds with the highest FD factors (128(64) were acetic acid, 2,3-diethyl-5-methylpyrazine, and 2-ethyl-3,5-dimethylpyrazine followed by 3-methylbutanal, phenylacetaldehyde, 3,5-diethyl-2-methylpyrazine, and 4-hidroxy-2,5-dimethyl-3(2H)-furanone. A somewhat lower FD factors of 32(16 were found for 3-methylbutanoic acid, 2-ethyl-5-methylpyrazine, 2,6-dimethylpyrazine, dimethyl trisulfide, and 2,3,5,6-tetramethylpyrazine. A last group, with FD factors of 8(4, was constituted by 2,3,5-trimethylpyrazine, 2-methylbutanal, 2-methylpyrazine, 2-phenylacetic acid, linalool, butanoic acid, 2-methylbutanoic acid, 2,5-dimethylpyrazine, and 2-phenylethyl acetate.
These results confirmed the important role of acids, pyrazines, and Strecker aldehydes in the aroma of cocoa husk. Excepting linalool and acids, the rest of volatile compounds were related to the thermal degradation during roasting of cocoa beans where the Maillard reactions occur (Belitz et al., 2009).
In good agreement with most of the earlier studies in cocoa products (Serra-Bonvehí, 2005; Krings et al., 2006; Frauendorfer & Schieberle, 2006, 2008; Liu et al., 2017) these volatile compounds were found as potent odourants.
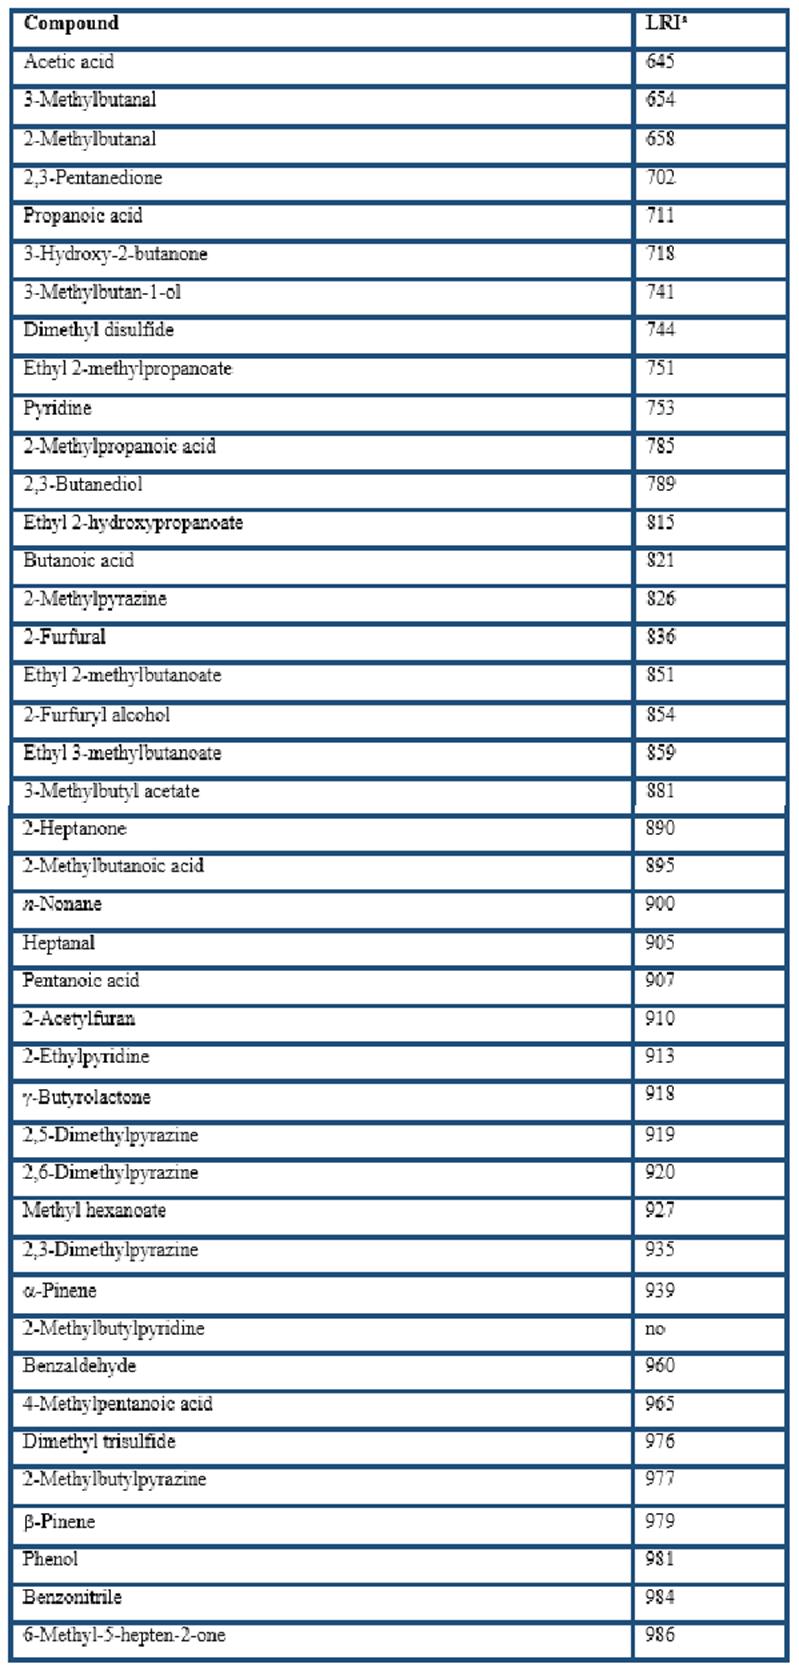
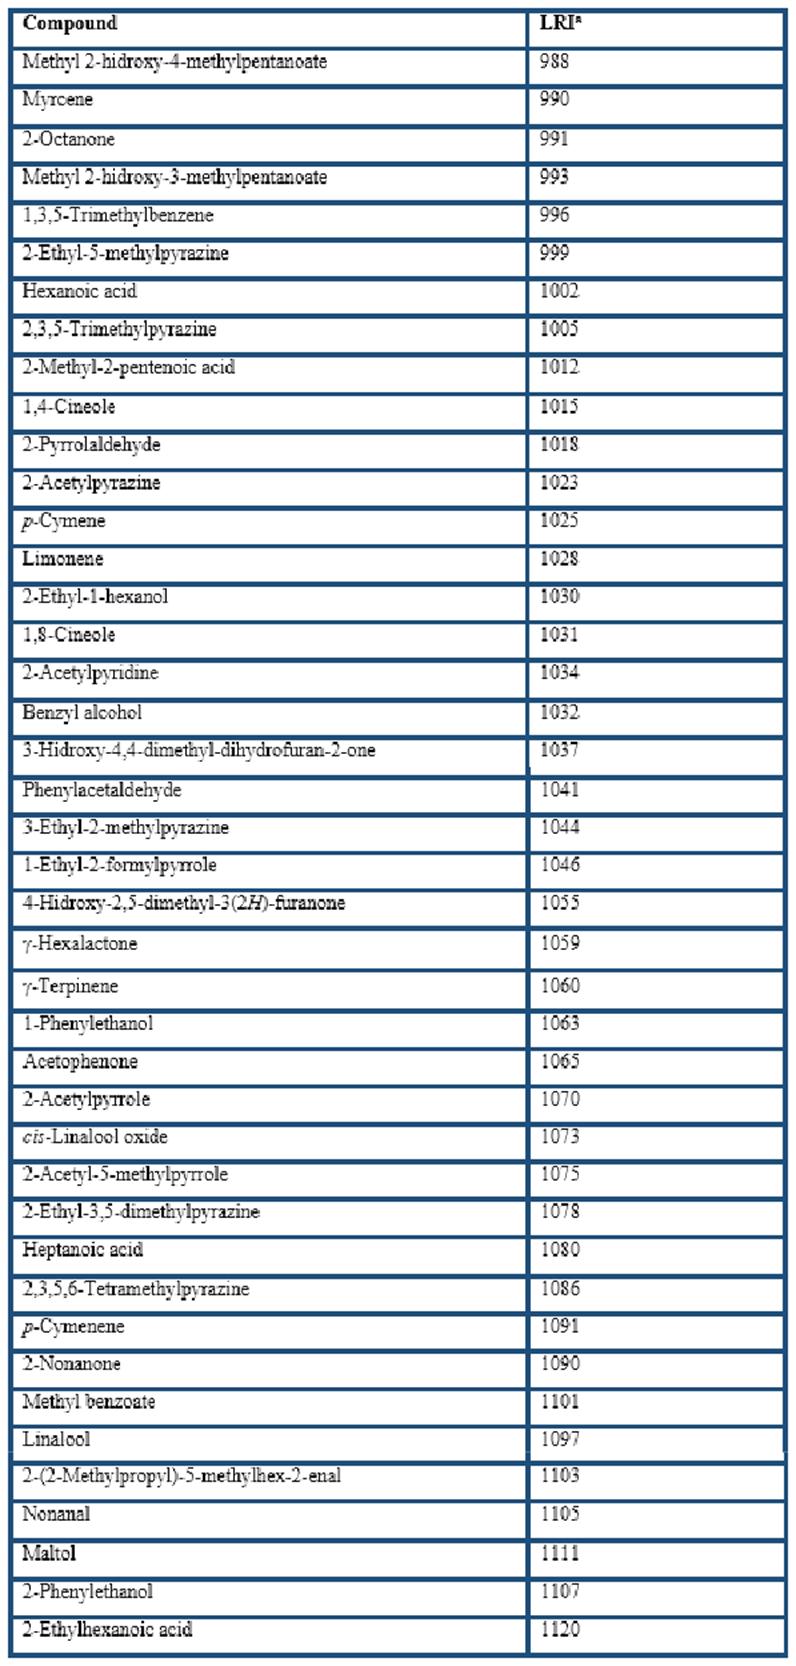
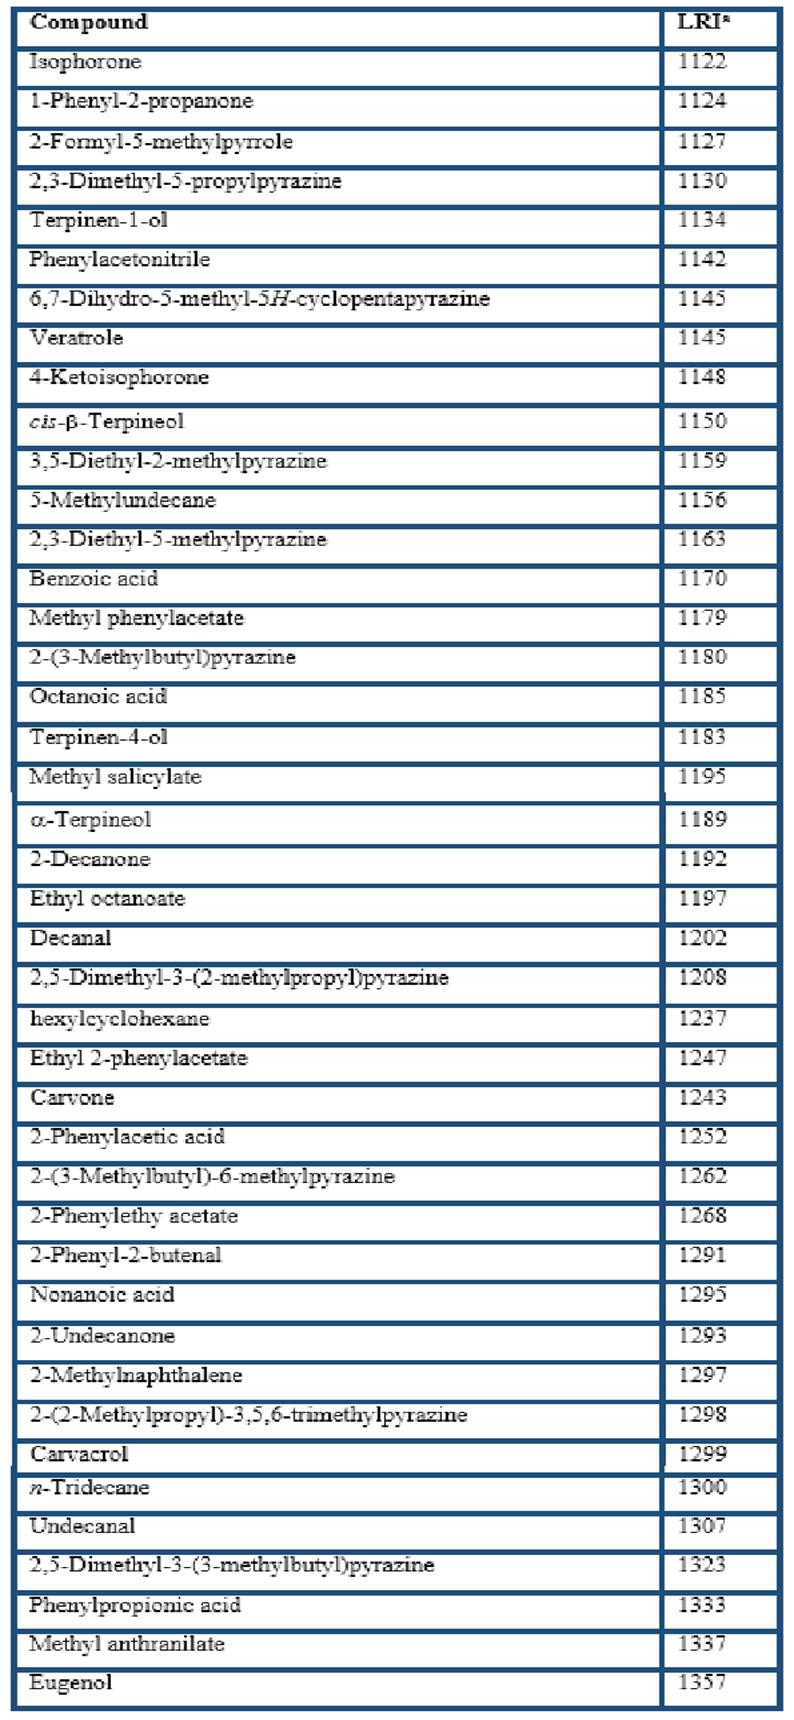
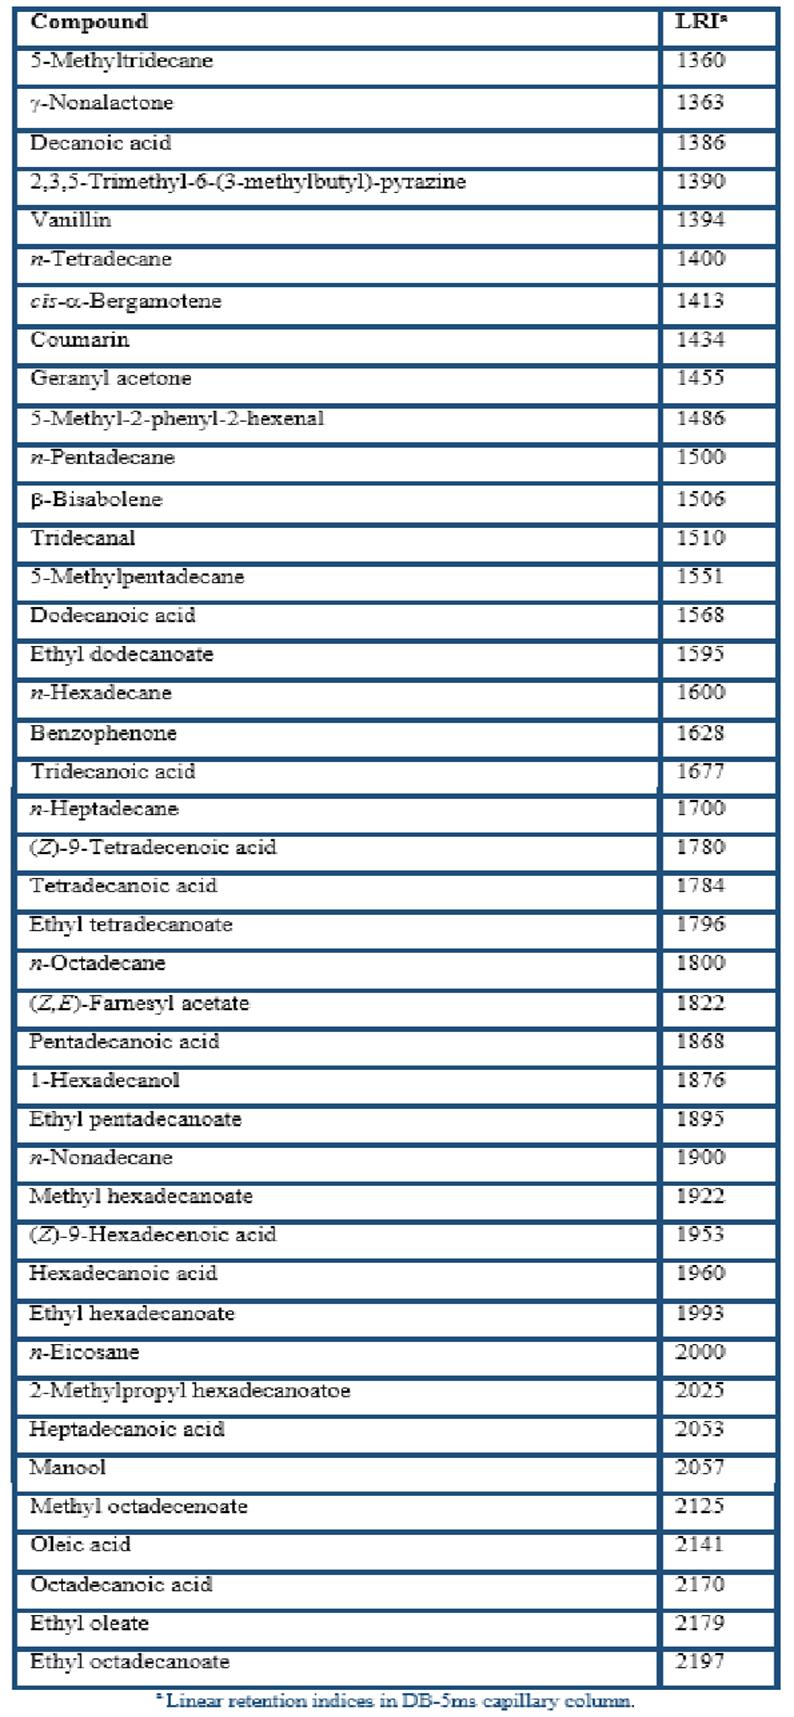
Table 2 Effect of fiber type on the chromatographic area (×107 area units) of volatile compounds from cocoa huska

CONCLUSIONS
Gas chromatography-olfactometry in combination with headspace solid-phase microextraction using DVB/CAR/PDMS fiber operated at 60 oC for 22 min could isolate most of the volatile compounds from cocoa husk. The identified 21 odourants were originated from wide range of acids, pyrazines, Strecker aldehydes, and one furanone, sulphur compound, terpene, and ester. The combined procedure is a simple, sensitive, reproducible, rapid and low-cost method which may be applied as a quality control tool for industrial processing of cocoa husk.

