


 Servicios personalizados
 Inglés (pdf)
 Articulo en XML
 Referencias del artículo
 Enviar articulo por email
 Citado por SciELO
  Similares en
SciELO
Similares en
SciELO 
 Permalink
INTRODUCCIÓN
Regression analysis (Golberg et al., 2004) is a statistical methodology describe the relationship between variables atributes. For example in business marking, regression analysis can explain the relation between price and quality of products. The potential sales of a new product given its price. Regression analysis most used in continuous valued. Linear Regression (Bollobás.,1990) is a model describe the relationship between variables by linear model, let y is the response variable, and x the predictor variable, the model is:
y = ax + b (1)
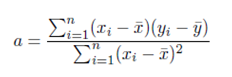
Where a and b can be solved by the method of least squares. Which minimize the error and extract the best line equation. if D set of data.D = {(x1, y1), (x1, y1), ...(xi, yi), ...(xn, yn)}
b = y¯ − x¯ (2)
Where a and b can be solved by the method of least squares. Which minimize the error and extract the best line equation. if D set of data . D = {(x1, y1), (x1, y1), ...(xi, yi), ...(xn, yn)}.
 (3)
(3)
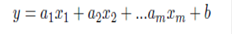
Multiple linear regression
Relation between more than one variable describe by linear model, the general equation is:
 (4)
(4)
Non Linear Regression: Curve regression
Often the relationship between variables is far to being linear. Curve models are the most used, to determine the curve model relationship, there are several mathematics models such as power, exponential, logistic and polynomial model. We are going to present, in the Table 1, the multiple Curve models.

Once we have chosen the model to adopt, we must transform the curve into a Linear relation. There are several linearization methods which can be cited in Table 2:

Big data MapReduce Algorithms
MapReduce (Dean et al.,2010) primitives implements parallel processing, it composes by two algorithms, Map and Reduce, Map algorithm takes a set of data and convert it into another set of data. It takes a pair of (key, pair) and emits ( key, pair) into Reduce algorithm. The input of Reduce algorithm is the result of map algorithm. The Map reduce constitutes from Master called Jobtracker, and a set of slaves server called TaskTracker (Shafer et al.,2010; Martha et al.,2013). Hadoop (Krishna.,2010) provide MapReduce runtimes with fault tolerance and dynamic flexibility support.
The essential question of our work are:
What is the model that can present regression curve in big data system
This paper is organized as follows, in section 2. We present related works, linear model, curve regression and k-means algorithm. In section 3., we present our proposition, mathematic model, Map and Reduce algorithms and workflow architecture. Subsequently, we show in section 4. Validation and results of our proposition of UnversalBank data set. Finally, we terminate by the conclusion in section 6.
RELATED WORK
There are several research interested by regression, linear or curve in big data (Jun et al.,2015; Oancea et al.,2015; Ma et al., 2015; Neyshabouri et al., 2016). Several works oriented to propose mathematic approaches for regression in big data such as data (Jun et al.,2015; Ma et al., 2015; Neyshabouri et al., 2016). Other geared to proposes MapReduce algorithms and its implementations in big data system like (Oancea et al.,2015)
Linear model
(Jun et al. 2015) presented a divided regression analysis using multiple linear where regression form is :
 (5)
(5)
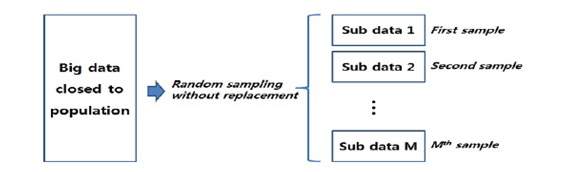
Authors use random sampling data to divided big data into sub samples, they consider all attributes have an equal chance to be selected in the sample Figure 1. (Oancea et al. 2015) presents a way to solve linear regression in big data, they propose a MapReduce algorithm expressed to the least square error, for the implementation they use R-Studio and Rhadoop library. (Ma et al. 2015) presented Leveraging for big data regression.Leverage appear, If a data point A is moved up or down, the corresponding adjusted value moves proportionally. The proportionality constant is called the leverage effect. Figure 2

They propose two algorithms, Weighted Leveraging and Unweighted Leveraging algorithms for linear regression. Authors discuss the advantage of those algorithms the in big data system. (Neyshabouri et al. 2016) present an algorithm for nonlinear regression in big data system based on lexicographical splitting graph (Wang et al.,2015) this algorithm divide n data into 2n possible partitions to construct sequence piecewise linear model, and combines them (Willems et al.1996) proposed Cover’s theorem(Cover ;1965), which can transform training data set non linearly separable in tanning set linearly separable. This work divided data set into tanning data set and test data set the proposed algorithm to generate a huge number of (104 -106) of random feature intermediate is given predictor matrix for the training data set, and they use training test data sets to choose predictive intermediate features by regularized linear or logistic regression.
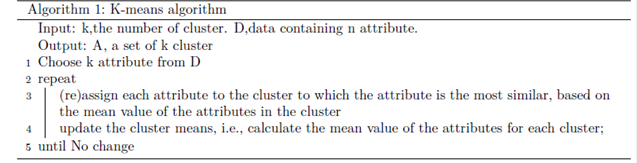
K-means algorithm
The k-means algorithm takes into account k input parameter, and partition a set of attributes in K clusters. Cluster similarity is measured about the average value of objects in a cluster, which can be considered as the cluster’s centroid or center of gravity (Han ;2011)
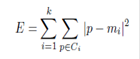
k-means algorithm calculate the square error criterion:
 (6)
(6)
Where E is the sum of the square error for all attributes,p is the point in space representing a given
attribute, and mi is the mean of cluster Ci.
PROPOSITION
Linear model for curve regression
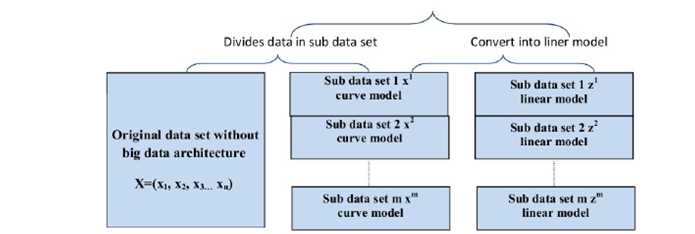
Let X = {x1, x2, ... xn} data set of curve model divided into m sub data set {x1, x2, ...xm} in big data architecture. The first step in our mathematic model is convert the curve model into linear model by linearization as we presented in Table 2, for each sub data set {x1, x2,...xm} convert in linear model {Z1, Z2, ...Zm},where Zi={zi 0; zi 1; zi 2...zi l} The general model of sub data i expressed by yi ai j ,zi and bi.
 (7)
(7)
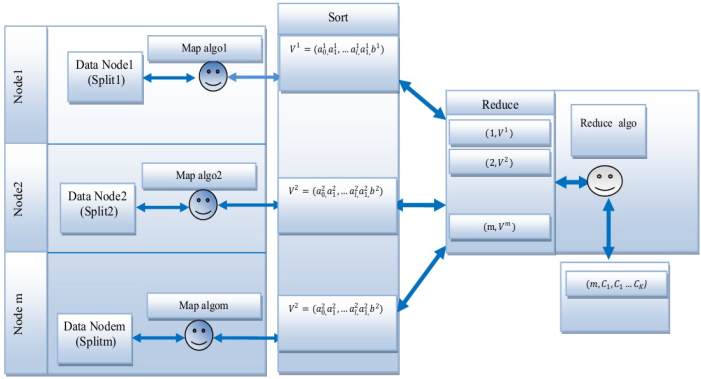
This step can returns the vectors{v1,v2, ...vm} Where vi = (ai 0; ai 1; ai 2; :::ai l; bi) Figure 3
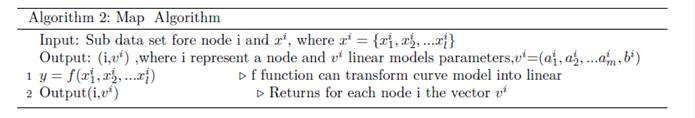
Map algorithm
Curve model divided into m nodes in big data architecture. Map algorithm can transform each data node, into a linear model, as we describe in 3.1.
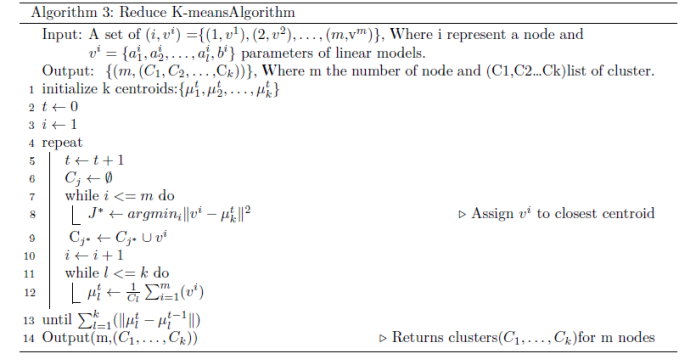
Select clusters by Reduce k-means algorithm
After determined the linear regression of each sub data set in node i, we apply Reduce k-means algorithm, to performs hard clustering, each linear model assigned only to one cluster, that can select bests linear models. The Reduce k-means algorithm process as follows. First, it randomly generates k from vi = {1 : : : i = m}, each of which initially represents a cluster mean or center.For each of the remaining vi {i = 1... i = m}, a vi is assigned to the cluster Cj to which it is the most similar, based on the distance between vi and the cluster mean. It then computes the new mean for each cluster. This process iterates until the criterion function converges.
Work flow of our architecture
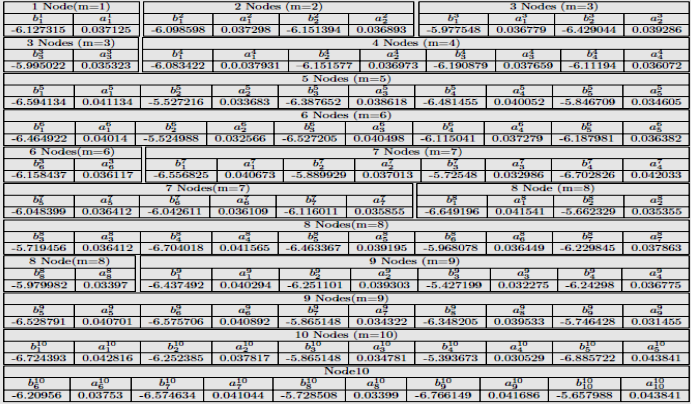
The work flow architecture Figure 4, presents data nodes (Data Node1, Data Node2..., DataNodem), and algorithms executes on it.The Map algorithm(Map algo1,Map algo2,...Map algom) execute in each node in order to extract linear model.In the reduce phase algorithm (Reduce algo) extracts K clusters (C1,C2...Ck). Table 3
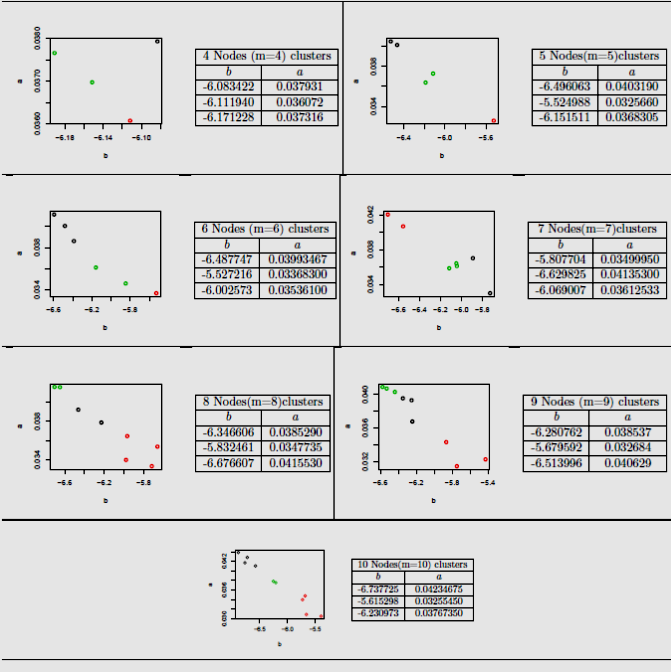
Apply k-meas algorithm
The second step of our proposition, apply the Reduce k-means algorithm. We select 3 clusters (k=3). Our algorithm takes linear models parameters extracted from Map Algorithm 2 and, construct 03 clusters. .For example in node5,C1 = (-6.496063, 0:0403190),C2 = (-5.524988, 0:0325660) and C3 = (-6.151511, 0.0368305).The result of (m=4...m=10) in Figure 6.
DISSCUTION OF OUR APPROACH
Our approach is a complete approach toward regression problem in big data; it covered the mathematic models such as (Jun et al.,2015; Ma et al., 2015; Neyshabouri et al 2016) works, and MapReduce algorithm and architecture like (Oancea et al.,2015). Moreover, our approach combines between to important problem of data mining, regression, and machine learning problems. Map algorithm can solve the regression problem of curve regression; it can convert curve model into linear model and Reduce k-means algorithm can represent the clustering problem. Big data architecture composes by various nodes; each node returns linear model. Consequently, reduce k-means algorithm select the best k-clusters wich can describe linear models.
CONCLUSION AND FUTURE WORK
In this paper, we have proposed curve regression in big data system.Data in our architecture is divided into sub data, each sub data assigned to node, the first algorithm in our approach converts the curve model into linear model, each node convert its sub data into linear model. In the second step, we apply k-means algorithm for each node in order to extract clusters. We validate our approach by UniversalBank data set; we calculate linear models parameters and obtain 03 clusters for each node. Our approach combine the regression with clustering problem in big data architecture, the result extracted from Map algorithm input into Reduce k-means algorithm to select the clusters which can better represent the regression model.

