


 Servicios personalizados
 Inglés (pdf)
 Articulo en XML
 Referencias del artículo
 Enviar articulo por email
 Citado por SciELO
  Similares en
SciELO
Similares en
SciELO 
 Permalink
Introduction
It is generally accepted that the analysis of human gait rhythm provide important diagnostic information that can be used to distinguish particular disorders of motor or sensory function, or even specific neurodegenerative diseases. 1
Besides clinical assessment of patients by experts, model-based approaches might contribute to a numerical allocation of patients. However, our insufficient knowledge about physiological mechanisms of human/vertebrate locomotion, as well as certain technical aspects appear as drawbacks on this endeavor. 2), (3
Most authors have found increases in stride variability among Amyotrophic Lateral Sclerosis (ALS) patients as well as with mouse models for the disease. 4-9 At the same time, some reports have revealed no changes in gait dynamics of the SOD1 G93A transgenic model for ALS compared to wild-type control mice. 10-11) Contrastingly, Hampton found the gait to be more “athletic” in SOD1 G93A mice at 12 weeks and 13 weeks of age, as compared to saline-treated mice, with the stride length significantly longer for the ALS model. 12)
The nonlinear identification approach combines advanced statistical methods (such as kernel nonparametric estimation and minimal cross validation criteria), with the theoretical advantages of nonlinear dynamics theory. In particular, Takens´ theorem states the possibility to reconstruct a complex dynamical system from discrete observations of only one of the several participating variables. 13), (14) This is principally suited for the case when little is known about the explicit mechanisms of a given process, or when not all involved variables can be traced. In particular, it allows plausible reconstruction of phase portraits corresponding to putative underlying dynamics. Phase portraits are a convenient way of representing time series data that is suited for both qualitative and quantitative assessment of time series data. Specially, phase portraits have been used for representing complex gait data. 15
This work is an attempt to apply a nonlinear identification approach to the analysis of gait data obtained from ALS patients.
Methods
Data.Human gait time series data, were downloaded from www.physionet.org 6 and corresponded to 15 control subjects and 13 persons with ALS, as they walked at their normal pace along a 77-m-long hallway for 5 min. The mean age (standard deviation) of the control and ALS subjects were 39 (18.5) and 56 (12.8) years, respectively. Haussdorf et al. describe details about the recording protocol. 17 From the recorded force applied to the ground during walking, the time series of the right foot was sampled at 300Hz. For each subject, data corresponding to the first sixty seconds of walk were resampled to 30 Hz. The obtained 1440 data points were subdivided into three non-overlapping windows, 16 seconds each. Each 16-s segment was submitted to nonlinear kernel autoregressive analysis and dissimilarity function estimation. Data from the processed 16-s segment that yielded better mimicry respect to the original gait recording were taken for further analysis. Given the low incidence and short survival time of ALS (around 2.5 per 100 000 in industrialized countries and 0.8 in Cuba, with 36 months for median survival time), publicly available experimental data on ALS patients´ gait are scarce. (18 That´s why many studies on ALS gait analysis among ALS patients have been conducted with the database from Physionet. Even when age differences between controls and ALS patients may impose some limitations to the study, different authors consider that these are not disquieting enough as for invalidating studies with this database. 19
Nonlinear identification
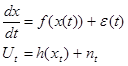
Here, we conceive a gait recording as a realization of the following non-linear stochastic model,
 ()1
()1
In (1),  is the activation level of a subpopulation of motor units involved in locomotion as a function of time (t).
  represents the force exerted by the foot on the ground at time t and is understood as a transformed projection of
 . System noise and observation noise are
  and
and  respectively. It has been shown theoretically that a system as (1) does generate the following non-linear stochastic autoregressive model: 20-22
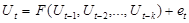 ()2
()2
The function F in equation represents the relation of exerted force at the moment t as depending on force values at preceeding moments (t-1, t-2, ... ). Function F in (2) was estimated from the gait data time series. For that, a nonlinear nonparametric kernel autoregressive Nadaraya-Watson estimator with a Gaussian kernel was used.
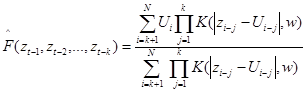 ()3
()3
Where  is the estimator of the theoretical function, and
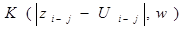
is a Gaussian kernel. The order k and the bandwidth parameter w were obtained by cross validation.
Noise free realizations (NFR) were obtained from the estimated function via recursive estimation of future values given past values. After visual inspection for correspondence between observed gait traces and NFR, correlation coefficients between NFR and corresponding gait data segment were estimated.
For phase portrait reconstruction, two-dimensional projections of attractors from each NFR were obtained using Takens´ theorem. Phase portraits´ features were quantified (main axis length, minor axis length, slope at the basis, angle at the apex, second loop length, axis ratio, and loop ratio) and used for data stratification via discriminant analysis.
Nonlinear Dissimilarity Measure
Hernandez Cáceres et al. proposed a nonlinear dissimilarity measure for comparing a pair of time segments. (23) This distance measure is defined by manipulating global models to quantify dynamic similarity of time series. The dissimilarity between two traces is conceived as the dissimilarity between the underlying dynamics. (24) With the aim of expressing this quantitatively, it is interpreted as dissimilarity between those autoregressive functions that best fit the processes. For that, the concept of distance between functions is commonly used. We apply this concept to time series of gait data. This approach avoids the severe loss of information, which happens if a time series is summarized by a few characteristic numbers. (25)
If  and
and  are, respectively, the estimated nonlinear autoregressive functions corresponding to the gait data segmentsand, then a measure of dissimilarity between these segments is defined as:
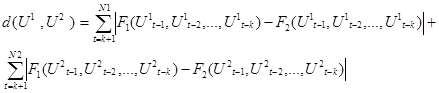
The two terms on the right side are, the distances between two sequences of one-step predictions. Nonlinear autoregressive estimation here was obtained by approximating the current value with a second-degree polynomial of the previous value (k=1).
All possible pairs of traces were compared, and a 28 by 28-dissimilarity matrix was obtained. For visualizing respective positions of individual gait recordings in the multidimensional function space, a 3D plot was obtained via multidimensional scaling.
For numerical classification, the eight largest principal components from the dissimilarity matrix were introduced as predictors for discriminant analysis.
Results and Discussion
Noise-free realizations (NFR)
All analyzed traces, either from controls or from ALS patients, yielded NFR resembling the original recordings (Fig. 1). Quantitatively, correlations between NFR and original traces ranged from r=0.17 (p=0.018) in one ALS recording to r=0.99 (p= ≤ 0.00005) in one healthy control. The median correlations were 0.94 for controls and 0.84 for ALS patients (p=0.033, Mann-Whitney’s “U” test). The lower correlation between NFR and original traces can suggest a higher contribution of stochastic components to gait dynamics among ALS patients.
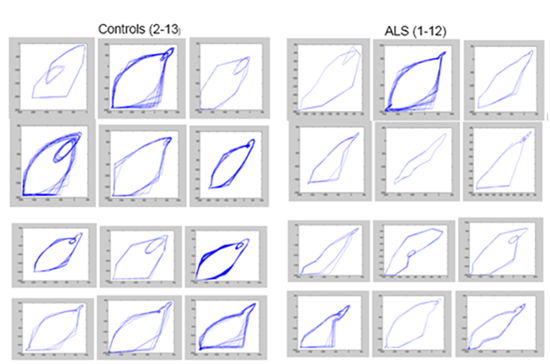
In figure 2, a set of 24 phase portraits corresponding to 12 controls and 12 ALS patients is shown. Visual inspection suggests different patterns for controls and patients.
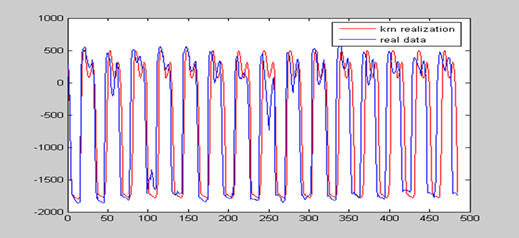
Fig.1 -Time series of an original 16-s gait trace (blue) and corresponding NFR (red). Note that the NFR retained the amplitude, approached the frequency and showed the general pattern of the original trace.
We attempted a classification based on phase portraits. For that, a group of phase portrait features were introduced as predictive variables for discriminant analysis: Major Axis Length, Minor Axis Length, Major Axis of the Second Loop, Slope at the Basis, Angle at the Apex, Main-to-Minor Axes Ratio, and First-to-Second Loop Ratio. The following classification matrix was obtained (Table 1). The obtained classification function is shown in table 2.
Table 1 - Classification Matrix for Gait data phase portraits via discriminant analysis with phase portrait features as predicting variables; Rows: Observed classifications; Columns: Predicted classifications
|
|
|||
|---|---|---|---|
| Controls | 93.33 | 14 | 1 |
| ALS | 84.62 | 2 | 11 |
| Total | 89.29 | 16 | 12 |
Table 2 - Classification Functions based on discrimination of phase portrait with feature indices as predicting variables, and classification (Control/ALS) as grouping variable.
| Controls p=.53571 |
ALS p=.46429 |
|
|---|---|---|
| Major Axis | .0518 | .0423 |
| Angle at Apex | .2222 | .1479 |
| Axes Ratio | 13.7915 | 12.7231 |
| Constant | -57.1963 | -40.4804 |
As shown, only three of the seven proposed features were incorporated into the discriminant model.
Assessing Dissimilarities
Comparisons between traces corresponding to each health condition revealed different degrees of inter-individual variability among groups, ranging from an average of 241 a. u. among ALS patients to 291 a. u. among controls. Nonparametric comparisons revealed significant differences between groups (p ≤0.0001), suggesting a wider variability for controls.
Multidimensional scaling confirmed the presence of narrower region in the functions´ space for ALS patients. Controls appeared as scattered over a wider area around (Fig. 3). As it can be noticed, there is a clear separation between the two conditions.

Classification based on principal components
Results from multidimensional scaling suggest that it is possible to stratify between healthy subjects and patients suffering from ALS. Discriminant analysis with the first 8 principal components of the dissimilarity matrix as predictors showed an eighty-two percent of correct classifications (Table3).
Table 3 - Classification Matrix with principal components from dissimilarity matrix as predicting variables. Rows: Observed classifications; Columns: Predicted classifications.
| Percent Correct | Controls p=.53571 |
ALS p=.46429 |
|
|---|---|---|---|
| Controls | 84.62 | 12 | 3 |
| ALS | 80.00 | 2 | 11 |
| Total | 82.14 | 14 | 14 |
Overall, our results suggest that a nonlinear identification approach, centered in the characterization of the dynamics of the gait process can bring new insights to gait data interpretation. In particular, they suggest that amyotrophic lateral sclerosis is associated with a specific pattern of phase portraits as well as a restriction of choices in the repertory of dynamics. This approach might be a promising aid for the stratification of gait disorders associated to neurodegenerative diseases, as well as for implementing rehabilitation protocols.
Unlike previous research with gait data, we centered ourselves on the crude, unprocessed traces, and limited our analysis to a 16-s segment taken from the first minute of recording. We expected that this might allow us to retain information about the global mechanisms of gait dynamics. At the same time, recording time reduction to only 1 minute can simplify test procedures and reduce discomfort to patients.
Comparing our data with other reports with this data base revealed that we obtained 89% of correct classifications with phase portrait features and 82% accuracy with dissimilarity matrix principal components. These is comparable to the obtained by Wa and Shi using a Support Vector Machine algorithm (93.1% accuracy with all-training-all-testing; and 82.8 with leave-one-out). 26 We interpret this as a support for nonlinear identification as a way to retain important information about gait dynamics and ALS associated changes.
As a paradigm in nonlinear identification, we conceive the gait process as emerging from a nonlinear dynamical system perturbed by innovation noise. This combination of deterministic and random factors result in the human gait. Ideally, if stochastic innovation were absent, the noise free realization of a periodic attractor should be identical to the original time series. The fact that correlations between NFR and original traces were lower than unity could suggest about stochastic contributions. In this regard, the lower correlations obtained among ALS patients might suggest that healthy persons do display a more robust gait in terms of constancy of pace, with lower influence from environment´s stochastic factors.
As stated by Wu and Shi, “Although a few nonlinear analysis methods have been used in previous studies to investigate the complexity of human locomotion process, further quantitative studies call for more computational tools that are suited for gait analysis.”26) We hope that the approach proposed here can contribute to fill this gap.
Our results are in agreement with those of Haussdorf et al. They found a degradation of complexity in ALS patients. In particular, they found that gait of healthy humans remains self-similar at a broad range of time scales; this self-similarity is disrupted in ALS patients, and the result could be a higher sensitivity to external environmental disturbances. 17
Studies revealed that in ALS, about half of neurons involved in locomotion become dysfunctional. Surprisingly, animals can still walk in these conditions. 15), (27 Among the putative compensations allowing individuals with ALS to continue moving, the following strategies have been suggested: Increasing muscle co-contraction of lower leg muscles, circuit adjustment for maintaining posture and supporting gait, and a stronger initial activity of TA and GC muscle groups at step initiation. 28 These re-adjustments may result in a less robust dynamics, with higher influence of stochastic influences and corresponding increased gait variability. The lower correlation between NFR and the original signal among ALS patients might suggest an enhanced role for stochastic components, with corresponding deterioration of self-affine homeostatic mechanisms.

