


 Serviços customizados
 Inglês (pdf)
 Artigo em XML
 Referências do artigo
 Enviar este artigo por email
 Citado por SciELO
  Similares em
SciELO
Similares em
SciELO 
 Permalink
Introduction
Milling includes a number of highly versatile machining operations taking place in a variety of configurations with the use of a milling cutter - a multitooth tool that produces a number of chips in one revolution. End milling is an important and common machining operation because of its versatility and capability to produce various profiles and curved surfaces (Kalpakjian & Schmid, 2014).
The cutting process in milling is performed by a rotary multitooth tool, so it is intermittent, consequently, the technological system is exposed to vibrations, which affect the operation accuracy, surface integrity of workpiece, cutting tool life, thickness of chip, cutting forces and safety of operator.
The selection of proper machining parameters is a complex and important task, because it depends and affect a great number of variables. It be contingent on many factors, which can be controllable or uncontrollable, for instance: machine tool (technical state, number of years of exploitation, maintenance), workpiece (mechanical and physical properties, microstructure, etc.), cutting tool (mechanical and physical properties, surface roughness, wear, geometry, etc.), fixture, experience of machinist, cutting fluids, stiffness of technological system, illumination and ventilation of the workshop, as well as, the control and measuring instruments. The cutting parameters impact, among others, the following aspects: cutting tool life, cutting power and energy consumption, surface integrity (surface roughness, microstructure, plastic deformation, hardness, etc.), cutting temperature, manufacturing productivity and cost, as well as, environmental impact. Commonly, the selection of machining variables is made by catalogs of cutting tool manufacturers and/or machinist experience, but the best combination of these is generally not chosen and, industrial practice is more complex.
Feed rate, cutting speed, depth of cut, tool wear, and cutting fluids are important machining parameters affecting surface roughness. Even small changes in any of these parameters may have a significant effect on the surface roughness. Therefore, it is important for the researchers to model and quantify the relationship between surface roughness and the parameters affecting its value (Kant & Sangwan, 2015).
Because steels are among the most important engineering materials, their machinability has been studied extensively. Carbon steels have a wide range of machinability, depending on their ductility and hardness. If a carbon steel is too ductile, chip formation can produce built-up edge, leading to poor surface finish; if the steel is too hard, it can cause abrasive wear of the tool because of the presence of carbides in the steel. Cold-worked carbon steels are desirable from a machinability standpoint (Kalpakjian & Schmid, 2014).
Surface roughness plays a critical role in evaluating and measuring the surface quality of the machined a product in today’s manufacturing industry. Surface roughness greatly affects the functional attributes of products which are friction, wear resistance, fatigue, lubricant, light reflection, and coating. Surface roughness is not only a quality indicator but is also the final stage in controlling the machining performance and the operation cost (Boothroyd, 2008).
The hardness of workpiece is another important variable in machining, because it is a complex process of plastic and elastic deformation, and it rest on of a great number of factors, which make difficult to establish their mechanical physical principles. However, effects of machining parameters on workpiece hardness has been poorly studied.
The effects of cutting tool geometries, cutting conditions and flank wear, on cutting forces in milling of AISI 1045 steel were reported (Kolar et al., 2015). The influences of feed rate and cutting speed on superficial integrity and deflections in milling of AISI 1010 steel were analyzed (Hernández, et al., 2015).
The wear of end mill and surface roughness, for different types of milling operations, with uncoated cemented carbide and high speed steel cutting tools, were measured (Vopát, et al., 2015). Two coupled artificial intelligence techniques were used for prediction and optimization of machining parameters, leading to minimum surface roughness (Kant & Sangwan, 2015). Impact of machined surface inclination angle, axial depth of cut, spindle speed and feed rate, on residual stress and microhardness, were investigated (Masmiati & Sarhan, 2015). Effects of cutting parameters on surface roughness and material removed rate, in milling AISI 1040 steel, were evaluated (Fnides, et al., 2017). The portability of empirical models for surface roughness prediction in face milling of a non-alloy steel was studied (Abellan, et al., 2017). Milling of AISI 1045 steel with coated carbide tool, to establish correlation among: the surface roughness, flank wear, input cutting power, and machining time, was assessed (Pimenov, Bustillo & Mikolajczyk, 2017). Influence of relationship between the length of the parallel land of the secondary cutting edge and feed, on surface roughness, were analyzed. In tests, standard and wiper geometry inserts were used together on a milling cutter (Toledo, et al., 2018). The energy consumption characteristics and influence of cutting parameters on surface quality, in milling using mill cutter with cemented carbide inserts, were studied (Zhao, et al., 2018). The consequence of the inverse cutting ratio and the macro cutting geometry on chip formation, milling forces, tool deflection, as well as, on workpiece surface integrity, were examined (Borysenko, et al., 2019). The tool/chip contact temperatures based on measured tool side temperatures and other factors as: the cutting forces, chip thickness and contact length, were determined (Saez-de-Buruaga, et al., 2018).
Many studies have been carried out to reveal the relationship between the surface roughness and cutting parameters, however, little attention has been paid to analyze influence of cutting regime on workpiece hardness, in milling of a plain carbon steel. Then, this study is focused on determine the best feed rate and cutting speed, regarding the surface roughness and hardness of workpiece, in dry end milling of AISI 1045 steel with a high-speed steel mill cutter.
Materials and methods
From now on, the designing and set-up experimental of dry conventional end milling of an AISI 1045 steel to determine the best combination of cutting speed and feed rate, regarding the hardness and surface roughness of the machined workpiece, are exposed.
Workpiece material
The chosen workpiece material was AISI 1045 steel in hot rolled condition. This steel is extensively used in manufacturing of shafts, axles, gears, forgings, rails, railway wheels. The hardness was measured using a HRS - 150 hardness tester and its value is 269 HB. Its chemical composition was determined using a mass spectrometer and it is shows on Table 1. The samples have the following dimensions: (40 x 20 x 20) mm.
Table 1 - Chemical composition of AISI 1045 steel.
| Elements | C | Cr | W | V | Mo | Mn | Si | Ni | P | S |
| Concentration (%) | 0,7 - 0,8 | 3,8 - 4,4 | 17,5 - 19 | 1,0 - 1,4 | 0,2 - 0,3 | 0,4 | 0,4 | 0,4 | 0,03 | 0,03 |
The experiments were carried out using a FUS 22 universal milling machine (spindle with maximum rotation of 1 250 r/min, maximum main motor power of 1,4 kW and maximum feed rate of 250 mm/min). The experimental setup is shown in Fig. 1.
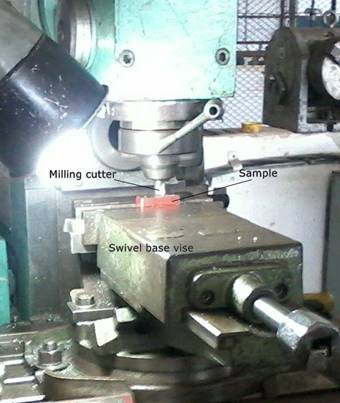
The cutting tools employed are two solid end mill, with two helicoidally flutes and diameter of 12 mm. The milling cutter material is a high-speed steel. This steel after heat treatments, it can reach hardness between 62 HRC and 64 HRC.
A full factorial design was selected. The experiment is performed using three cutting speed (4,71; 11,86; 18,84) m/min and three feed rate (20; 31,5; 50) mm/min, as well as, constant depth of cut (0,5 mm), and two replicates were included, leading to 18 experimental runs. Tests were randomized to minimize influences of cutting tool wear, vibrations and others factors. The machining trial was stopped after every cut to record the surface roughness (Ra) and hardness (HB) of workpiece. The workpiece was wet milling before test to eliminate possible surface defects.
The hardness examinations were conducted using a HRS - 150 hardness tester, and the surface roughness has been got using standard samples of comparison.
Results and discussion
The S/N response data are calculated using a proper software. The largest S/N response would reflect the best response, which results in the lowest and highest noise for surface roughness and hardness, respectively. These are the criteria employed in this study to determine the best machining parameters.
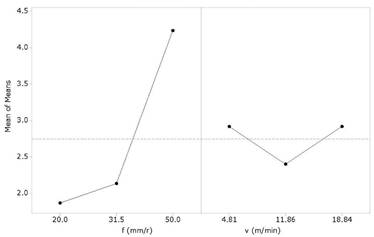
The direct effects plot of the machining variables on the surface roughness of the AISI 1045 steel after dry milling operation is shown in Fig. 2. The slope of the line indicating the effect of the feed rate is higher compared to the slope of the cutting speed. Therefore, the rate feed is the most significant cutting variable for surface roughness. Also, the machining parameters for minimum surface roughness are: f = 20 mm/min and v = 11,86 m/min.
The variance analysis is applied to recognize if the cutting parameters influence the surface roughness of workpiece, see Table 2. Study of this table indicates that the developed model and feed rate are found to be statistically significant (p < 0,05), but cutting speed doesn’t fulfill this requirement, for a 95 % of confidence level. The cutting speed is not significant; that it is why is removed from the model. The model is revealed in (1).
Moreover, R2 is called the coefficient of determination for regression analysis that is used to explain the goodness-of-fit of the model to the experimental data. According to ANOVA, the R2 = 88,53 % and adjusted R2 = 87,09 %. These values are close to 100 %. It means that 88,53 % of the total variance is justified by the model.
Table 2 - Analysis of variance for Ra.
| Source | Sum of squares | Degrees of freedom | Mean square | F value | p-value |
| Model | 154, 26 | 2 | 77,063 | 61,73 | 0,000 |
| v | 0,001 | 1 | 0,001 | 0,00 | 0,978 |
| f | 44,30 | 1 | 44,30 | 35,49 | 0,000 |
| Error | 19,974 | 16 | 1,248 | - | - |
| TOTAL | 174,10 | 18 | - | - | - |
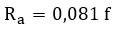 (1)
(1)
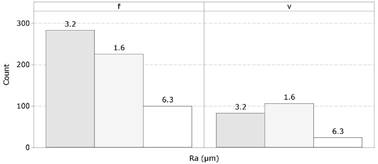
Inform of diagnosis from the Pareto diagram is shown in Fig. 3. The most frequent values of Ra are 3,2 µm (46,47 %) and 1,6 µm (37,11 %) for feed rate. Considering the cutting speed, the most frequent values of Ra are 1,6 µm (50 %) and 3,2 µm (38,90 %).
The model adequacy examination is carried out through the residual analysis. The boxplot display the shape, center, spread, and extreme points of a data set (Fig. 4). Specifically, this analysis includes: minimum (Ramin), first quartile (Q1), median or second quartile (Q2), third quartile (Q3) and maximum (Ramax). Also, it can be determined if there are outliers or not.
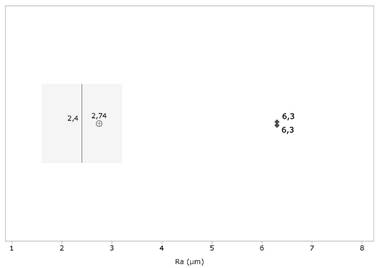
The graph shows that data are asymmetric to the right, the mean (2,74 µm) is major than the median (2,4 µm). Besides, there are two outliers (6,3 µm: for v (4,81 and 18,84) m/min, and f = 50 mm/min). Also, Ramin = 1,6 µm; Q1 = 1,6 µm; Q2 = 2,4 µm; Q3 = 3,2 µm; Ramax = 6,3 µm. This investigation shows that approximately:
25 % of the n = 18 data values are less than or equal to Q1 = 1,6 µm.
50 % of the n = 18 data values are less than or equal to Q2 = 2,4 µm.
75 % of the n = 18 data values are less than or equal to Q3 = 3,2 µm.
The interquartile range for this data set is: Q3 - Q1 = 3,2 - 1,6 = 1,6 µm. This means that the spread of the middle 50 % of the data is 1,6 µm.
The standardized bias and the standardized kurtosis can be used to determine if the sample comes from a normal distribution. Values of these statistical ones outside the rank from -2 to 2 indicate significant deviations of normality. In this case, the value of standardized kurtosis (1,61) is within the rank of data, however, the standardized bias (2,59) is out of it, what would tend to invalidate any statistical test in reference to the standard deviation.
It is accepted generally, the increase of cutting speed causes a reduction of surface roughness. Also, the lowest values of surface roughness are obtained for the smallest feed rate and this is the most significant cutting variable. However, the literature review showed different trends.
A paper revealed that, the best result of surface roughness is obtained for the highest cutting speed and feed rate (Masmiati, et al., 2016).
Further investigations showed that the increase of cutting speed reduces the surface roughness, but the increase of feed increases the surface roughness (Wu & Yin, 2018).
Some authors presented that surface roughness decrease with spindle speed and largely depends of it (Fnides, et al., 2017).
On the other hand, it was reported surface roughness first declines and then rises with the increase of spindle speed (Huang, et al., 2018).
Finally, some authors reported: “there are critical effect of other factors besides cutting parameters on surface roughness which demonstrates the challenge of developing surface roughness models that can be applied in different scenarios”. (Abellan, et al., 2017)
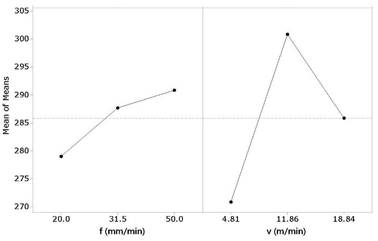
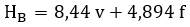
The main effects plot of S/N ratios for selecting the levels for greatest hardness is shown in Fig. 5. The highest feed rate (f = 50 mm/min) and medium cutting speed (v = 11,86 m/min) are selected as the best choices for it.
Analysis of variance for HB is presented on Table 3. This table indicates that the developed model is found to be statistically significant as well as, feed rate and cutting speed (p < 0,05) for a 95 % of confidence level. The model is exposed in (2).
According to ANOVA, the R2 = 93,19 % and adjusted R2 = 92,34 %. These values are very close to 100 %. So, the 93,19 % of the total variance is justified by the model.
The cutting speed is a significant factor for hardness of machined workpiece. First, hardness increases with increase of the cutting speed up to 11,86 m/min, then it decreases as the cutting speed increases up to 18,84 m/min. This result corroborates the complexity of milling operation.
The most significant increase of hardness with respect to initial value, was of 10,33 % (v = 11,86 m/min). Also, it was obtained for f = 50 a rise of 7,24 %. This change is due to increase of hardness of machined workpiece resulting from plastic deformation. The increase in hardness is favorable considering that it reduces the possibility of appearance of built-up edge on flank face of cutting tool, especially during the machining of ductile materials, such as carbon steel. Built-up edge is an intermittent phenomenon, it appears and is destroyed according to machining conditions, and some particles of this material could be welded to machined surface and tool surface, which worsens the surface roughness.
Table 3 - Analysis of variance for HB.
| Source | Sum of squares | Degrees of freedom | Mean square | F value | p-value |
|---|---|---|---|---|---|
| Model | 1,38 106 | 2 | 6,88 105 | 109,49 | 0,000 |
| v | 63,157 103 | 1 | 63,157 103 | 10,05 | 0,006 |
| f | 15,945 104 | 1 | 15,945 104 | 25,38 | 0,000 |
| Error | 10,053 104 | 16 | 6, 284 103 | - | - |
| TOTAL | 14,765 45 105 | 18 | - | - | - |
 (2)
(2)
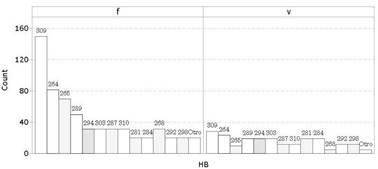
Inform of diagnosis from Pareto diagram is shown in Fig. 6. The most frequent values of HB are: 309 (21,72 %), 264 (12,79) and 265 (9,69) for v and f.
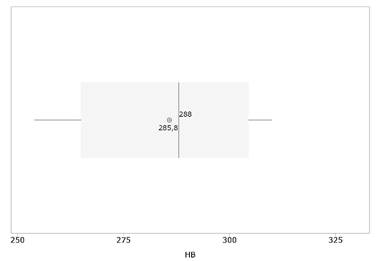
The boxplot is displayed in Fig. 7. The graph shows that data are asymmetric to the left, the mean (285,8) is minor than the median (288). Besides, there are not outliers. Also, HBmin = 254; Q1 = 265; Q2 = 288; Q3 = 304,5; HBmax = 300.
The point of this investigation is to show that approximately:
25 % of the n = 18 data values are less than or equal to Q1 = 265.
50 % of the n = 18 data values are less than or equal to Q2 = 288.
75 % of the n = 18 data values are less than or equal to Q3 = 304,5.
The interquartile range for this data set is: Q3 - Q1 = 304,5 - 265 = 39,5. This means that the spread of the middle 50 % of the data is 39,5.
On the other hand, the value of standardized kurtosis (-1,17) and the standardized bias (-0,314) are within the rank of data, therefore, the sample comes from a normal distribution.
In general, in literature diverse trends were found on effect of milling operation in hardness. The increase of cutting speed and feed rate should incite growth of cutting temperature (Saez-de-Buruaga, et al., 2018), cutting tool wear and, a decrease of cutting forces and hardness. Besides, the cutting forces, temperature and, the value of tensile surface residual stress tend to growth with the increase of feed rate or depth of cut (Ma, et al., 2016).
Some investigations reported the increase of cutting speed can decrease the degree of strain hardening, this result was obtained in hard milling of AISI D2 steel (Huang, et al., 2018) and, in high speed milling of an ultrahigh strength steel (Zhenchao, et al., 2018).
On the other hand, it was observed that cutting speed had not an important effect on microhardness (Masmiati & Sarhan, 2015).
Conclusions
The experimental study of dry conventional milling of a medium carbon steel was carried out with the aim of obtaining the best values of feed rate and cutting speed, regarding combination of hardness and surface roughness values. Data analysis was conducted to find the optimum conditions using signal-to-noise ratio response study and analysis of variance. The model adequacy examination was carried out through residual analysis using the boxplot.
Feed rate was a statistically significant factor for surface roughness, but cutting speed did not fulfill this criterion for a 95 % of confidence level. Inform of diagnosis showed the most frequent values of Ra are 3,2 µm (46,47 %) and 1,6 µm (37,11 %) for feed. Besides, the boxplot showed that 75 % of the data values are less than or equal to 3,2 µm, therefore, the grinding operation could be ruled out for this machining conditions. The machining parameters for lowest surface roughness are: f = 20 mm/min and v = 11,86 m/min.
On the other hand, the model analysis showed that, cutting speed and feed rate are statistically significant factor for Brinell hardness. In addition, a moderate increase of hardness with respect to initial value was found for medium cutting speed and for highest feed rate. The most frequent values of HB are: 309 (21,72 %) and 264 (12,79), as well as, the 75 % of data values are less than or equal to 304,5 HB. The best machining conditions considering workpiece hardness are: f = 50 mm/min and v = 11,86 m/min.
Finally, the best machining parameters for both dependent variables are the lowest feed rate and the medium cutting speed.

