


 Serviços customizados
 Inglês (pdf)
 Artigo em XML
 Referências do artigo
 Enviar este artigo por email
 Citado por SciELO
  Similares em
SciELO
Similares em
SciELO 
 Permalink
Introduction
The digital revolution has profoundly transformed the educational landscape, placing Learning Management Systems (LMS) such as Moodle at the center of this context (Avello-Martínez et al., 2016). These digital platforms have emerged as essential solutions to facilitate online teaching and learning, providing a virtual environment where teachers and students can interact, share resources, and evaluate educational progress. Their ability to offer accessible, customizable, and large-scale education has been particularly relevant in the context of the COVID-19 pandemic, proving to be indispensable tools for maintaining educational continuity in the face of physical restrictions (Tan et al., 2021).
Among the most prominent LMS is Moodle, an open-source platform that is widely accepted for its flexibility and customization capacity (Marticorena-Sánchez et al., 2022; Nieto Almeida et al., 2018). However, despite its popularity, Moodle faces significant challenges in generating detailed analytical reports (Hamamoto et al., 2021; Sáiz-Manzanares et al., 2021). Integrated plugins for system log analysis, although useful, often offer reports that do not meet the expectations of depth and detail required by educators and administrators to make effective evaluations and improvements in teaching and learning processes (Avello-Martínez et al., 2023).
In response to this problem, Moodle Logs Analytics emerged, an open-source tool developed in Python for web analysis of student activity and engagement in Moodle courses (Avello-Martínez, 2024). This application offers a practical and accessible solution for analyzing course records, providing interactive and detailed graphs that effectively describe student activity, thus filling the gap left by standard Moodle reports.
The objective of this study is to explore and compare the behavior of students in five editions of a Digital Narratives course offered in the Master of Digital Environments at Universidad Bolivariana del Ecuador, using the Moodle Logs Analytics tool. Through this analysis, we seek to characterize students' interactions with the course components, their contributions, access patterns, and other relevant aspects that emerge from the logs. The Moodle Logs Analytics application not only allows teachers to carry out detailed post-course analyses and compare different versions of the course to make informed decisions and improve the educational experience but also makes it easier for managers to carry out general analyses of courses by discipline or other organizational categories.
This research represents an effort to better understand the dynamics of learning in digital environments and the effectiveness of LMS analysis tools in improving educational quality. Through the study of student behavior in the editions of the Digital Narratives course, we aspire to contribute to the body of knowledge on learning analytics and its practical application in optimizing teaching and learning processes in digital environments.
Literature Review
Learning Management Systems (LMS) constitute a cornerstone in the infrastructure of digital education, offering a virtual environment where educational content, interaction between students and teachers, and learning evaluation can be efficiently managed (Nieto Almeida et al., 2018). Academic literature highlights Moodle as one of the most prominent LMS (Avello-Martínez et al., 2016), praised for its open-source nature, which facilitates extensive customization to fit the specific needs of each educational institution (Luna et al., 2017). Previous studies have investigated the advantages of Moodle in terms of accessibility, interactivity, and collaboration, highlighting how these features can improve the learning experience and facilitate the achievement of educational objectives (Athaya et al., 2021).
Log analysis in digital educational environments has become a valuable tool to better understand student behavior and the effectiveness of the proposed learning materials and activities (Amo-Filva et al., 2022). The logs, which record users' interactions with the system, provide primary data that, once analyzed, reveal behavioral patterns, learning preferences, and possible obstacles faced by students (Marticorena-Sánchez et al., 2022). This information is crucial for educators and administrators, as it allows adaptation of teaching content and methodologies to improve engagement and learning outcomes.
Several studies have demonstrated the effectiveness of log analysis in LMS environments to improve educational quality (Amo-Filva et al., 2022). For example, research has used log analysis to identify the correlation between LMS activity and academic performance, providing insights for early intervention in students at risk of low performance (Fakhrusy & Widyani, 2017). Other studies have explored how access and participation patterns in discussion forums correlate with learning success, suggesting strategies to encourage greater interaction and collaboration between students (Verdú et al., 2021). The Moodle Logs Analytics tool is part of this research framework, offering new possibilities for the detailed analysis of student activity and the optimization of evidence-based teaching and learning processes (Avello-Martínez et al., 2023).
Materials and methods
Methodology
The tool Moodle Logs Analytics (2024) is an open-source tool developed in Python, designed for advanced log analysis on the Moodle platform. This web application offers an intuitive interface for data visualization, allowing users to generate interactive reports and detailed graphs. Among its main functionalities are the ability to filter data by course, date, and type of activity; access frequency analysis; and the identification of patterns of student interaction with course resources. The tool is designed to make it easier for educators and administrators to deeply understand student behavior, thereby optimizing evidence-based teaching and learning strategies.
For this study, logs were collected from five editions of a Digital Narratives course offered in the Master of Digital Environments at Universidad Bolivariana del Ecuador. The logs include data on access to course resources, participation in activities, submission of assignments, interactions in discussion forums, and other events recorded on the Moodle platform. These records cover a period between August 16th, 2023, and February 27th, 2024, as seen in the application's data loading screen (Figure 1), providing a large database with 108,482 access records, for analyzing student behavior throughout different versions of the course.

The following table (Table 1) presents a descriptive summary of the accesses by group, the average (Mean), the total sum of accesses (Sum), and the standard deviation (SD), including the number of students (N), which offers a comparative view of student behavior in the different editions of the course.
Table 1 - Distribution of access by groups
| Group ID | N | Average (Mean) | Sum of accesses (Sum) | Standard Deviation (SD) |
|---|---|---|---|---|
| PM-EED-A23-02P1-15 | 59 | 339 | 20,000 | 155 |
| PM-EED-A23-03P1-19 | 49 | 358 | 17,540 | 136 |
| PM-EED-B23-01P1-23 | 56 | 368 | 20,589 | 139 |
| PM-EED-B23-02P4-30 | 54 | 546 | 29,479 | 226 |
| PM-EED-A23-03P3-21 | 53 | 394 | 20,874 | 167 |
Source: Authors' elaboration
Data analysis was conducted in several stages:
Data Preprocessing: Initially, the collected logs were cleaned and organized to eliminate any irrelevant or duplicate data. This step ensured that only accurate and relevant records were included in the analysis.
Descriptive Analysis: A descriptive analysis was performed to obtain a basic understanding of the data, including the frequency of activities and the distribution of resource use. This provided an overview of student engagement with the course.
Analysis of Behavioral Patterns: Using data mining techniques, student behavior patterns were identified, such as the times of greatest activity, the sequences of access to resources, and the most frequent interactions in the forums.
Comparison between Course Editions: The behavioral patterns identified between the different editions of the course were compared to determine changes and trends in student behavior over time.
Interpretation of Results: Finally, the results of the analysis were interpreted in the context of educational practices, looking for correlations between student behavior and their academic performance, as well as identifying areas of improvement for future editions of the course.
Additional Analysis with Jamovi
To complement the study, correlation analyses and ANOVA comparisons were performed using the The Jamovi Project (2024) software, an open-source statistical program that intuitively facilitates data analysis. These additional analyses sought to identify significant relationships between different student behavior variables and evaluate statistical differences between course editions. Correlation analyses allowed us to explore the relationship between the analyzed indicators, while ANOVA comparisons helped determine whether there were significant differences in access and participation patterns between the groups studied.
Results and discussion
Presentation of the general findings of the analysis of the 5 groups with the web application
The (Figure 2) illustrates the frequency of daily accesses to the five editions of the Digital Narratives course from September 2023 to February 2024, highlighting fluctuations and peaks that reflect the intensity of students' interaction with the platform. Differentiated colored lines represent each course group, with notable increases in activity that correlate with specific academic events. Particularly, the course PM-EED-B23-02P4-30 (in orange) shows the most pronounced peaks, suggesting moments of high participation, associated with new evaluation activities added to the latest edition of the course. The other courses show similar behavior.

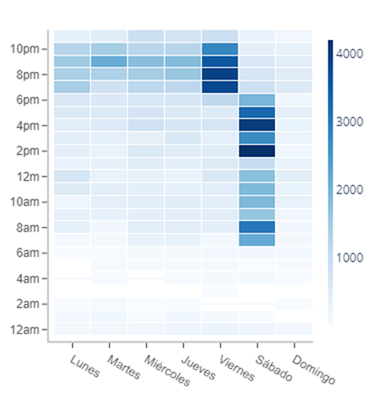
The (Figure 3), in the form of a heat map, shows a clear trend in access patterns to the educational platform, with high levels of activity during direct teaching hours. A significant concentration of access is observed on Saturdays from 8 am to 5 pm, reflecting the teaching activity on this day. Likewise, Fridays present a notable increase in activity between 8 pm and 10 pm, coinciding with scheduled class sessions. Outside of these periods, access levels decrease, although a constant presence of activity is maintained during the evenings of weekdays, indicating a preference for using the platform during post-work hours, which contrasts with other similar studies (Marticorena-Sánchez et al., 2022)
The following pie chart (Figure 4) shows the distribution of the types of user interactions with the educational platform. General interaction with the "System" accounts for the largest share at 43.6%, followed by forums and questionnaires which constitute 16.4% and 13.9% respectively. Tasks account for 13%, while resources, URLs, glossaries, and other user usage occupy smaller segments of the graph. This breakdown indicates that, in addition to general system use, forums and quizzes are the most frequent activities, underscoring their importance as communication and assessment tools within the digital learning environment.

Figure 5 (a) shows the number of accesses per activity, highlighting the teaching strategy seminar and the editors' summary workshop as the most frequented activities, with more than 600 and almost 500 accesses respectively. On the other hand, (b) contrasts this information by showing the number of students who participated in each activity, revealing that the bulletin board and the pedagogical bases of the digital narratives involved the largest number of students, with approximately 60 and more than 50 unique participants respectively. Both graphs provide a comprehensive view of student engagement, evidencing both the frequency of interaction with certain resources and student participation in various course activities.

Additional Results with Jamovi
The results obtained from the evaluation of five editions of the Digital Narratives course reveal significant variations in student behavior in terms of assignments uploaded, participation in forums, completed questionnaires, and contributions to the glossary. Overall, it was observed that the PM-EED-B23-02P4-30 group showed the highest engagement, especially in the number of tasks uploaded (average of 2.7) and questionnaires completed (average of 4.5), while participation in forums was relatively high in all groups, highlighting PM-EED-A23-03P3-21 with an average of 13.4 participations. Variability in contributions to the glossary was less pronounced between groups, suggesting uniformity in this activity across the different editions of the course. (Table 2)
Table 2 - Descriptive statistics of each component analyzed by group
| Group | Mean | Median | SD | |
|---|---|---|---|---|
| Uploaded tasks | PM-EED-A23-02P1-15 | 1.085 | 1 | 1.381 |
| PM-EED-A23-03P1-19 | 0.776 | 0 | 1.388 | |
| PM-EED-B23-01P1-23 | 1.393 | 1.00 | 1.473 | |
| PM-EED-B23-02P4-30 | 2.704 | 2.00 | 2.439 | |
| PM-EED-A23-03P3-21 | 1.321 | 1 | 1.384 | |
| Participation in forums | PM-EED-A23-02P1-15 | 12.475 | 12 | 6.361 |
| PM-EED-A23-03P1-19 | 12.980 | 12 | 5.818 | |
| PM-EED-B23-01P1-23 | 11.964 | 12.00 | 6.666 | |
| PM-EED-B23-02P4-30 | 13.259 | 12.00 | 7.734 | |
| PM-EED-A23-03P3-21 | 13.434 | 12 | 5.940 | |
| Completed questionnaires | PM-EED-A23-02P1-15 | 2.881 | 3 | 1.261 |
| PM-EED-A23-03P1-19 | 3.388 | 3 | 1.077 | |
| PM-EED-B23-01P1-23 | 3.607 | 4.00 | 1.139 | |
| PM-EED-B23-02P4-30 | 4.593 | 5.00 | 1.775 | |
| PM-EED-A23-03P3-21 | 3.585 | 4 | 1.247 | |
| Contributions to the glossary | PM-EED-A23-02P1-15 | 1.407 | 1 | 1.161 |
| PM-EED-A23-03P1-19 | 1.510 | 1 | 1.175 | |
| PM-EED-B23-01P1-23 | 1.268 | 1.00 | 0.884 | |
| PM-EED-B23-02P4-30 | 1.370 | 1.00 | 1.218 | |
| PM-EED-A23-03P3-21 | 1.283 | 1 | 1.215 |
Source: Authors' elaboration
The correlation matrix (Figure 6) obtained through Jamovi indicates that there are strong positive correlations between access to the course and the other components. Furthermore, a strong correlation is evident between completing questionnaires and the tasks uploaded (0.38). Correlations are calculated using Spearman's coefficient, with a sample size of 271, and values range between -1 and 1, where 1 means a perfectly positive correlation.
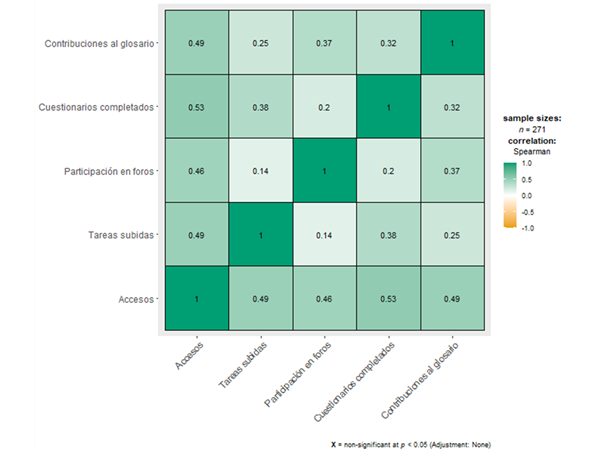
Table 3 shows the results of a non-parametric one-way ANOVA study (Kruskal-Wallis) to assess differences between groups on various activities within the course. The analyses reveal statistically significant differences in the number of accesses (χ² = 41.75, p < .001, ε² = 0.15464), in the tasks uploaded (χ² = 32.45, p < .001, ε² = 0.12017), and in the completed questionnaires (χ² = 54.45, p < .001, ε² = 0.20168), but not in participation in forums or contributions to the glossary, suggesting varied behavior in interaction with the platform.
The PM-EED-B23-02P4-30 group is noticed in particular. In this sense, the Dwass-Steel-Critchlow-Fligner post hoc analyses for pairwise comparisons show significant differences compared to the other groups in terms of accesses (p < .001 with three different groups) and uploaded tasks (p < .001 with three different groups). However, despite an increase in the number of forums available to the PM-EED-B23-02P4-30 group, participation in these did not show a significant increase (p > .05 in all pairwise comparisons), which indicates that the increase in the offer of instructional design activities does not necessarily correlate with an increase in active participation in discussion forums. These results could reflect the need to further investigate strategies to foster engagement in forums and ensure that additional resources provided are aligned with student needs and preferences.
Conclusions
The present study has allowed us to identify clear trends in the interaction of students with the Moodle LMS. Log analysis through Moodle Logs Analytics has revealed that activities such as uploading assignments and taking quizzes are robust indicators of active participation in the course. However, the findings suggest that a greater number of resources or activities does not necessarily guarantee a proportional increase in forum participation, indicating that the quality of interaction could be more significant than the quantity.
This detailed understanding of student behavior is important for the continuous improvement of the courses offered on Moodle. Educators and instructional designers can use these results to refine pedagogical strategies and course resources, which can lead to deeper engagement and a richer learning experience for students.
Based on the results obtained, it is recommended that teachers proactively use Moodle analytics to adjust and personalize learning activities according to the needs of the students. It is important to encourage participation in forums by creating meaningful, motivating, and relevant debates that stimulate interaction and critical discussion. Additionally, managers should consider implementing professional development workshops that train teachers in the effective use of analytical tools.
For future research, it is suggested to explore the relationship between course participation and learning outcomes by using longitudinal studies that follow students over multiple semesters. Likewise, it would be valuable to complement quantitative analyses with qualitative methods that can give context to the numbers and provide a deeper understanding of students' experiences.
Finally, educators are encouraged to design and test pedagogical interventions that seek to improve student engagement and evaluate their effectiveness using log analysis. These interventions could include changes in instructional design, the introduction of new collaborative tools, or the implementation of innovative teaching methodologies that encourage interaction and engagement.

