


Meu SciELO
 Serviços customizados
Serviços Personalizados
Artigo
 texto em
  Espanhol (pdf)
 Artigo em XML
 Referências do artigo
 Enviar este artigo por email
Indicadores
-
 Citado por SciELO
Links relacionados
-
 Similares em
SciELO
Similares em
SciELO
Compartilhar

 Permalink
Revista de Ciencias Médicas de Pinar del Río
versão On-line ISSN 1561-3194
Rev Ciencias Médicas vol.27 no.2 Pinar del Río mar.-abr. 2023 Epub 01-Mar-2023
Articles
Eating habits and nutritional status in adolescents from ESBU Carlos Ulloa
1University of Medical Sciences of Pinar del Rio. Faculty of Medical Sciences "Dr. Ernesto Che Guevara de la Serna". Pinar del Río, Cuba.
Introduction:
correct eating habits during adolescence are considered protective factors against the risk of chronic noncommunicable diseases in adulthood.
Objective:
to identify the frequency of malnutrition by excess or defect in adolescents of the 8th grade of the Carlos Ulloa Urban Basic Secondary School and its relationship with eating habits.
Methods:
an observational, analytical and cross-sectional study was carried out in adolescents of the 8th grade of the Carlos Ulloa Urban Basic Secondary School of the municipality of Pinar del Río. Anthropometric indicators were determined to evaluate the different nutritional phenotypes and eating habits by means of validated self-report questionnaires. Mean, standard deviation, absolute and relative frequencies and mean comparison tests at 95 % confidence were used.
Results:
female sex and excess malnutrition (overweight or obese) predominated with 35,6 %. Statistically significant differences (p<0,05) between sexes were found for waist circumference, tricipital fold, waist-height index and waist-hip index. Frequent omission of breakfast (23,3 %), infrequent consumption of fruits (63,3 %) and vegetables (37,0 %), fish (90,4 %), frequent consumption of sausages and smoked foods (43,8 %) and junk food (37,0 %)
Conclusions:
were found to be inadequate eating habits. Overweight and obesity affected approximately one third of the adolescents studied and poor dietary practices were observed.
Key words: MALNUTRITION; OBESITY; ADOLESCENT; FEEDING BEHAVIOR.
INTRODUCTION
At approximately 10 years of age, boys and girls begin a long journey through adolescence. It is a necessary and important stage in becoming an adult and is defined by the World Health Organization (WHO) as the period of human growth and development that occurs after childhood and before adulthood.1,2
It is one of the most important transitional stages in the life of the human being, in which there is an accelerated growth rate, physical, hormonal, sexual, as well as social and psychoemotional changes, in which food and nutrition processes play a necessary role, which promote a process of maturation and optimal development.2
Young people decide what to eat on a daily basis. And not only that, but also where, how and when they want to eat.3 That is why eating disorders frequently appear at this stage of life, defined as a poor regulation of eating behavior, characterized by behavioral disorders associated with diet, weight and body shape, clinically manifested either by excess or defect, associated with a variety of psychopathology.4
The number of obese children between 5 and 19 years of age has multiplied since the mid-1970s, increasing 10 to 12 times worldwide. Overweight, long considered a condition of the rich, is now increasingly a condition of the poor, reflecting the increased availability of "cheap calories" from fatty and sugary foods in almost every country in the world. This brings with it an increased risk of chronic non-communicable diseases, such as type 2 diabetes and coronary heart disease. Analyses conducted as part of the Global Burden of Disease study suggest that eating practices that lack adequate nutrition are now the leading cause of death worldwide.5
Although numbers vary by country, it is estimated that one in five adolescents is obese and nearly one in three adolescents has a chronic disease.6
Interest in the growth and development of children has increased worldwide. Cuba does not escape from this, which is why, since the beginning of the 70's and at the same time as the Infant Mortality Reduction Program, it started the execution of massive and periodic anthropometric studies of children and adolescents, as part of a practice that is systematically carried out in health areas.7
Anthropometric assessment is currently the most widely used method to assess nutritional status, as it is a simple, inexpensive, sensitive, accurate and replicable method. It consists of a series of physical measurements, based on variables such as weight and height; as well as body composition: arm circumference, triceps folds, abdominal circumference, hip circumference, among others. These variables can be interpreted as a function of age or related to each other, through the construction of indicators such as height for age (T/A), weight for height (W/L), weight for age (W/A) and body mass index (BMI), in 2010 reference standards for these indicators were adopted, those established by the World Health Organization (WHO).8
Like BMI, waist circumference is an anthropometric measurement that has become especially relevant since the recognition of abdominal obesity as an indicator of increased risk of cardiometabolic factors.9,10
There are few research works in Pinar del Río province that deal with the problem of nutritional status and eating habits in adolescents, which makes it necessary to provide more evidence in relation to the association of inadequate nutritional habits with nutritional disorders either by excess or defect, as well as the relationship with the frequency of food consumption, therefore, the present research aims to identify the frequency of malnutrition by excess or defect in adolescents of the 8th grade of ESBU Carlos Ulloa and its relationship with eating habits.
METHODS
An observational, analytical and cross-sectional study was carried out in adolescents belonging to the 8th grade of the Carlos Ulloa ESBU in the city of Pinar del Río. The universe was constituted by all the 8th grade students of the ESBU Carlos Ulloa (n=346), it was possible to include 73 students due to the epidemiological situation of COVID-19.
Which met the following inclusion criteria: Adolescents of the 8th grade of the ESBU Carlos Ulloa to whom it was possible to perform all the anthropometric measurements and who could answer the questionnaires of eating habits after consultation with their tutors (parents or guardians). The following were excluded: Adolescents who did not consent to participate in the study by their own decision or that of their guardians and who were unable to answer the questionnaires or take the anthropometric measurements.
Prior coordination was made with the management of the Carlos Ulloa ESBU to obtain authorization to carry out the study. The authorization was accepted and coordination was made with the person in charge of the eighth grade to organize the different moments in which all the determinations of the present study would be made according to the possibilities of the teaching schedule. In addition, a meeting was arranged with the guardians of these adolescents to inform them of the objectives and conditions of the study in an attempt to obtain their consent for the inclusion of their children in the research.
A room with adequate conditions was prepared in which the following anthropometric determinations were made: Weight, Height, Waist circumference (CCi), hip circumference (CC) and tricipital fold (PT) with which it was possible to calculate the indicators body mass index (BMI), waist-height index (WHI) and waist-hip index (WHI).
Body height and weight were measured according to internationally standardized protocols (11), using an electronic digital scale (KERN, United States) with a resolution of 0.100 kg and an attached stadiometer. BMI was calculated according to the formula weight(kg)/height2(m) and was considered obese if the BMI was >percentile (pc) 97 according to age and sex in the curves for Cuban children and adolescents, overweight if the BMI was > pc 90 and ≤ pc 97, normal weight if the BMI was between pc 10 and 90 and underweight if the BMI was < pc 10. Cci was measured at the end of a smooth expiration, with the subject in a standing position, at the midpoint between the lower costal border and the iliac crest at the level of the mid-axillary line, and parallel to the standing plane. Hip circumference was measured at the level of the gluteal prominence and the ICC was calculated as the ratio between waist and hip circumference.
The ICT was calculated from the current values of the subject's CCi and Height as described previously
In addition, the arm circumference was measured using a tape measure which was placed in the middle part of the arm taking as reference the length between the tip of the shoulder (acromion) and the head of the radius (olecranon).
The tricipital crease was measured using a metallic Holtain plicometer calibrated in millimeters and the midpoint of the arm was carefully chosen, which is none other than the midpoint between the acromion at its most superior and external point and the head of the radius at its lateral and external point. The measurement was taken with the arm relaxed and hanging laterally, with the shoulder joint in slight external rotation and the elbow extended. The crease formed parallel to the longitudinal axis, with the thumb and index finger of the left hand was separated from the underlying muscle and measured at that point, placing the plicometer perpendicular to the crease. was taken on the posterior aspect of the arm, over the triceps muscle, midway between the lateral projection of the acromion process of the scapula and the inferior margin of the olecranon process of the ulna. The following questionnaires were printed to be applied individually to each of the subjects included:
- General data form for adolescents.
- Food Consumption Frequency Questionnaire: which was applied in the classrooms on the same day the measurements were taken, trying to ensure the comfort and safety of the students so that they could answer the questionnaire freely and calmly.
The basic descriptive parameters were estimated: mean, standard deviation for quantitative variables and absolute frequencies (No.) and absolute percentage frequencies (%) for qualitative variables. The distribution of the variables was characterized and the normality assumptions were checked for the tests that required it.
A mean comparison test was performed for quantitative variables (Mann Whitney U) between the two sexes. The chi-square test for comparison of proportions by group was also used. All tests were performed with 95% certainty. The results were expressed in tables to facilitate a quicker understanding. The data were processed using SPSS (21) for Windows.
This research was carried out with the previous authorization of the Research Ethics Committee of the Faculty of Medical Sciences Dr. "Ernesto Che Guevara de la Serna". All data obtained will be used for strictly scientific purposes and will only be disclosed in events and published in prestigious journals.
Prior to the study, a meeting was held with the tutors of all the students who were tutors of these adolescents to inform them of the objectives and conditions of the study and to try to obtain their consent for the inclusion of their children in the research.
The researchers undertook not to record any data that could be used to identify the patients included in the study, and no patient was excluded from the study for reasons of skin color, sex or ideology.
RESULTS
The results obtained by studying a sample of 73 adolescents in the 8th grade of the Carlos Ulloa ESBU are shown in this section. The 73 students were 13 years old at the time this research was carried out.
Table 1 shows the different existing nutritional phenotypes taking into account the values of the Body Mass Index and sex in the population of adolescents studied
Table 1 Nutritional phenotypes existing in the population of adolescents studied according to Body Mass Index and sex.
| Evaluation according to BMI | Sex | |||||
|---|---|---|---|---|---|---|
| Female | Male | Total | ||||
| No. | % | No. | % | No. | % | |
| Underweight | 2 | 66,7 | 1 | 33,3 | 3 | 4,1 |
| Normal weight | 25 | 56,8 | 19 | 43,2 | 44 | 60,3 |
| Overweight | 7 | 50,0 | 7 | 50,0 | 14 | 19,2 |
| Obese | 7 | 58,3 | 5 | 41,7 | 12 | 16,4 |
| Total | 41 | 56,2 | 32 | 43,8 | 73 | 100,0 |
X2=0,38 p=0.944128415
As can be seen in Table 1, 56,2 % of the adolescents studied were female, with a predominance of 56,2 %. It should be noted that according to the assessment of body mass index according to age and sex of the participants, 4,1% of the sample was evaluated as underweight and 35,6 % presented overweight (19,2 %) or obesity (16,4 %) as nutritional phenotype. Malnutrition by defect was more frequent among females (66,7 % vs. 33,3 %), the same was observed with obesity (58,3 % vs. 41,7 %), however, in the case of overweight it was manifested in a similar way in both sexes (50,0 % each). When the test for comparison of proportions was performed, it was found that there were no statistically significant differences between both sexes for the different nutritional phenotypes (p>0,05).
Table 2 shows the descriptive statistics (mean and standard deviation) of the different anthropometric indicators obtained in the population studied according to the sex of the adolescents.
Table 2 Average values of the anthropometric indicators according to sex of the adolescents.
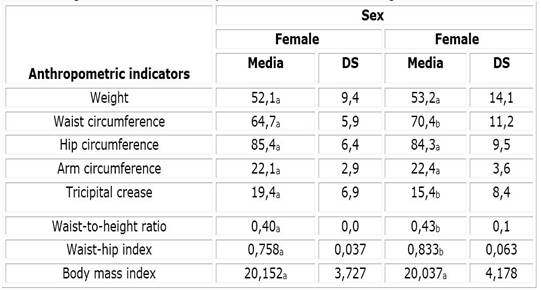
Note: values in the same row and subtable that do not share the same subscript are significantly different at p<0.05 in the two-sided test of equality for column means.
It can be seen that males had higher mean values for waist circumference, arm circumference, weight, waist-height index, and waist-hip index while the female sex showed higher mean values for hip circumference, tricipital fold, and body mass index. The differences were statistically significant (p<0,05) between both sexes for waist circumference, tricipital fold, waist-height index and waist-hip index.
In relation to the eating habits present in the adolescents included in this study, several of the results obtained from the application of the food consumption frequency questionnaire will be shown. Table 3 shows a first element of the questionnaire referring to the frequency with which the main meals are eaten on an average adolescent's day.
Table 3 Frequency of main meals per day.
| Response to the question | Frequency | No. | % |
|---|---|---|---|
| You eat breakfast | every day | 52 | 70,3 |
| almost always | 4 | 5,4 | |
| sometimes | 13 | 17,6 | |
| Never | 4 | 5,4 | |
| Morning snack daily | every day | 27 | 36,5 |
| almost always | 9 | 12,2 | |
| sometimes | 24 | 32,4 | |
| Never | 13 | 17,6 | |
| Daily lunch | every day | 68 | 91,9 |
| almost always | 5 | 6,8 | |
| Late snack daily | every day | 49 | 66,2 |
| almost always | 5 | 6,8 | |
| sometimes | 13 | 17,6 | |
| Never | 6 | 8,1 | |
| You eat lunch | every day | 71 | 95,9 |
| almost always | 2 | 2,7 |
Source: Food consumption frequency questionnaire.
As for eating habits that are referred to as inadequate according to the guidelines of healthy eating patterns, it is noteworthy that 5,4 % of adolescents never eat breakfast and 17,6 % only eat breakfast sometimes. Some 17,6 % never have a snack in the morning and 32,6 % do so only sometimes. Of those included, 8,1% never snack in the afternoons and 17,6 % do so only sometimes. 6,8 % reported that they almost always ate lunch and 2,7 % that they almost always ate lunch in the afternoon, which shows that a percentage of the adolescents sometimes omitted these two main meals of the day.
Table 4 Frequency of weekly consumption according to type of food.
| Times x week | No. | % | |
|---|---|---|---|
| Frequency of fruit consumption | None | 12 | 16,4 |
| 1-2 | 34 | 46,6 | |
| 3-6 | 14 | 19,2 | |
| Daily | 11 | 17,8 | |
| Frequency of consumption of vegetables | None | 11 | 15,1 |
| 1-2 | 16 | 21,9 | |
| 3-6 | 21 | 28,8 | |
| Daily | 25 | 34,2 | |
| Frequency of consumption of legumes | None | 2 | 2,7 |
| 1-2 | 4 | 5,4 | |
| 3-6 | 16 | 21,9 | |
| Daily | 61 | 69,9 | |
| Frequency of consumption of rice and cereals | None | 0 | 0,0 |
| 1-2 | 0 | 0,0 | |
| 3-6 | 0 | 0,0 | |
| Daily | 73 | 100,0 | |
| Frequency of consumption of food | None | 14 | 19,2 |
| 1-2 | 29 | 39,7 | |
| 3-6 | 20 | 27,0 | |
| Daily | 10 | 13,5 | |
| Frequency of consumption of meat | None | 3 | 4.1 |
| 1-2 | 8 | 11.0 | |
| 3-6 | 22 | 30,1 | |
| Daily | 40 | 54,8 | |
| Frequency of consumption of eggs | None | 7 | 9,5 |
| 1-2 | 15 | 20,5 | |
| 3-6 | 24 | 32,9 | |
| Daily | 27 | 37,0 | |
| Frequency of consumption of fish | None | 44 | 60,3 |
| 1-2 | 22 | 30,1 | |
| 3-6 | 5 | 6,8 | |
| Daily | 1 | 1,4 | |
| Frequency of consumption of sausage | None | 9 | 12,3 |
| 1-2 | 21 | 28,8 | |
| 3-6 | 23 | 31,5 | |
| Daily | 20 | 27,0 | |
| Frequency of consumption of dairy products | None | 13 | 17,8 |
| 1-2 | 9 | 12,3 | |
| 3-6 | 12 | 16,4 | |
| Daily | 39 | 53,4 | |
| Frequency of consumption of bread | None | 1 | 1,4 |
| 1-2 | 1 | 1,4 | |
| 3-6 | 4 | 5,4 | |
| Daily | 67 | 91,8 | |
| Frequency of consumption of carbonated soft drinks or powdered soft | None | 25 | 34,2 |
| 1-2 | 20 | 27,4 | |
| 3-6 | 11 | 15,1 | |
| Daily | 17 | 23,3 | |
| Frequency of consumption of candy | None | 8 | 11,0 |
| 1-2 | 24 | 32,9 | |
| 3-6 | 18 | 24,6 | |
| Diariamente | 23 | 31,1 | |
| Frequency of consumption of pizzas | None | 26 | 35,6 |
| 1-2 | 30 | 41,1 | |
| 3-6 | 11 | 15,0 | |
| Daily | 6 | 8,2 | |
| Frequency of consumption of confectionery cookies | None | 21 | 28,8 |
| 1-2 | 27 | 37,0 | |
| 3-6 | 15 | 20,5 | |
| Daily | 8 | 11,0 |
Source: Food consumption frequency questionnaire.
Table 4 shows the frequency of weekly consumption by type of food. In line with what is considered ideal in healthy eating patterns, the daily consumption of fruits and vegetables is an essential element in an adolescent's diet. Table 4 shows the frequency of weekly consumption by type of food. In line with what is considered ideal in healthy eating patterns, the daily consumption of fruits and vegetables is an essential element in an adolescent's diet. Table 4 shows that only 17,8 % of the subjects included consume a portion of fruit daily and only 34,2 % consume vegetables daily. It is noteworthy that more than 50 % of the respondents reported never or only once or twice a week consuming fruit and nearly 40 % reported the same for vegetable consumption. In relation to the consumption of legumes, 69,9 % consumed them daily and in the case of rice and cereals, 100 % of the respondents reported consuming them daily and up to twice a day. It should be noted that only 13,5 % of those surveyed consumed viands on a daily basis and 19,2 % never consumed them.
When evaluating the consumption patterns of protein-rich foods, 54,8 % of those surveyed reported consuming meat daily. Thirty percent of the adolescents reported not eating eggs ever (9,5 %) or only once or twice a week (20,5 %). Of those included, 60,3 % never consumed fish and only 1 % consumed it daily. Regarding the consumption of sausages (ham, sausages, chorizo or ham), it should be noted that the majority reported consuming them either daily (27,0 %) or between 3 and 6 times a week (31,5 %); only 12,3 % reported that they never consumed them. A total of 53,4 % of the subjects surveyed reported consuming dairy products daily and 17,8 % never consumed them.
A total of 91,8 % of the adolescents included reported consuming bread daily, with consumption frequencies per day ranging between two and three units of bread according to the food product card. Few adolescents among those studied never consumed bread, only 1,4 %. The questionnaire also inquired about the consumption of carbonated or powdered soft drinks and 23,3 % reported consuming them daily, while 34,2 % never consumed them. More than 50 % of the respondents reported consuming sweets with a high frequency in a week, 31,1 % daily and 24,6 % between 3 and 6 times per week. A total of 8,2 % reported consuming pizzas daily, although the majority only reported occasional consumption 1 to 2 times per week (41,1 %). About 30 % of the respondents answered that they consume jams quite frequently (11,0 % daily and 20,5 % between 3 and 6 times per week).
Table 5 illustrates the average number of meals per day according to nutritional status as assessed by body mass index.
Table 5 Average values of the number of meals per day according to the nutritional status of the adolescent.
| Assessment according to BMI | Number of meals per day | ||
|---|---|---|---|
| Mean | Standard deviation | Mean | |
| Underweight | 3,667 | 0,5774 | 3 |
| Normal weight | 3,955 | 0,8056 | 44 |
| Overweight | 3,786 | 0,6993 | 14 |
| Obese | 4,417 | 0,5149 | 12 |
| Total | 3,986 | 0,7545 | 73 |
Source: Food consumption frequency questionnaire.
It was found that the average number of meals per day was higher in those evaluated as obese (4,417) and lower in the case of the malnourished (3,667).
Table 6 summarizes the poor nutritional practices according to the nutritional phenotype assessed by body mass index.
Table 6 Nutritional malpractices according to nutritional phenotype assessed by body mass index.
| Poor nutritional practices | Underweight | Normal Weight | Overweight or obese | Total | ||||
|---|---|---|---|---|---|---|---|---|
| No. | % | No. | % | No. | % | No. | ||
| Frequent omission of breakfast | 1 | 33,3 | 11 | 78,6 | 4 | 15,4 | 16 | 21,9 |
| Less than 3 meals per day | 0 | 0,0 | 2 | 14,3 | 0 | 0,0 | 2 | 2,7 |
| Infrequent consumption of fruits | 2 | 66,7 | 27 | 61,4 | 17 | 65,4 | 46 | 63 |
| Infrequent consumption of vegetables | 0 | 0,0 | 15 | 34,1 | 12 | 46,2 | 27 | 37 |
| Infrequent consumption of dairy products | 1 | 33,3 | 13 | 29,5 | 8 | 30,8 | 22 | 30,1 |
| Infrequent consumption of meats | 0 | 0,0 | 7 | 15,9 | 4 | 15,4 | 11 | 15,1 |
| Infrequent consumption of fish | 3 | 100,0 | 40 | 90,9 | 23 | 88,5 | 66 | 90,4 |
| Frequent consumption of sausages and smoked | 0 | 0,0 | 14 | 31,8 | 10 | 38,5 | 32 | 43,8 |
| High frequency of consumption of sweets, carbonated or powdered soft drinks, jams | 2 | 66,7 | 13 | 29,5 | 8 | 30,8 | 23 | 31,5 |
As can be seen, this table attempts to summarize some elements considered as bad nutritional practices according to the principles of healthy eating. It can be seen that, in general, the infrequent consumption of fruit (63,0 %), fish (90,4 %) and vegetables (37,0 %) predominates. In addition, 43,8 % of the adolescents included frequently consumed sausages and smoked food and 31,5 % reported frequent consumption of sweets, fizzy or powdered soft drinks and jams. In an attempt to relate these unhealthy practices to nutritional status, it is noticeable that no regularities were observed in the possession of unhealthy eating habits and the nutritional status of the adolescents included, since the different poor nutritional practices were manifested in a similar way in each of the nutritional statuses.
DISCUSSION
Adolescence is characterized by changes in eating behavior, which is influenced by the family and school environment, generally resulting in increased consumption of unhealthy foods and placing adolescents at risk of malnutrition, whether due to excess or deficiency.13
The present study found that the highest percentage of the adolescents included in the study were normal weight and that underweight was not a health problem among them (only 4.1% of the sample). Significantly, more than one third of the adolescents were overweight or obese as a nutritional phenotype.
The above finding is consistent with a study by Sánchez Mata M and collaborators,13) conducted in Ecuador in 120 adolescents aged 14 to 18 years which reported that about 30.0% of its sample presented overweight or obesity. Marca Gómez,14) GR in a study published in 2017 observed that 29 % of his series of adolescents presented overweight and 5.6% obesity results that coincide with the result of the present research.
In Mexico, an increase in the prevalence of overweight and obesity has been observed in all ages, including adolescents, according to UNICEF reports. A study published in this country reported prevalence percentages of overweight or obesity of 43,1 % and also found 20,9 % malnutrition, results that are not consistent with those of the present study, in which nutritional disorders due to excess were less frequent and malnutrition was not observed to affect so many adolescents.15
The literature consulted reports that an increase in overweight and obesity in adolescents has been confirmed internationally, not only in developed or industrialized countries, but also in developing countries, including Latin American countries; the problem has acquired such magnitude that the WHO considers obesity in all age groups to be a global epidemic requiring intensive prevention measures and specific attention in all countries.16
The main factor related to this epidemic has to do with the profound changes in the way the world population eats. One of the major ones has been the progressive replacement of homemade dishes and meals by ultra-processed products,17) displacing natural or minimally processed products. Abundant scientific literature clearly supports the strong link between the increased consumption of these ultra-processed products and the increase in body weight.(18.19) In addition, another of the determining factors for the rapid growth of this ultra-processed market has been the huge amount of advertising and propaganda that has accompanied them.19
Another important factor related to obesity is the insufficient physical activity of the population. A large part of the population lives today in cities where most jobs are sedentary; cities are planned prioritizing individual motorized modes of transport; cities are unsafe, which makes people stay at home. In addition, the forms of recreation have changed: there is a lack of green spaces, of public spaces accessible to the majority for recreation and sports; the hegemonic forms of recreation are in front of the TV and computer screen. Encouragement of a culture of physical activity is no longer an important part of school education.18
Regarding the average values of the anthropometric indicators according to sex of the adolescents, it could be seen that males had higher average values for waist circumference, arm circumference, weight, waist-height index, and waist-hip index, while females showed higher average values for hip circumference, tricipital fold and body mass index.
Anthropometry facilitates the assessment of risks associated with reduced lean body mass as well as excess adiposity. Adolescent girls and boys show differences in body composition attributable to the effects of female (estrogen) and male (testosterone) sex hormones. The percentage of fat is higher in the female sex, while the lean component predominates in the male sex, which is reflected in the values corresponding to the tricipital fold (higher in females as well as hip circumference), arm circumference (higher in males due to greater muscle mass).
Regarding body fat, males tend to accumulate more fat in the central part of the body, besides not having a narrow waist as in the case of females due to the action of estrogens, which could explain the greater waist circumference in males than in females found in this study and the greater hip circumference observed in females.20
Few studies are reported that prove sex differences in anthropometric indicators in females and values during adolescence.
It should be noted that in the specialized literature there are inconsistencies in the results comparing BMI between male and female adolescent students. Studies carried out with students from Costa Rica,21) and Colombia,22) indicate that females present higher BMI and weight than males, unlike other studies carried out with adolescents from Mexico and Spain in which males present a higher BMI than females. Robles Cerda A,23) in his research did not find differences in BMI between both sexes; however, he did find that the group of males showed a higher weight than the group of females, a result that agrees with that of the present study. Similar results were found by researchers from Spain,24) and Mexico.25)
The results of the present study regarding the differences in waist circumference are consistent with a study conducted in the Maracaibo municipality of Zulia State, Venezuela, in which a constant increase in CC values was observed in the male group from the age of 10 years onwards. In this study and in all the countries analyzed, waist circumference values increased with age and were higher in males than in females.26
Similar results were found in a study conducted in children and adolescents from Havana where the values of the adjusted curves of the 3, 10, 25, 50, 50, 75, 90 and 97 percentiles of waist circumference were always higher in children and in both cases increased with age, although the absolute increase was higher in the male sex.27
In relation to dietary habits, the present study showed inadequate dietary habits among adolescents, such as omission of breakfast, infrequent consumption of fruits and vegetables and fish, and frequent consumption of sausages, smoked foods and junk food.
This result is consistent with the study conducted by López Dávila,28 on adolescents aged 11 to 15 years from a high school in San Luis Potosí, who reported the existence of deficient eating habits, which are similar to those of this study, although Ruiz Cáceres and collaborators, 29) did not agree, showing that 83 % of the students achieved adequate habits.
The results of the World School Health Survey show that children and adolescents who attend school without breakfast or after having a light breakfast have a lower attention span and concentration, lower morning physical performance, as well as poorer nutritional status.30)
The frequent omission of breakfast was also reported in a study carried out in adolescents in high school in Havana province, which showed that breakfast was one of the meals most frequently omitted by adolescents in the series studied.31 Likewise, it is reported in the research by Navarro Cruz AR and collaborators,32) in a sample of 500 students from all faculties of a private university, in which 38,4 % omitted breakfast 2 to 4 times a week.
Breakfast is considered the most important meal of the day because the food eaten is the first to be consumed after a long period of fasting derived from sleeping hours, and it also precedes the hours of the day when adolescents are most active, since this is the time when they go to school, when they require maximum attention and wakefulness, and where they also engage in sports activities and therefore expend the maximum amount of energy.
Children and adolescents who eat breakfast have better physical and intellectual performance; an optimal breakfast is one that provides 20 to 25 % of the daily caloric requirement and contributes to a varied intake of nutrients (carbohydrates, proteins, fats and micronutrients). People who do not eat breakfast have a greater tendency to obesity due to the fact that prolonged fasting makes them when the first meal is ingested it is done in a disproportionate manner (that is, in abundant quantity) accumulate it as a body reserve.33
In relation to the number of meals per day, the results of the present study show that on average, the adolescents included in this study eat 3 to 4 meals per day. This is in agreement with the WHO recommendation of 4 or 5 meals per day. This finding is in agreement with that found by Menéndez Mato D and collaborators,34) who state that in their study series, the highest percentage corresponds to those who eat four or five meals a day (67 %), with few respondents eating 3 meals a day or even less (12,9 %) and 20,1 % confessing to eating at least 6 times a day.
The low consumption of fruits and vegetables found in this research coincides with the reports of a study carried out in adolescents from the Cerro Guayabal community in Ecuador, who had a preference for cereals and low preferences for fruits and vegetables.1
The study conducted by Acosta Favela and collaborators,35) with 101 children from 11 to 12 years old in Ciudad Juarez, Northern State of the Mexican Republic, affirms that in inadequate conditions (bad eating habits and little physical activity) these variables are responsible for overweight and obesity. Regarding dietary habits, these authors reported that the subjects included had a high consumption of hamburgers and soft drinks, while the consumption of fruits and vegetables was low, a result similar to that of the present study.
The result of the research also coincides with the study carried out in Havana adolescents, in which less than half of the sample included consumed fruits and vegetables daily.27) Alfaro González M and collaborators,36 conducted a study on the eating habits of adolescents in Valladolid in which they observed that 42,6 % consumed fruits and 16,1 % consumed vegetables every day, results that do not agree with those of the present study.
Fruits are a great source of water, rapidly absorbed sugars, vitamin C and carotenes that serve as antioxidants, potassium and dietary fiber that contribute to proper nutrition for optimal growth and development. Vegetables are also an important source of many nutrients, such as fiber, minerals: potassium, manganese, copper, magnesium, iron and vitamins A, B, C, E, K, folate, thiamine, niacin and choline. Adequate consumption of fruits and vegetables should be 4 to 5 times a day, i.e. consume fruits 2 to 3 times a day and vegetables 1 to 2 times a day.37
In the last 15 years, reviews of the most important scientific publications have linked higher consumption of fruits and vegetables to a lower risk of developing cancer. The impact could be as much as a 35 % decrease in all cancers. More specifically, such a reduction would be 20 % for cancers of the mouth, esophagus, lungs, cervix and bladder; and 50 % for cancers of the pancreas, gallbladder, breast and uterus. In addition, the higher consumption of fiber present in fruits and vegetables, and the presence of certain phytochemicals contribute to reduce, up to 31 %, the risk of ischemic heart disease. Other possible benefits of achieving an ideal consumption of fruits and vegetables is that they help to create a feeling of satiety and to reduce total calorie intake.37
High consumption of junk, fried and smoked foods are eating habits with recognized detrimental effects on health at any age. They are known to be associated with cancer, arterial hypertension, type II diabetes mellitus and dyslipidemia, among others. This result is similar to what was observed in Havana adolescents who, when analyzing the frequency by food groups, it was found that among the food groups they liked most were those rich in saturated fatty acids and trans fatty acids that raise LDL-cholesterol and reduce HDL-cholesterol, and in general, increase the risk of arterial hypertension (AHT), obesity and other non-transmissible diseases, when their consumption is exceeded and these same foods, inappropriately, were mostly consumed on a daily basis. Some of them (jams and sweets) are also made up of simple sugars, which were also, erroneously, mostly consumed on a daily basis.
These foods contribute to overweight, obesity and cardiovascular disease risks. These authors also reported a tendency to increase soft drinks and other beverages in the daily consumption diet.27
Infantes Urtecho in 2016,38 included in his study 79 Peruvian high school adolescents shows results on eating habits and nutritional status similar to those of this work with a minimum percentage of underweight or thinness 1,7 %; Normal; 91 % and higher values of overweight 7 % and obesity 1 %, the latter values (overweight and obesity) Likewise, eating habits were normal (good) only in 12 % of adolescents and the rest present poor eating habits. This author concludes that there is a highly significant relationship (p=0.00001) between the eating habits of high school students and their anthropometric values.
These findings together with those previously collected reinforce the importance of promoting better eating habits; aware that students both at school level and those already adolescents spend a good part of the day at school in the company of their teachers, classmates and friends. At this stage, social interaction between students, teachers, parents, classmates and the media in their environment plays a key role, and the school environment acquires great relevance due to its influence on the structuring of eating habits. For this reason, health promotion in nutritional matters should be contemplated from a formal perspective within the school curriculum.
It is concluded that overweight and obesity affected approximately one third of the adolescents studied, and poor eating practices were observed.
BIBLIOGRAPHIC REFERENCE
1. Giler Vásquez YA, Moreira Macias P, Hernández González A, Cardoson Pérez CN, Farnés Carrilo O. Determinantes de salud en adolescentes de la comunidad Cerro Guayabal, Ecuador. Rev Cubana Salud Púb [Internet]. 2019 [citado 05/02/2021]; 45(2): e1451. Disponible en: Disponible en: https://scielosp.org/article/rcsp/2019.v45n2/e1451/ 1. [ Links ]
2. ¿Qué es la adolescencia? [Internet]. Uruguay: UNICEF; 2020 [citado 04/04/2021]. Disponible en: Disponible en: https://www.unicef.org/uruguay/que-es-la-adolescencia 2. [ Links ]
3. Morales Pérez AR, Rodríguez Ribalta I, Massip Nicot J, Sardinas Arce ME, Balado Sansó R, Morales Viera L. Preferencias y conductas alimentarias en adolescentes de secundaria básica. Rev Cubana Pediatr [Internet]. 2021 Jun [citado 30/08/2022]; 93(2): e968. Disponible en: Disponible en: http://scielo.sld.cu/scielo.php?script=sci_arttext&pid=S0034-75312021000200005&lng=es 3. [ Links ]
4. Gaete PV, López CC. Trastornos de la conducta alimentaria en adolescente. Una mirada integral. Rev Chil Pediatr [Internet]. 2020 [citado 14/09/2020]; 91(5): 784-93. Disponible en: Disponible en: https://www.scielo.cl/scielo.php?script=sci_arttext&pid=S0370-41062020000500784 4. [ Links ]
5. UNICEF. Estado Mundial de la Infancia 2019 Niños, alimentos y nutrición Crecer bien en el mundo en transformación [Internet]. New York, EEUU: UNICEF; 2019 [citado 05/04/2020]. Disponible en: Disponible en: https://www.unicef.org/media/62486/file/Estado-mundial-de-la-infancia-2019.pdf 5. [ Links ]
6. Villares Moreno JM, Segovia Galiano MJ. Nutrición en el adolescente: aclarando mitos. ADOLESCERE [Internet]. 2019 [citado 14/09/2020]; 7(2): 14-21. Disponible en: Disponible en: https://www.adolescere.es/nutricion-en-el-adolescente-aclarando-mitos/ 6. [ Links ]
7. Gómez Valdés W, de la Campa Álvarez LG, Reyes Espinosa TM, Tobar Palma F. Estado nutricional en adolescentes, exceso de peso corporal y factores asociados. Rev Cubana Endocrinol [Internet]. 2011 Sept-Dic [citado 14/09/2020]; 22(3): 225-36. Disponible en: Disponible en: http://scielo.sld.cu/scielo.php?script=sci_arttext&pid=s1561-29532011000300005 7. [ Links ]
8. Organización Mundial de la Salud. Obesidad y sobrepeso. Datos y cifras [Internet]. Washington: OMS; 2020 [citado 10/12/2020]. Disponible en: Disponible en: https://www.who.int/es/news-room/fact-sheets/detail/obesity-and-overweight 8. [ Links ]
9. Cordeiro de Souza W, Abreu de Lima V, Nesi França S, Barth Rebesco D, Leite N, Gomes Mascarenhas LP. Asociación del índice de masa corporal con la absorciometría con rayos X de doble energía (DEXA) en diabéticos tipo 1. Rev Cubana Med Mil [Internet]. 2019 [citado 05/02/2020]; 48(2): e306. Disponible en: Disponible en: http://scielo.sld.cu/scielo.php?script=sci_arttext&pid=S0138-65572019000200010&lng=es&nrm=iso&tlng=es 9. [ Links ]
10. Pujilestari CU, Nyström L, Norberg M, Ng N. Waist Circumference and All-Cause Mortality among Older Adults in Rural Indonesia. Int J Environ Res Public Health [Internet]. 2019 Jan [citado 03/12/2019]; 16(1): 116. Disponible en: Disponible en: https://www.ncbi.nlm.nih.gov/pmc/articles/PMC6339011/ 10. [ Links ]
11. Lohman TG, Roche AF, Martorell R. Anthropometric standardization reference manual [Internet]. Champaign, Illinois: Human Kinetics Books; 1988 [citado 10/01/2019]. Disponible en: Disponible en: https://www.worldcat.org/title/anthropometric-standardization-reference-manual/oclc/15592588 11. [ Links ]
12. Martínez Montaño MLC, Blázquez Gutiérrez ME, Hernández Hernández ME, López Moreno P, Ortiz Bueno AM, Kammar García A, et al. Índice cintura-talla: prueba para valoración de riesgo cardiovascular y diagnóstico del síndrome metabólico. Rev Cubana Med [Internet]. 2017 [citado 10/12/2020]; 56(2): 109-18. Disponible en: Disponible en: http://scielo.sld.cu/scielo.php?script=sci_arttext&pid=S0034-75232017000200003&lng=es 12. [ Links ]
13. Sánches Mata M, Alejandro Morales S, Bastidas Vaca C, Jara Castro M. Evaluación del estado nutricional de adolescentes en una Unidad Educativa de Ecuador. Revista Ciencia UNEMI [Internet]. 2017 Dic [citado 13/05/2021]; 10(25): 1-12. Disponible en: Disponible en: https://dialnet.unirioja.es/servlet/articulo?codigo=6645973 13. [ Links ]
14. Marca Gómez GR. Conductas obesogénicas relacionadas al estado nutricional en adolescentes de la Institución educativa Secundaria Industrial N°32 Puno-2016 [Tesis]. Puno, Perú: Universidad nacional de Altiplano; 2017 [citado 13/05/2021]. Disponible en: Disponible en: http://repositorio.unap.edu.pe/handle/UNAP/3632 14. [ Links ]
15. Ramos M. El doble reto de la malnutrición y la obesidad [Internet]. México: Unicef México; 2017 [citado 13/07/2020]. Disponible en: Disponible en: https://www.unicef.org/mexico/spanish/17047.htm 15. [ Links ]
16. Organización Mundial de la Salud. Obesidad y sobrepeso. Datos y cifras [Internet]. Washington: OMS ; 2021 [Actualizado el 16 de febrero de 2018; citado 05/04/2021]. Disponible en: Disponible en: http://www.who.int/es/news-room/fact-sheets/detail/obesity-and-overweight 16. [ Links ]
17. Koncke F, Toledo C, Berón C, Carriquiry A. El consumo de productos ultraprocesados y su impacto en el perfil alimentario de los escolares uruguayos. Arch Pediatr Urug [Internet]. 2021 [citado 16/09/2021]; 92(2): e213. Disponible en: Disponible en: http://www.scielo.edu.uy/scielo.php?script=sci_arttext&pid=S1688-12492021000301213&lang=es 17. [ Links ]
18. Drake I, Abeyá Gilardon E, Mangialavori G, Biglieri A. Descripción del consumo de nutrientes según el nivel de procesamiento industrial de los alimentos. Encuesta Nacional de Nutrición y Salud-2005. Arch Argent Pediatr [Internet]. 2018 [citado 13/09/2020]; 116(5): 345-52. Disponible en: Disponible en: http://www.scielo.org.ar/scielo.php?script=sci_arttext&pid=S0325-00752018000500009&lang=es 18. [ Links ]
19. Mamani Urrutia V, Dominguez Curi CH, Moreno Díaz AL, Silva Díaz V, Bustamante López A. Evaluación de alimentos procesador y ultraprocesados: Un análisis antes de la implantación del etiquetado frontal en Perú. Rev Chil Nutr [Internet]. 2021 Jun [citado 13/04/2021]; 48(3): 355-65. Disponible en: Disponible en: https://www.scielo.cl/scielo.php?script=sci_arttext&pid=S0717-75182021000300355&lng=es&nrm=iso&tlng=es 19. [ Links ]
20. Rodriguez Rodriguez F, Santibañez Miranda M, Montupín Rozas G, Chávez Ramírez F, Solis Urra P. Diferencias en la composición corporal y actividad física en estudiantes universitarios según año de ingreso. Univ Salud [Internet]. 2016 Dec [citado 13/06/2021]; 18(3): 474-81. Disponible en: Disponible en: https://pesquisa.bvsalud.org/portal/resource/pt/biblio-963333 20. [ Links ]
21. Barquero Jiménez D. Índice de masa corporal (IMC) y su relación con la edad en una población de estudiantes de secundaria en el Colegio de San Pedro de Poás [Tesis]. Heredia, Costa Rica: Universidad Nacional de Costa Rica; 2017 [citado 15/05/2021]. Disponible en: Disponible en: https://rstudio-pubs-static.s3.amazonaws.com/328342_1f638ec407204e1c9f2c11a6ddbac8bd.html 21. [ Links ]
22. Ortega Bonilla R, Chito Trujillo D. Valoración del estado nutricional de la población escolar del municipio de Argelia, Colombia. Rev Salud Pública [Internet]. 2014 [citado 14/05/2021]; 16(4): 547-59. Disponible en: Disponible en: http://www.scielo.org.co/scielo.php?pid=S0124-00642014000400007&script=sci_abstract&tlng=es 22. [ Links ]
23. Robles Cerda A, León Hernández R, González Reyes S, Méndez Santos G, Gómez Péresmitré G, Platas Acevedo S. Indicadores antropométricos en adolescentes mujeres y hombres del sur de Tamaulipas. Un estudio comparativo. Educación y Salud [Interne]. 2020 [citado 13/06/2021]; 8(16): 123-8. Disponible en: Disponible en: https://repository.uaeh.edu.mx/revistas/index.php/ICSA/article/view/5566 23. [ Links ]
24. Ramos P, Francisco R, Soledad PR, Lara L, Moreno C. Diferencias de género en la imagen corporal y su importancia en el control de peso. Escritos de Psicología [Internet]. 2016 [citado 05/09/2020]; 9(1): 42-50. Disponible en: Disponible en: https://scielo.isciii.es/scielo.php?script=sci_abstract&pid=S1989-38092016000100005 24. [ Links ]
25. Oliva Peña Y, Ordóñez Luna M, Santana Carvajal A, Marín Cárdenas A, Andueza PG, Gómez CI. Concordancia del IMC y la percepción de la imagen corporal en adolescentes de una localidad suburbana de Yucatán. Revista Biomédica [Internet]. 2016 [citado 05/04/2021]; 27(2): 49-60. Disponible en: Disponible en: http://www.scielo.org.mx/scielo.php?pid=S2007-84472016000200002&script=sci_arttex 25. [ Links ]
26. Vargas EM, Souki A, Ruiz G, García D, Mengual E, González CC, et al. Percentiles de circunferencia de cintura en niños y adolescentes del municipio Maracaibo del Estado Zulia, Venezuela. An Venez Nutr [Internet]. 2011 [citado 10/05/2021]; 24(1): 13-20. Disponible en: Disponible en: http://ve.scielo.org/scielo.php?script=sci_arttext&pid=S0798-07522011000100003 26. [ Links ]
27. Lauzurique Esquivel M, Quesada Rubén M, Fernández Gonzáles C, Chávez Rodríguez L, Pérez Tamayo V. Curvas de crecimiento de la circunferencia de la cintura en niños y adolescentes habaneros. Rev Cubana de Pediatría [Internet]. 2011 [citado 03/04/2021]; 83(1): 44-55. Disponible en: Disponible en: http://scielo.sld.cu/scielo.php?script=sci_arttext&pid=S0034-75312011000100005 27. [ Links ]
28. López Dávila MA. Estado Nutricio y Hábitos Alimentarios en adolescentes de 11 a 15 años de una escuela secundaria de San Luis Potosi [Tesis]. León, Guanajuato: Universidad Iberoamericana León; 2018 [citado 10/05/2021]. Disponible en: Disponible en: https://repositorio.leon.uia.mx/xmlui/bitstream/handle/20.500.12152/99895/178274.pdf?sequence=1 28. [ Links ]
29. Cazeres Ruiz DJ, Shuña Quispe JF. Relación entre hábitos alimenticios, estrés académico y circunferencia de cintura en estudiantes de la escuela de nutrición humana de una Universidad Privada de Lima este, 2020 [Tesis]. Lima, Perú: Universidad Peruana Unión; 2020 [citado 06/05/2021]. Disponible en: Disponible en: https://repositorio.upeu.edu.pe/bitstream/handle/20.500.12840/4078/Juan_Tesis_Licenciatura_2020.pdf?sequence=4&isAllowed=y 29. [ Links ]
30. Muñoz Villanueva P, Alarcón Arenada M, Jarpa Parra M, Morales Ojeda M. Hábitos y calidad del desayuno; su efecto en el rendimiento académico de estudiantes de técnico de nivel superior de enfermería. Rev Horiz Sanitario [Internet]. 2020 [citado 12/12/2020]; 19(3): 405-414. Disponible en: Disponible en: https://www.scielo.org.mx/scielo.php?pid=S2007-74592020000300405&script=sci_abstract 30. [ Links ]
31. Pérez Morales RA, Ribalta Rodríguez I, Nicot Massip J, Arce Sardinas EM, Sasó Balado R, Viera Morales L. Preferencias y conductas alimentarias en adolescente de secundaria básica. Rev Cubana de Pediaría [Internet]. 2021 [citado 25/05/2021]; 93(2): e968. Disponible en: Disponible en: http://scielo.sld.cu/scielo.php?script=sci_arttext&pid=S0034-75312021000200005 31. [ Links ]
32. Navarro Cruz AR, Vera Lopez O, Mungui Villeda P, Avila Sosa-Sanchez R, Lazacano Hernandez M, Ochoa Velasco C, et al. Habitos alimentarios en una poblacion de jovenes universitarios de la ciudad de puebla. Rev Española Nutr Comunitaria [Internet]. 2017 [citado 14/05/2021]; 23(supl.2): 31-37. Disponible en: Disponible en: https://pesquisa.bvsalud.org/portal/resource/pt/ibc-169154 32. [ Links ]
33. López Sobaler AM, Cuadrado Soto Es, Peral Suárez Á, Aránzazu A, Ortega RM. Importancia del desayuno en la mejora nutricional y sanitaria de la población. Nutr Hosp [Internet]. 2018 [citado 19/06/2021]; 35(Spe-6): 3-6. Disponible en: Disponible en: https://scielo.isciii.es/scielo.php?script=sci_arttext&pid=S0212-16112018001200002 33. [ Links ]
34. Menéndez Mato D, González González de Mesa C. Relaciones entre la práctica de actividad física y deportiva, el autoconcepto, la imagen corporal y los hábitos alimentarios en estudiantes de primaria. Rev de Ciencias del Deporte [Internet]. 2019 [citado 20/01/2020]; 15(1): 61-78. Disponible en: Disponible en: https://dialnet.unirioja.es/servlet/articulo?codigo=6868583 34. [ Links ]
35. Acosta Favela JA, Medrano Donlucas G, Duarte Ochoa G, González Santana SR. Malos Hábitos Alimentarios y Falta de Actividad Física Principales Factores Desencadenantes de Sobrepeso y Obesidad en los Niños Escolares. CULCyT: Cultura Científica y Tecnológica [Internet]. 2014 Sept-Dic [citado 14/05/2021]; 11(Extra 54). Disponible en: Disponible en: https://dialnet.unirioja.es/servlet/articulo?codigo=7296281 35. [ Links ]
36. Alfaro Gonzáles M, Vásquez Fernández M, Fierro Urturi A, Rodríguez Molinero L, Muñoz Moreno M, Herrero Bregón B. Hábitos de alimentación y ejercicio físico en los adolescentes. Rev Pediatría de Atención Primaria [Internet]. 2016 [citado 12/05/2021]; 18(71): 221-9. Disponible en: Disponible en: https://scielo.isciii.es/scielo.php?pid=S1139-76322016000300003&script=sci_arttext&tlng=pt 36. [ Links ]
37. Rodríguez Leyton M. Desafíos para el consumo de frutas y verduras. Rev Fac Med Hum [Internet]. 2019 Abr [citado 19/06/2021]; 19(2): 105-12. Disponible en: Disponible en: http://www.scielo.org.pe/scielo.php?pid=S2308-05312019000200012&script=sci_arttext 37. [ Links ]
38. Infantes Urtecho LC. Hábitos Alimentarios y Valoración Antropométrica en estudiantes de la Institución Educativa Nº 80821 “Cesar Vallejo Mendoza” La Esperanza - Trujillo, Julio-Noviembre 2016 [Tesis]. Trujillo, Venezuela: Facultad de Ciencias Médicas, Escuela de Nutrición; 2017 [ citado 12/06/2021]. Disponible en: Disponible en: https://core.ac.uk/download/pdf/225610051.pdf 38. [ Links ]
Received: September 20, 2022; Accepted: January 23, 2023

