


 Serviços customizados
 Inglês (pdf)
 Artigo em XML
 Referências do artigo
 Enviar este artigo por email
 Citado por SciELO
  Similares em
SciELO
Similares em
SciELO 
 Permalink
Introduction
Learning Management Systems (LMS) are the main computerized educational systems today. In particular, Moodle is one of the most widely used LMS today, which was adopted by the Cuban Ministry of Higher Education to deploy and use in the universities of the system. Like other LMS tools, Moodle collects a large amount of data including all the ratings and interactions of the participants allowing the application of a complete set of Learning analytics (LA) techniques (Greller & Drachsler, 2012; Wong et al., 2022).
The relevance of LA is palpable given its increase in scientific publications and international projects. It is impossible to ignore these techniques as something fundamental embedded in the learning process and in higher education, to manage actions to improve learning (Greller & Drachsler, 2012). The large volume of data (records) of each participant, from the interaction of hundreds of students, with more than a dozen qualifying activities, show the need to apply specialized tools in LA (Timbi-Sisalima et al., 2022).
Moodle does not include visual learning analysis functionalities in its modules that it installs by default. There are functional plugin-based extensions to Moodle, which support visual exploration of student activity and performance (Liu et al. 2019). But the decision to make a new extension available to teachers depends on multiple factors of the academic institution: size, organization chart, economy, etc. That are beyond the scope of the teacher's decision (Ji et al., 2020). However, the development and adoption of accessible and user-friendly LA tools like the Moodle Logs Analytics web application is essential to support personalized learning and improve student success (Wong et al., 2022).
There are several plugins (Luna et al., 2017) and external tools (Sáiz-Manzanares et al., 2021) to analyze and monitor the participants of a course in Moodle, including advanced Machine Learning analyzes to predict the performance of students, classify them according to different variables extracted from their interaction and completion of activities among other analyzes (Ahmed & Khan, 2019). However, few of these applications analyze the reports provided by Moodle, that is, they work by connecting directly to the server and extracting the information online.
The goal of the Moodle Logs Analytics web application is to provide a simple and basic solution for analyzing Moodle course logs and providing useful interactive graphs to describe student activity. This web application has been tested and validated by teachers and managers in the national network of Cuban and Ecuadorian universities, with great acceptance.
Recent studies have highlighted the importance of LA in supporting personalized learning and improving student outcomes (Greller & Drachsler, 2012; Timbi-Sisalima et al, 2022). These findings emphasize the need for accessible and user-friendly LA tools that can be used by educators and administrators to support student success. Several studies have explored the use of various LA tools and techniques in the context of Moodle (Fenu et al., 2017; Verdú et al. 2021), but these tools often require technical expertise and can be difficult to implement and use effectively.
The Moodle Logs Analytics web application offers a user-friendly and accessible solution for analyzing Moodle course logs and supporting student success. By providing interactive graphs and visualizations of student activity, this application empowers teachers and administrators to identify areas for improvement and take targeted actions to enhance student learning outcomes. Furthermore, the application is designed to be simple and easy to use, making it accessible to educators who may not have extensive technical expertise.
The goal of the Moodle Logs Analytics web application is to provide a simple and basic solution for analyzing Moodle course logs and providing useful interactive graphs to describe student activity.
App description
Moodle Logs Analytics is a web application for teachers or managers, developed in python and using the Django framework, which analyzes the records of one or more Moodle courses. Faced with more common solutions, such as Moodle plugins or blocks, a web application lacks the bureaucratic, technical and economic problems of installing and updating versions on an institutional server decision (Ji et al, 2020). This application follows an open source and free use policy, under the MIT license, with the latest version available in the GitHub repository (https://github.com/ravellom/moodle_csv_prof).
The deployment of the app using Docker was a major advantage for users seeking to monitor and analyze student activity in Moodle courses. Docker streamlined the installation process, making it simple and efficient to deploy the application and its dependencies on different machines. This allowed users to avoid the bureaucratic, technical, and economic challenges often associated with installing and updating applications on institutional servers. By using Docker, users could ensure that the application ran in a consistent environment across different machines, reducing the likelihood of compatibility issues and errors. Additionally, Docker provided a convenient way to package and distribute the application, enabling others to use and contribute to the project with ease. Overall, the use of Docker made the installation and deployment of the app a seamless and straightforward process.
Basic functionality
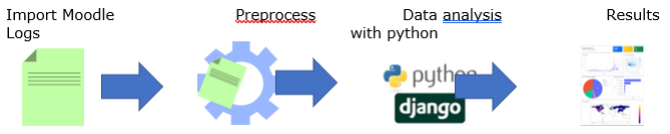
Before using the Moodle Logs Analytics application, the data process shown in Figure 1 involves several steps. First, Moodle logs must be imported into the system, containing information about student activity in the Moodle course. These logs may be generated by the Moodle system itself or by a third-party plugin. Once the logs have been imported, they must be preprocessed to remove any irrelevant or redundant data and to format the remaining data in a way that can be used by the analytics algorithms.
After the data has been preprocessed, it can be analyzed using Python and various data analysis techniques, such as machine learning, statistical analysis, and data visualization. These techniques can provide insights into student activity, performance, engagement, and other important metrics. Finally, the results of the data analysis can be visualized and presented to the user, allowing them to make informed decisions about how to improve their Moodle course. Overall, the data process shown in Figure 1 involves several important steps to prepare and analyze the Moodle logs before using the Moodle Logs Analytics application.
In order to use the application, it is necessary to enter the course in analysis and download the records as explained in the help section of the application. Then in the "Load data" section you can upload the file and exclude participants who do not want to be part of the analysis, as well as set the date range to analyse. Figure 2
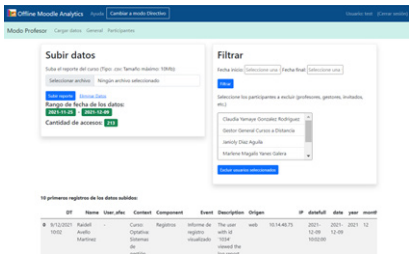 Source: Own elaborationNote: The students' data has been anonymized following the ethical standards of the journal.
Fig. 2 - Load data and filters
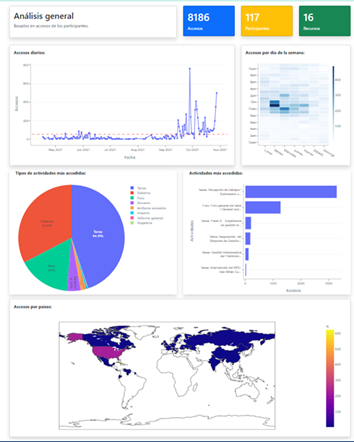
The general analysis section of Moodle Logs Analytics (figure 3) provides a comprehensive overview of student activity in the Moodle course. The section includes a description of the access patterns for the days analyzed, which can help teachers and managers identify trends and patterns in student behavior. A heatmap is also provided, which displays access by day of the week and time, using color intensity to indicate more or less number of accesses. This visualization can help users understand when students are most active and engaged, and identify opportunities to increase engagement during low-activity periods.
Additionally, the section includes two graphs, one displaying the amount of access by type of activity and another by specific activities. These visualizations can help users identify which types of activities are most popular among students, and which specific activities are receiving the most engagement. This information can be used to optimize the course content and design, to improve student engagement and performance.
Finally, a world map is provided, with a color scale according to the amount of access by country. This visualization can help users understand the geographic distribution of student activity, identify areas of high or low engagement, and adapt course content and design to better meet the needs of students in different regions. Overall, the general analysis section of Moodle Logs Analytics provides a wealth of information that can be used to optimize course design, improve student engagement and performance, and make informed decisions about how to best support students in the Moodle course.
The participants section of Moodle Logs Analytics offers a wealth of information to teachers and managers seeking to analyze student engagement and performance. Figure 4 includes two graphs and one table, providing a detailed analysis of participant activity. The first graph displays an analysis of the number of participants for the main activities of the course, allowing users to identify which activities are attracting the most interest and engagement. This information can be used to optimize course content and design, ensuring that students are receiving the most value from the course.
The second graph displays a cluster analysis that classifies students into two groups based on the variables presented in the table below the graphics. This table includes five variables (number of access, uploaded assignments, forum messages, completed questionnaires, and glossary contributions), which describe the contributions of participants in the main knowledge-building activities that Moodle provides. These variables can be used to identify patterns in student engagement and performance, and the cluster analysis can help teachers and managers tailor their approach to better meet the needs of each group.
Overall, the participants section of Moodle Logs Analytics is a powerful tool for analyzing student activity and engagement. By analyzing the data provided in this section, users can identify which activities are most popular among students, which students are most engaged and active, and which groups may require additional support or attention. This information can be used to improve course content and design, optimize student engagement and performance, and make informed decisions about how to best support students in the Moodle course.
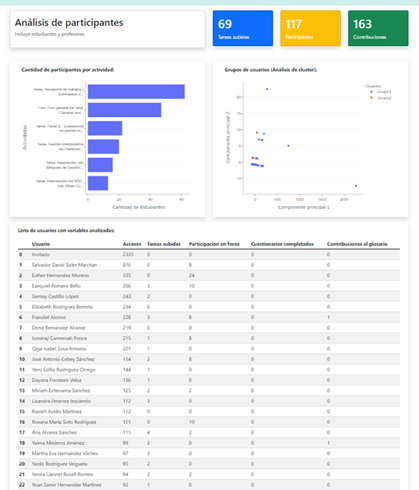 Source: Own elaborationNote: The students' data has been anonymized following the ethical standards of the journal.
Fig. 4 - Participants análisis
Evaluation
During the evaluation of Moodle Logs Analytics, a basic methodology was employed to gather feedback from teachers on the tool's effectiveness. Five teachers, three from the Computer Science area and two from Social Sciences, were selected to test the tool with their own courses. After using the tool, the teachers were interviewed to gather their feedback on the tool, including any errors they encountered, and suggestions for improvements.
In addition, the tool was used to analyze the pre-congress courses of the 3rd Scientific Conference of the University of Cienfuegos with 17 courses, using real data. The results obtained from the analysis were highly accepted and useful for teachers and conference coordinators. The Moodle Logs Analytics tool proved to be a valuable resource for analyzing student activity and engagement in both the University of Cienfuegos and Bolivarian University of Ecuador.
Overall, the evaluation of Moodle Logs Analytics using a combination of interviews and real data analysis demonstrated the tool's potential for providing valuable insights into student activity and engagement in Moodle courses. By gathering feedback from teachers, the evaluation was able to identify areas for improvement and ensure that the tool was effective across different disciplines and institutions.
Conclusions
In conclusion, this paper presents Moodle Logs Analytics as a powerful tool for analyzing student activity and engagement in Moodle courses. The web application offers a basic and simple solution to access and analyze Moodle course records, providing interactive graphics that effectively describe student activity. The application has been well received by managers and teachers who tested the first version available in the national network of Cuban Universities (moodlestats.ucf.edu.cu), demonstrating its potential to improve educational outcomes in the Cuban higher education system.
Furthermore, during the evaluation of the Moodle Logs Analytics tool, it was also tested in the institutional Moodle server for undergraduate students at the Bolivarian University of Ecuador, with great success. The tool was used to analyze the activity of students in Moodle courses and was highly accepted by teachers and coordinators. The positive feedback from this evaluation highlights the tool's usefulness and potential for improving course design and student performance across different institutions and disciplines.
Overall, the Moodle Logs Analytics tool has the potential to revolutionize the way educators analyze and improve student engagement and performance in Moodle courses. The tool's simplicity and effectiveness make it accessible to a wide range of users, while its interactive graphics provide valuable insights into student activity and engagement. The success of the tool in both Cuban and Ecuadorian universities underscores its potential to improve educational outcomes and make a significant impact on the field of education.

