


Meu SciELO
 Serviços customizados
Serviços Personalizados
Artigo
 texto em
  Inglês (pdf)
 Artigo em XML
 Referências do artigo
 Enviar este artigo por email
Indicadores
-
 Citado por SciELO
Links relacionados
-
 Similares em
SciELO
Similares em
SciELO
Compartilhar

 Permalink
Revista Cubana de Ciencias Forestales
versão On-line ISSN 2310-3469
Rev CFORES vol.12 no.1 Pinar del Río jan.-abr. 2024 Epub 01-Abr-2024
Original article
Fire behavior in controlled burning on forest area in Sancán, Manabí, Ecuador
1Universidad Estatal del Sur de Manabí. Manabí, Ecuador.
2Consultor independiente. Ecuador.
Controlled burning is commonly used by farmers on forestry lands to clear the land prior to establishing agricultural crops. The objective of this experimental work was to evaluate the behavior of fire in controlled burning on forestry lands in the Sancán commune, province of Manabí, Ecuador. 10 plots of 1.18 x 5 m were delimited in fuel rows and three plots of 20 x 50 m in dispersed fuels. During the burning, the variables air temperature, relative humidity and wind speed were measured at 0.50 meters above the ground and more than 3.00 m away from the end of the plot where the fire started. The fuel material was characterized considering weight, thickness and moisture content before burning. The fire behavior parameters evaluated were propagation speed, linear fire intensity, flame heights, lethal drying height and heat released per unit area. Fire behavior showed higher mean values for all parameters in the plots located in the fuel rows, except for the case of propagation speed. Besides, in these plots, the standard deviation values obtained for each variable indicate greater dispersion of the data with respect to the mean, which implies less homogeneous fire behavior in a general sense. The results obtained can be used to support the responsible use of fire in forestry lands.
Key words: forest fires; fire management; prevention; responsible use of fire.
INTRODUCTION
Fire behavior can be defined as the way in which variables such as propagation speed, intensity, heat released per unit area, residence time and length of flames are manifested during the development of combustion in response to the characteristics of fuel, topography and weather conditions.
Prescribed burning has been and continues to be an important land and fire management tool to meet objectives related to, for example, wildfire mitigation, forestry, certain agricultural practices, water and soil management, reduction of greenhouse gas emissions, ecologically sustainable processes and biodiversity conservation (Morgan et al., 2020). Controlled burning, for its part, constitutes management practices used in different types of vegetation and widespread in several countries (Seger et al., 2013). Burning is part of the management of introduced grasses in Chiapas, Mexico, and this can lead to forest fires (Rodríguez-Trejo et al., 2020). In the province of Manabí, as in other regions of Ecuador, fire is widely used by agricultural producers (Ramos-Rodríguez et al., 2021), its main uses being the burning of agricultural crop residues and land clearing, and then to sow or plant agricultural crops (Ramos-Rodríguez et al., 2021; Ramos-Rodríguez et al., 2022; Manrique-Toala et al., 2022).
Although fire is an important cultural and land management tool, Randerson et al. (2012) state that fires have a significant impact on the production of carbon dioxide and other greenhouse gases (CH4 and N2O) that contribute to climate change. According to Santín and Doerr (2016), fire can affect the physical, chemical and biological characteristics of soils both during and after burning. They can also (Nghalipo et al., 2018) affect ecosystem productivity directly through nutrient volatilization, increased mineralization and alteration of the amount of organic matter, and indirectly through alteration of the structure of the vegetation. At the same time, research developed by Panico et al. (2020), suggest that soils covered by herbaceous species are more sensitive to the effects of fire and less capable of restoring their functionality compared to soils covered by trees.
Taking into account what was described above, the objective of this work was to evaluate the behavior of fire in controlled burning on forestry lands in the Sancán commune, province of Manabí, Ecuador, testing the hypothesis that the parameters of fire behavior reach higher values when the fuel is burned stacked in rows than when it is burned dispersed in the area, that is, without stacking. The results obtained can be used to support the responsible use of fire in forestry lands.
MATERIALS AND METHODS
Characterization of the study area
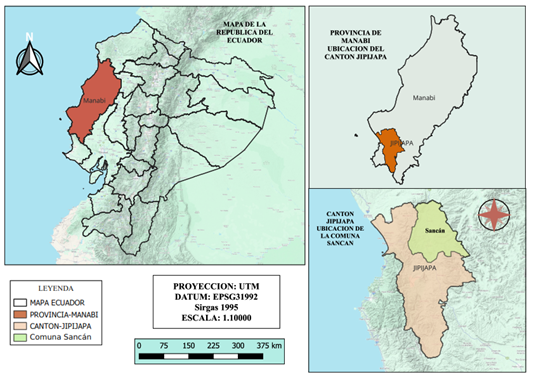
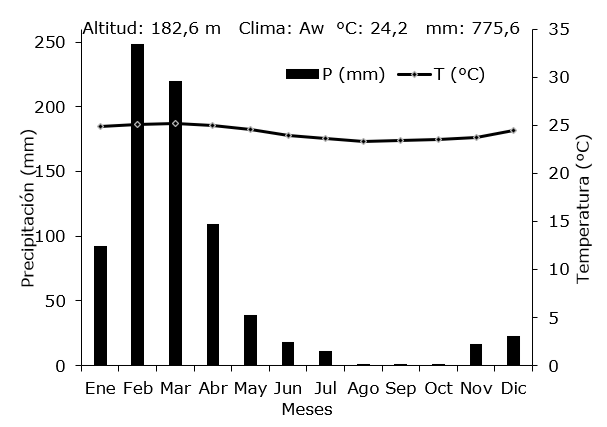
The research was carried out on forestry lands in the Sancán commune, Jipijapa canton, used for the cultivation of Zea mays L. whose residues along with herbaceous vegetation are burned every year as a soil cleaning practice before the next planting. According to the Municipal Decentralized Autonomous Government of Jipijapa (GAD, 2015), this canton is made up of three urban and seven rural parishes, located in the extreme south of the province of Manabí between the coordinates 01°10' to 01°47' of South and 80°25' to 80°52' West, 403 km from the city of Quito, capital of Ecuador. Jipijapa borders to the north with the cantons Montecristi, Portoviejo and Santa Ana, to the south with the province of Santa Elena and the canton Puerto López, to the east with the cantons Paján and 24 de Mayo and to the west with the Pacific Ocean (Figure 1). Information on type of climate and some meteorological variables considering the period from 1981 to 2022 can be seen in Figure 2 based on data obtained from NASA Prediction of Worldwide Energy Resources(NASA 2023).
Delimitation of the experimental area and data collection
Because farmers burn Zea mays L. residues after harvesting and the herbaceous vegetation that accompanies them, sometimes piling them in rows, furrows or rolls and other times leaving them dispersed over the entire area to be burned, 10 plots of 5 m were delimited and an average width of 1.18 m, located one after the other on rows of fuels and 3 plots of 20 x 50 m in an area where the fuels were dispersed throughout the area, that is, they were not stacked in rows. A 1 m wide fire break was built around these three plots to prevent the fire from passing to the external area of the experiment.
Characterization of meteorological and fuel variables
The characterization of the meteorological variables was obtained from measurements of air temperature, relative humidity and wind speed during the development of the experiment. An ambient weather WM-4 digital meteorological meter was used and measurements were made at the beginning of the burning, when the fire was in the middle of the plot, and again once the fire had reached the end of the plot. These measurements were made at a height of 0.50 m from the ground and more than 3.00 m away from the end of the plot where the fire started, thus preventing the measurements from being affected by the fire environment.
To characterize the fuel material, information was obtained on the weight or load and thickness of the fuel layer deposited on the ground. The determination of the weight, amount of fuel material or dry matter before burning was based on the destructive method used by Cruz et al. (2020). Accordingly, in the center of each 5 x 1.18 m plot, a sample of 2,380 cm2 was collected, delimited by a 50 x 50 cm wooden square, from within which all the material was removed. In the case of the 20 x 50 m plots, the sample was 1 m2. The material was divided into: a) miscellaneous, understood as dead non-woody materials such as leaves, humus and herbaceous plants and b) the stems or pancas of Zea mays plants and herbaceous plants with diameters greater than 0.7 cm. The collected material, once weighed with a hook scale of 0.01 g precision, was mixed and a sample of 500 g was taken from each type of plot, which was placed in hermetically sealed nylon bags to be transferred to the Bromatology Laboratory of the State University of the South of Manabí, where 5 samples of 50 g each per type of plot were placed in an oven at 75ºC for 48 hours, following what was applied by Seger et al. (2013).
The thickness of the fuel layer deposited on the ground was determined through three measurements made at the ends and in the center of each 5 x 1.18 m plot and 10 measurements made 5 m apart from each other in the center of the plots. plots of 20 x 50 m.
The humidity of the fuels on the day of burning was determined from 5 samples taken in each type of plot. Equation 1 (Èekovská et al. 2017) was used.
Where: w = Moisture content of the sample (%); m w = Wet weight of the sample (kg); m o = Weight of the sample after drying in the oven (kg).
Evaluation of fire behavior parameters
The evaluation of the behavior of the fire during the experiment was based on the measurement of the parameters flame height, propagation speed, linear fire intensity, lethal drying height and heat released per unit area. The height of the flames was measured in each plot with a graduated beacon at 2 and 4 m from the end where the burning began, that is, two measurements in each plot of 5 x 1.18 m and 10 measurements in the plots of 20 x 50 m, that is, every 5 m. The speed of fire spread was calculated by measuring the time used by the fire to travel through each plot (ms-1 ) considering this when 50% of the fire line reached the end of the plot.
The linear intensity of the fire (Byram 1959), the height of lethal drying (Van Wagner 1973) and the heat released per unit area were estimated as cited in Soares et al. (2017) through Equations 2, 3 and 4, respectively.
Where: I = linear fire intensity in kcalm-1s -1 ; H = heat of combustion in kcalkg -1 (±4000 kcalkg -1 ); w = weight of available fuel in kgm-2 ; r = fire propagation speed in ms-1 ; hs = lethal drying height in m; V = wind speed in ms-1 ; T = air temperature in o C; Ha = heat released per unit area in kcalm-2 . The constant 60 is expressed in oC and represents approximately the lethal temperature of tree foliage.
The heat of combustion of the wet material was calculated through Equation 5 (Soares et al., 2017). A dry heat of combustion of 4 000 kcalkg -1 (16 720 kJkg-1 ) was considered, which was used by Ramos Rodríguez et al. (2019). Batista et al. (2013) used an average value of H = 15 490 kJkg-1 in experimental burning in Pinus elliottii. Londe de Camargos et al. (2015), determined dry calorific value values between 4,093 and 4,623 kcalkg-1 (17,136.63 and 19,355.65 kJkg-1) in a semi-deciduous seasonal forest Equation 5.
Where: Hw = Heat of combustion of the wet material; Hd = Heat of combustion of dry material; U = moisture content of the fuel material in %.
In the experiment, variables on fire behavior, meteorological conditions and fuel material were used (Table 1).
Table 1. - Variables used in the experiment
| Variables | Description | Unit |
| Hll | Height of the calls | cm |
| Vpf | Speed of spread of the fire | ms-1 |
| Yo | Intensity linear of the fire | kcalm-1 s -1 |
| hs | Height of drying lethal | M |
| Ha | Heat released per unit of area | kcalm -2 |
| T | Temperature of air | oC |
| HR | Humidity relative | % |
| vv | Speed of the wind | ms-1 |
| PcA | Weight of the material fuel dry before of the burning | kgm-2 |
| EspA | Thickness of the layer made out of fuel before of the burning | cm |
Statistical processing
Data processing was carried out with SPSS Statistics for Windows (Version 22.0) (IBM Corp. 2013) to the significance level of 0.05 (P = 0.05). The normality of the data was verified with the Shapiro-Wilks statistical test. In all cases, when the data fit the normal distribution, the difference between the means was tested with the Student t-test and when the opposite occurred, the nonparametric Mann-Whitney U test was used.
To determine the relationship between the analyzed variables, the average values corresponding to each burning plot were used. According to the Shapiro-Wilks normality test, it was obtained in the case of the plots located in the fuel rows that the relative humidity variable did not adjust to the normal distribution (P < 0.05) while in the case of In the plots located in the dispersed fuel area, all variables followed the normal distribution. In response to this behavior, Spearman's non-parametric correlation coefficient was determined for the first group of variables and for the second group, that is, those corresponding to the plots located in dispersed fuels, the Pearson correlation coefficient, considering both cases a 5% probability of significance as a measure of the relationship. The interpretation of the Spearman and Pearson correlation values was made according to Tables 2 and 3 (Bisquerra Alzina 2009).
Table 2. - Interpretation of Spearman correlation values
| r value | Interpretation |
| 0.00 - 0.20 | Nearly zero |
| 0.21 - 0.40 | Low |
| 0.41 - 0.70 | Moderate |
| 0.71 - 0.90 | High |
| 0.91 - 1.00 | Very high |
Table 3. - Interpretation of the magnitude of the Pearson correlation coefficient according to Cohen's suggestion
| r value | Interpretation |
| 0.00 - 0.10 | Null |
| 0.10 - 0.30 | Weak |
| 0.30 - 0.50 | Moderate |
| 0.50 - 1.00 | Strong |
Considering the values obtained for both the significance and the correlation coefficient for the relationship of the thickness of the combustible material before burning with the linear intensity and with the height of lethal drying, the corresponding regression analyzes were carried out with Microsoft Excel.
RESULTS AND DISCUSSION
Meteorological and fuel variables on the day of burning
The mean values of the variables relative humidity and wind speed were statistically similar on the days in which the plots located in the fuel rows and those located in areas of dispersed fuels were burned, while in the case of air temperature the mean was numerically higher on the day of burning of the plots located in dispersed fuels. The Mann-Whitney U test confirmed the non-existence of a significant difference in the case of relative humidity (Z = -1.859; P = 0.077) and the Student t test for wind speed (t = -0.583; P = 0.572). In the case of air temperature, the difference was verified with Student's t test (t = -3.049; P = 0.011). At the same time, the values obtained for the standard deviation show greater dispersion of the data with respect to the mean in the case of the first type of plot, which is an indicator of less stable meteorological conditions that day (Table 4).
Air temperature directly and indirectly affects the probabilities of occurrence and mainly, the potential for spread of forest fires. Atmospheric humidity is a key element in determining a potential fire. It has direct effects on the flammability of fuels, and through inter-relationships with other weather factors, it presents indirect effects on some aspects of fire behavior (Soares et al., 2017).
Seger et al. (2013), developed controlled burning in Grass-Woody Steppe vegetation in the state of Paraná, Brazil, with air temperatures between 14.04 and 26.20oC, relative humidities between 56.00 and 66.00 % and speeds of the wind between 2.08 and 4.30 ms-1, that is, lower temperature, similar relative humidity and higher wind speed than the average values reported in this research. Ramos Rodríguez et al. (2019) carried out experimental burning in a Tectona grandis plantation, recording average values for air temperature, relative humidity and wind speed of 29.94oC, 65.70 % and 0.72 ms-1, respectively. The temperature was similar to that recorded in this research, the average value of relative humidity was higher and the wind speed was similar to that recorded in the plots located in the fuel rows and lower than that described for the plots located in dispersed fuels. Rodríguez-Trejo et al. (2020), reported during grassland burning in Chiapas, Mexico, when burning downwind average values of 2.13 ms-1 for wind speed; of 24.3°C for temperature and 64.7 % for relative humidity, while during upwind burning the average values for wind speed, air temperature and relative humidity were 0.77 ms-1 ; 23.1°C and 66.8 %, respectively. In both types of burning, the average values of air temperature were lower than those reported in this research, while in the case of relative humidity, the values obtained in this work were lower, with the wind speed being higher when burning favor by the wind, similar to burning against the wind with plots located in rows and less than those located in dispersed fuels (Tabla 4).
Table 4. - Meteorological variables on the day of burning in each experimental plot
| Fuel Row Plots | Parcelas en el área de combustibles dispersos | ||||||
| No. | T |
Hr (%) | Vv (ms-1) | No. | T (oC) | Hr (%) | Vv (m.s-1) |
| 1 | 30,70 | 50,27 | 0,01 | 1 | 32,23 | 47,60 | 0,93 |
| 2 | 31,67 | 49,07 | 0,03 | 2 | 31,63 | 51,03 | 0,80 |
| 3 | 28,70 | 55,27 | 0,30 | 3 | 30,73 | 51,50 | 1,10 |
| 4 | 28,67 | 56,60 | 0,60 | - | - | - | |
| 5 | 30,27 | 56,27 | 0,83 | - | - | - | -- |
| 6 | 29,10 | 56,50 | 1,10 | - | - | - | |
| 7 | 28,33 | 56,57 | 0,97 | - | - | - | -- |
| 8 | 29,30 | 55,00 | 0,77 | - | - | - | - |
| 9 | 28,77 | 57,53 | 1,73 | - | - | - | - |
| 10 | 28,30 | 57,83 | 1,20 | - | - | - | - |
| Media | 29,38a | 55,09a | 0,75a | Media | 31,53b | 50,04a | 0,94a |
| ± ds | 1,13 | 2,99 | 0,54 | ± ds | 0,75 | 2,12 | 0,15 |
Note: ab means of each variable with the same letter are statistically equal (P< 0.05). T: Air temperature; Hr: Relative humidity; Vv: Wind speed; ±ds: Standard deviation
On the day of burning, the humidity of the fuels in the plots located in the rows and dispersed was 12.08 and 10.47%, respectively. Higher mean values were obtained for the variables weight of dry fuel material and thickness of the fuel layer before burning in the plots located in the rows. The Student's t test demonstrated the existence of a statistical difference for the case of weight (t = 2.434; P = 0.033) and for the thickness of the fuel layer (t = 4.106; P = 0.002). Furthermore, according to the values obtained for the standard deviation, the dispersion of the data with respect to the mean was greater in the case of weight in the plots located in rows, which indicates a less homogeneous distribution, with this indicator behaving in a similar way for the case of the thickness of the fuel layer in both types of plots (Tables 5).
In controlled burning in grass-woody steppe vegetation in the state of Paraná, Brazil, Seger et al . (2013), found average values of material humidity of approximately 50 %, with variations between 37.99 and 60.84 %, being higher than those recorded in this research, similar to what was reported for the case of the average of the total combustible material observed in the plots which was 2.26 kgm-2. Ramos Rodríguez et al. (2019), reported in experimental burning in a Tectona grandis plantation an average value for the weight of the fuel material of 0.58 kgm-2, lower than those obtained in this research, while the average thickness was 14. 23 cm, which is similar to that obtained in this research for the case of the plots located in dispersed fuels and lower than that obtained in the plots located in rows. In grasslands of Chiapas, Mexico, Rodríguez-Trejo et al. (2020), reported an initial fuel load of 0.62 kgm-2 , a lower value than that obtained in this research (Table 5).
Table 5. - Fuel characteristics before burning in the experimental plots
| Fuel Row Plots | Parcels in the dispersed fuel area | ||||
| No. | PcA (kgm-2) | EspA (m) | No |
PcA (kgm-2) | EspA (m) |
| 1 | 1,03 | 0,29 | 1 | 0,78 | 0,21 |
| 2 | 1,34 | 0,30 | 2 | 0,90 | 0,09 |
| 3 | 1,49 | 0,30 | 3 | 1,03 | 0,12 |
| 4 | 1,95 | 0,37 | - | - | - |
| 5 | 2,13 | 0,33 | - | - | - |
| 6 | 1,22 | 0,22 | - | - | - |
| 7 | 1,16 | 0,20 | - | - | - |
| 8 | 1,43 | 0,24 | - | - | - |
| 9 | 1,67 | 0,31 | - | - | - |
| 10 | 1,06 | 0,29 | - | - | |
| Media | 1,45a | 0,29a | Media | 0,90b | 0,14b |
| ± ds | 0,37 | 0,05 | ± ds | 0,12 | 0,06 |
Note: a-b means of each variable with the same letter are statistically equal (P< 0.05). PcA: Weight of dry fuel material before burning; EspA: Thickness of the fuel layer before burning; ds: Standard deviation
Fire behavior parameters
The evaluation of the fire behavior parameters in the different types of plots (Table 6) showed higher average values in all cases in the plots located in the fuel rows, except for the case of propagation speed. The Student t test confirms the above in the case of flame height (t = 1.697; P = 0.118), fire propagation speed (t = 2.147; P = 0.055), linear intensity (t = 5.089; P = 0.001), lethal drying height (t = 4.927; P = 0.001) and heat released per unit area (t = 2.364; P = 0.038). Also in these plots, the standard deviation values obtained for each variable indicate greater dispersion of the data with respect to the mean, which implies less homogeneous fire behavior in a general sense.
Seger et al. (2013) in controlled burning in grass-woody steppe vegetation in the state of Paraná, Brazil. found average flame heights of 0.84 m when burning against the wind and 1.34 m when burning downwind, values that do not coincide with those obtained in this research. However, the speed of fire spread, when these authors burned against the wind (0.012 ms-1), was similar to that obtained in this investigation for the plots located in the fuel rows. With respect to the linear intensity, the aforementioned authors obtained an average value of 50.68 kcalm -1s-1 when they burned against the wind, a value slightly lower than that obtained in this work in the plots located in rows and very different from the obtained for plots located in dispersed fuels. When they burned downwind, they obtained an average value of 210.53 kcalm-1s-1, much higher than that obtained in this research. In the case of heat released per unit area, different values were also obtained from those reported by the authors mentioned above. Ramos Rodríguez et al. (2019), reported in experimental burning in a Tectona grandis plantation an average value of 0.57 m for the height of the flames, which is lower than those reported in this research, while the propagation speed was lower than the obtained in this work for the case of plots located in fuel rows and higher than that recorded for plots located in dispersed fuels. For their part, the average values described for both the linear intensity and the height of lethal drying, as well as for the heat released per unit area, were lower than those obtained in this investigation. Rodríguez-Trejo et al. (2020) reported average values of 3.92 and 1.07 m for burning upwind and against the wind in Chiapas grasslands, respectively, the former being much higher than that obtained in this research for the two types of plots, while that the second is similar to that reported in the plots located in the fuel rows. According to these authors, the propagation speed was 0.3716 and 0.0111 ms-1 when they burned with and against the wind, respectively, which indicates similarity between burning against the wind and the value obtained in this research for the fuel row plots.
Tabla 6. - Values of fire behavior parameters in each burning plot
| Plots | Hll (m) | Vpf (ms-1) | I | hs (m) | Ha (kcalm-2) | |
| (kcalm-1s-1) | (kwm-1) | |||||
| Fuel Row Plots | ||||||
| 1 | 1,04 | 0,0139 | 50,21 | 210,05 | 5,59 | 3612,51 |
| 2 | 1,22 | 0,0167 | 78,49 | 328,31 | 7,79 | 4699,77 |
| 3 | 0,90 | 0,0119 | 62,19 | 260,14 | 6,04 | 5225,86 |
| 4 | 1,67 | 0,0104 | 71,13 | 297,53 | 6,60 | 6839,22 |
| 5 | 0,70 | 0,0093 | 69,48 | 290,62 | 6,85 | 7470,53 |
| 6 | 0,62 | 0,0076 | 32,52 | 136,03 | 3,97 | 4278,89 |
| 7 | 1,01 | 0,0093 | 37,84 | 158,27 | 4,29 | 4068,46 |
| 8 | 0,82 | 0,0083 | 41,63 | 174,13 | 4,71 | 5015,43 |
| 9 | 0,97 | 0,0167 | 97,81 | 409,17 | 8,19 | 5857,18 |
| 10 | 0,92 | 0,0104 | 38,66 | 161,74 | 4,34 | 3717,73 |
| Media | 0 |
0,0114a | 58,00a | 242,60a | 5,84a | 5078,56a |
| ± ds | 0,30 | 0,0033 | 21,30 | 89,12 | 1,51 | 1302,04 |
| Parcels in the dispersed fuel area | ||||||
| 1 | 0,93 | 0,0083 | 23,09 | 96,59 | 3,52 | 2782,05 |
| 2 | 0,58 | 0,0064 | 20,54 | 85,94 | 3,18 | 3210,06 |
| 3 | 0,50 | 0,0069 | 25,35 | 106,04 | 3,55 | 3673,74 |
| Media | 0,67a | 0,0072b | 22,99b | 96,19b | 3,41b | 3221,95b |
| ± ds | 0,23 | 0,0010 | 2,40 | 10,05 | 0,20 | 445,96 |
>Note: a-b means in columns with the same letter are statistically equal (P< 0.05). Hll: Height of the flames; Vpf: Fire propagation speed; I: Linear fire intensity; hs: Lethal drying height; Ha: Heat released per unit area; ±ds: Standard deviation
Correlation analysis
The correlation analysis between meteorological variables (Tables 7 and (Table 8) showed for the plots located in the fuel rows highly significant linear relationships between air temperature and relative humidity (r = -0.830; P = 0.003) and between speed wind and relative humidity (r = 0.818; P = 0.004), with this type of relationship not existing between these variables in the case of plots located in dispersed fuels. In neither of the two types of plots was a relationship between wind speed and fire behavior variables obtained, which according to Ramos Rodríguez et al. (2019), can be explained by its erratic behavior characterized by continuous changes in direction and speed during the burning of the plots. This is one of the difficulties normally encountered when burning experiments are carried out in an open environment.
In the case of the fuel variables, the relationship was significant between weight and thickness (r = 0.756; P = 0.011) in the plots located in the fuel rows, with no relationship between these variables in the case of the plots located in dispersed fuels.
With respect to the variables of fire behavior in plots located in fuel rows, the relationship was significant for the speed of spread with flame height (r = 0.648; P = 0.043), linear intensity (r = 0.746; P = 0.013) and the lethal drying height (r = 0.722; P = 0.018), as well as between this last variable and the heat released per unit area ( r = 0.636; P = 0.048), the relationship between the intensity being linear and the highly significant lethal drying height (r = 0.988; P = 9.3075x10⁻⁸). In the plots located in dispersed fuels, although some high correlation values were observed between these variables, their relationships were not significant. Similar results were obtained by Batista et al. (2013) in a study carried out on the estimation of fire behavior in experimental burning under Pinus elliottii plantations, obtained the highest correlations in the case of the fire behavior variables flame height and fire propagation speed, as well as intensity linear with propagation speed and height of the flames. For their part, Ramos Rodríguez et al. (2019), in experimental burning in a Tectona grandis plantation, they obtained a significant association for the height of the flames with the linear intensity, which is different from what was obtained in this research. However, there is a coincidence in the case of the relationship obtained by these authors between flame height and fire propagation speed, that is, between fire behavior variables and not between these and meteorological and fuel variables.
On the other hand, it was obtained that in the plots located in the fuel rows there was no relationship between meteorological variables with those of the behavior of the fire or with those of the fuels. Coinciding with this result, Ramos-Rodríguez et al. (2019) also did not find a relationship between meteorological and fuel variables. While in plots located in areas with dispersed fuels (Table 8), significant linear relationships (P < 0.05) were obtained only for flame height with relative humidity (r = -0.998; P = 0.042).
In the plots located in the fuel rows, a significant relationship was obtained between fuel variables and fire behavior variables for fuel weight with lethal drying height (r = 0.636; P = 0.048) and thickness with heat released per unit area. (r = 0.756; P = 0.011), while the relationship was highly significant for thickness with linear intensity (r = 0.854; P = 0.002) and with lethal drying height (r = 0.841; P = 0.002) (Table 7). For its part, in the plots located in dispersed fuels the relationship was highly significant for the propagation speed with the thickness of the fuel layer (r = 1.000; P = 0.009) and for the weight of the fuel material with the heat released by unit area (r = 1.000; P = 9.8877x10⁻⁷) (Table 8). However, Souza et al. (2023), obtained a high relationship between the height of the flame and the load or amount of combustible material working with forest fuels from the Cerrado.
Table 7. - Spearman correlation matrix between the variables used in the experiment for the case of the plots located in the fuel rows
| Hll | Vpf | Yo | hs | Ha | T | HR | vv | PcA | |
| Vpf | 0.648* | 1,000 | - | - | - | - | - | - | - |
| Yo | 0.467 | 0.746* | 1,000 | - | - | - | - | - | - |
| hs | 0.370 | 0.722* | 0.988** | 1,000 | - | - | - | - | - |
| Ha | -0.127 | 0.000 | 0.624 | 0.636* | 1,000 | - | - | - | - |
| T | -0.030 | 0.208 | 0.333 | 0.394 | 0.067 | 1,000 | - | - | - |
| HR | -0.042 | -0.128 | -0.103 | -0.455 | 0.115 | -0.830** | 1,000 | - | - |
| vv | -0.430 | -0.300 | -0.224 | -0.200 | 0.079 | -0.552 | 0.818** | 1,000 | - |
| PcA | -0.127 | 0.000 | 0.624 | 0.636* | 1,000** | 0.067 | 0.115 | 0.079 | 1,000 |
| EspA | 0.299 | 0.486 | 0.854** | 0.841** | 0.756* | 0.128 | 0.110 | -0.159 | 0.756* |
Note: Hll: Flame height; Vpf: Fire propagation speed; I: Linear fire intensity; hs: Lethal drying height; Ha: Heat released per unit area; T: Air temperature; Hr: Relative humidity; Vv: Wind speed; PcA: Dry weight of the fuel material before burning; EspA: Thickness of the fuel layer before burning. **. The correlation is significant at the 0.01 level (2-tailed). *. The correlation is significant at the 0.05 level (2-tailed).
Table 8. - Pearson correlation matrix between the variables used in the experiment for the case of plots located in dispersed fuels
| Hll | Vpf | Yo | hs | Ha | T | HR | vv | PcA | |
| Vpf | 0.908 | 1,000 | - | - | - | - | - | - | - |
| Yo | -0.141 | 0.287 | 1,000 | - | - | - | - | - | - |
| hs | 0.271 | 0.650 | 0.915 | 1,000 | - | - | - | - | - |
| Ha | -0.932 | -0.694 | 0.490 | 0.096 | 1,000 | - | -- | - | - |
| T | 0.895 | 0.625 | -0.568 | -0.187 | -0.996 | 1,000 | - | - | |
| HR | -0.998* | -0.933 | 0.076 | -0.333 | 0.906 | -0.864 | 1,000 | - | - |
| vv | -0.250 | 0.179 | 0.994 | 0.864 | 0.584 | -0.656 | 0.186 | 1,000 | - |
| PcA | -0.932 | -0.694 | 0.490 | 0.096 | 1,000** | -0.996 | 0.906 | 0.584 | 1,000 |
| EspA | 0.914 | 1,000** | 0.274 | 0.639 | -0.704 | 0.636 | -0.938 | 0.165 | -0.704 |
Note: Hll: Flame height; Vpf: Fire propagation speed; I: Linear fire intensity; hs: Lethal drying height; Ha: Heat released per unit area; T: Air temperature; Hr: Relative humidity; Vv: Wind speed; PcA: Dry weight of the fuel material before burning; EspA: Thickness of the fuel layer before burning. **. The correlation is significant at the 0.01 level (2-tailed). *. The correlation is significant at the 0.05 level (2-tailed).
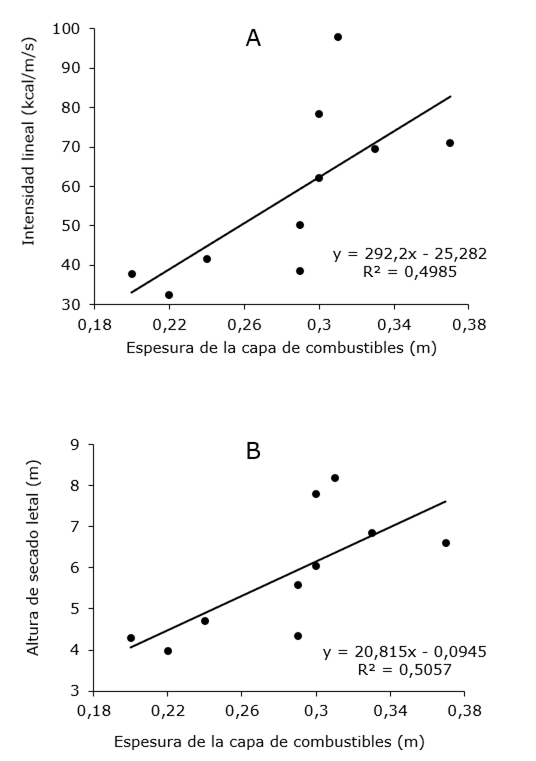
The regression analyzes were carried out considering that in practice it is possible to modify the thickness of the fuel material before burning and the association obtained between this variable with the linear intensity and with the height of lethal drying in the case of the plots located in the fuel rows (Figure 3), observing in both cases a positive relationship, and the equations obtained can be used to change the expected behavior of the fire by modifying the thickness of the layer of combustible material when the piles or rows of the same are made.
CONCLUSIONS
The weight of the dry fuel material and the thickness of the fuel layer before burning were greater in the plots located in the fuel rows than in the areas where it was dispersed. Consequently, higher mean values were also obtained for the variables that describe the behavior of the fire in the first group of plots, except for the case of propagation speed.
In general, significant correlations were obtained between the variables used in the experiment in the case of the plots located in the fuel rows, but this was not the case in the case of the plots located in the dispersed fuel areas. In the first group of plots, the correlation values obtained for the thickness of the fuel layer and the variables that describe the behavior of the fire are interesting.
From the results obtained for the relationship of the variable thickness of the fuel layer with the linear intensity and with the height of lethal drying, regression models were obtained that can be used in practice to modify the behavior of the fire if this was necessary.
REFERENCIAS BIBLIOGRÁFICAS
BATISTA, A.C., BEUTLING, A., y PEREIRA, J.F., 2013. Estimativa do comportamento do fogo em queimas experimentais sob povoamentos de Pinus elliottii. Árvore, vol. 37, no. 5, pp. 779-787. https://www.scielo.br/j/rarv/a/By4ysMc5986HxXXWC86XNSK/abstract/?lang=pt [ Links ]
BISQUERRA ALZINA, R., 2009. Metodología de la investigación educativa. Segunda ed. Madrid: La Muralla, S.A. ISBN 9788471337481. Disponible en: https://books.google.com.cu/books/about/Metodolog%C3%ADa_de_la_investigaci%C3%B3n_educat.html?id=VSb4_cVukkcC&source=kp_book_description&redir_esc=y [ Links ]
ÈEKOVSKÁ, H., GAFF, M., OSVALDOVÁ, L.M., KAÈÍK, F., KAPLAN, L., y KUBŠ, J., 2017. Tectona grandis Linn. and its fire characteristics affected by the thermal modification of wood. BioResources [en línea], vol. 12, no. 2, pp. 2805-2817. ISSN 1930-2126. DOI 10.15376/biores.12.2.2805-2817. Disponible en: https://bioresources.cnr.ncsu.edu/wp-content/uploads/2017/03/BioRes_12_2_2805_Cekovska_Tectona_grandis_Fire_Charac_Affected_Thermal_Modifc_Wood_11049.pdf. . [ Links ]
CRUZ, M. G., HURLEY, R. J., BESSELL, R., y SULLIVAN, A. L., 2020. Fire behaviour in wheat crops-effect of fuel structure on rate of fire spread. International Journal of Wildland Fire, vol. 29, no. 3, pp. 258-271. ISSN 1049-8001. Disponible en: DOI 10.1071/WF19139. Disponible en: https://www.researchgate.net/publication/338618264_Fire_behaviour_in_wheat_crops_-_effect_of_fuel_structure_on_rate_of_fire_spread [ Links ]
GOBIERNO AUTÓNOMO DESCENTRALIZADO MUNICIPAL DE JIPIJAPA, 2015. Plan de Desarrollo y Ordenamiento Territorial cantón Jipijapa. [en línea]. Actualización del Plan de Desarrollo y Ordenamiento Territorial. GOBIERNO AUTÓNOMO DESCENTRALIZADO MUNICIPAL DE JIPIJAPA Disponible en: https://es.scribd.com/document/478961755/1360000630001-PDYOT-JIPIJAPA-14042016-14-04-2016-10-45-27-pdf. [ Links ]
LONDE DE CAMARGOS, V., ASSUNÇÃO RIBEIRO, G., DA SILVA, F.A., MARTINS, S.V., y DA SILVA CARMO, M.F., 2015. Estudo do comportamento do fogo em um trecho de floresta estacional semidecídua no município de Viçosa, Minas Gerais. Ciência Florestal [en línea], vol. 25, no. 3, pp. 537-545. [Consulta: 31/10/2023]. ISSN 0103-9954. Disponible en: Disponible en: http://www.redalyc.org/articulo.oa?id=53441497001 . [ Links ]
MANRIQUE-TOALA, T., RAMOS-RODRÍGUEZ, M.P., DE LA CRUZ-ROSALES, G., TIGUA-PINELA, Y., y PINCAY-ORTEGA, S., 2022. Uso del fuego en tierras de vocación forestal del cantón Jipijapa, Manabí, Ecuador. Bosques Latitud Cero, vol. 12, no. 2, pp. 40-51. Disponible en: https://doi.org/10.54753/blc.v12i2.1600. [ Links ]
MORGAN, G.W., TOLHURST, K.G., POYNTER, M.W., COOPER, N., MCGUFFOG, T., RYAN, R., WOUTERS, M.A., STEPHENS, N., BLACK, P., SHEEHAN, D., LEESON, P., WHIGHT, S., y DAVEY, S.M., 2020. Prescribed burning in south-eastern Australia: history and future directions. Australian Forestry [en línea], vol. 83, no. 1, pp. 4-28. ISSN 2325-6087. DOI 10.1080/00049158.2020.1739883. Disponible en: https://sci-hub.wf/10.1080/00049158.2020.1739883. [ Links ]
NASA, 2023. The Prediction Of Worldwide Energy Resources (POWER). [en línea]. NASA . Disponible en: https://power.larc.nasa.gov/ [ Links ]
NGHALIPO, E., JOUBERT, D., THROOP, H., y GROENGROEFT, A., 2018. The effect of fire history on soil nutrients and soil organic carbon in a semi-arid savanna woodland, central Namibia. African Journal of Range and Forage Science [en línea], vol. 36, no. 1, pp. 9-16. ISSN 1727-9380. DOI 10.2989/10220119.2018.1526825. Disponible en: https://sci-hub.wf/10.2989/10220119.2018.1526825. [ Links ]
PANICO, S.C., CECCHERINI, M.T., MEMOLI, V., MAISTO, G., PIETRAMELLARA, G., BARILE, R., y DE MARCO, A., 2020. Effects of different vegetation types on burnt soil properties and microbial communities. International Journal of Wildland Fire , vol. 29, no. 7, pp. 628-636. ISSN 1049-8001. Disponible en: DOI 10.1071/WF19081. https://www.researchgate.net/publication/339307400_Effects_of_different_vegetation_types_on_burnt_soil_properties_and_microbial_communities [ Links ]
RAMOS-RODRÍGUEZ, M.P., ALCÍVAR-COBEÑA, A., CEDEÑO-LUNA, N.A., y MANRIQUE-TOALA, T.O., 2022. Usos tradicionales del fuego en las actividades agrícolas de la parroquia Convento, cantón Chone, Manabí, Ecuador. Revista Cubana de Ciencias Forestales [en línea], vol. 10, no. 2, pp. 319-335. Disponible en: https://cfores.upr.edu.cu/index.php/cfores/article/view/766. [ Links ]
RAMOS-RODRÍGUEZ, M.P., CEDEÑO-CEDEÑO, D.S., BATISTA, A.C., JIMENEZ-GONZÁLEZ, A., MANRRIQUE-TOALA, T.O., y TERRO, A.F., 2021. Usos tradicionales del fuego en la Parroquia Ayacucho, cantón Santa Ana, provincia Manabí, Ecuador. Revista Forestal Mesoamericana Kurú [en línea], vol. 18, no. 43, pp. 41-52. [Consulta: 23/10/2022]. DOI 10.18845/rfmk.v19i43.5807. Disponible en: Disponible en: https://revistas.tec.ac.cr/index.php/kuru/article/view/5807 . [ Links ]
RAMOS RODRÍGUEZ, M.P., PICO CORONEL, O.G., JIMENEZ GONZÁLEZ, A., CANTOS CEVALLOS, C.G., TAPIA ZÚÑIGA, M.V., y MERO JALCA, O.F., 2019. Comportamiento del fuego a escala experimental en una plantación de Tectona grandis L.f. en Jipijapa, Manabí, Ecuador. Revista Brasileirade Ciencias Agrarias, vol. 14, no. 1, pp. 1-9. ISSN 1981-0997. DOI https://doi.org/10.5039/agraria.v14i1a5607. [ Links ]
RANDERSON, J.T., CHEN, Y., VAN DER WERF, G.R., ROGERS, B.M., y MORTON, D.C., 2012. Global burned area and biomass burning emissions from small fires. Journal of Geophysical Research: Biogeosciences, vol. 117, no. G04012, pp. 1-23. ISSN 0148-0227. Disponible en: DOI 10.1029/2012JG002128. https://escholarship.org/uc/item/0bf0810n [ Links ]
RODRÍGUEZ-TREJO, D.A., MARTÍNEZ-MUÑOZ, P., PULIDO-LUNA, J.A., MARTÍNEZ-LARA, P.J., y CRUZ-LÓPEZ, J.D., 2020. Combustibles, comportamiento del fuego y emisiones en un pastizal y una sabana artificiales en Chiapas. Revista de Biología Tropical, vol. 68, no. 2. ISSN 0034-7744. Disponible en: DOI http://dx.doi.org/10.15517/rbt.v68i2.33954. [ Links ]
SANTÍN, C., y DOERR, S.H., 2016. Fire effects on soils: The human dimension. Philosophical Transactions of the Royal Society B: Biological Sciences, vol. 371, no. 1696, pp. 28-34. ISSN 1471-2970. DOI 10.1098/rstb.2015.0171. [ Links ]
SEGER, C.D., BATISTA, A.C., TETTO, A.F., y SOARES, R.V., 2013. Comportamento do Fogo em Queimas Controladas de Vegetação de Estepe no Município de Palmeira, Paraná, Brasil. Floresta [en línea], vol. 43, no. 4, pp. 547-558. Disponible en: http://ojs.c3sl.ufpr.br/ojs/index.php/floresta/article/view/31385. [ Links ]
SOARES, R.V., BATISTA, A.C., y TETTO, A.F., 2017. Incêndios florestais: controle, efeito e uso do fogo. Segunda Ed. Curitiba: Gráfica Capital. ISBN 978-85-904353-6-5. Disponible en: https://books.google.com.cu/books/about/Inc%C3%AAndios_florestais.html?id=DmTxZwEACAAJ&redir_esc=y [ Links ]
SOUZA, I.V., GOMES, H., SOUSA, D.A., SILVESTRE, A., DORNELAS, P., BATISTA, A.C., RODRIGUES, G., y GIONGO, M., 2023. PREDICTING SURFACE FOREST FUELS ON THE CERRADO IN CANTÃO STATE PARK FROM AIRBORNE RGB SENSOR IMAGES. Floresta, vol. 53, no. 4, pp. 538-547. ISSN 1982-4688. DOI 10.5380/rf.v53i4.88805. Disponible en: https://www.semanticscholar.org/paper/PREDICTING-SURFACE-FOREST-FUELS-ON-THE-CERRADO-IN-Souza-Sousa/556ae07c4d107b95c1e2f8cc67bf9d71bb200204 [ Links ]
Received: December 27, 2023; Accepted: March 22, 2024

