


 Servicios personalizados
 Inglés (pdf)
 Articulo en XML
 Referencias del artículo
 Enviar articulo por email
 Citado por SciELO
  Similares en
SciELO
Similares en
SciELO 
 Permalink
Introduction
The arterial network apparently follows certain optimality principles (minimum pumping effort, minimal area, 1-2). This optimality does not necessarily emerge as result of a sophisticated genetic program 3; instead, it may follow simple mechanical rules operating locally that at the end pave the wave for global auto-organization, as is the case in many natural complex systems. The structure of arterial networks has been studied from different viewpoints 1-4. On the other hand, certain cardiovascular signals (e.g. both invasive and noninvasive pulse pressure) have been examined in relation to the anatomical aspects of different vessels. In particular, the presence of reflected waves in pulse pressure signals is apparently related to wave reflections at bifurcation points of the aorta 5-7. Much attention has been paid to the first reflected wave, apparently coming from the main of the abdominal aorta. The reflected wave appears as superimposed with the incident wave and methods have been developed for extracting the reflected wave from the overall PPG wave complex 8. Well known indices as the augmentation index are obtained through this kind of procedure 9. Changes of these indices with age are presumably related to major changes in the aorta’s anatomical, mechanical and viscous-elastic properties. Reflected waves are expected not only from major bifurcations. For very simple models of vessel branching, a reflected wave will appear at any bifurcation for which the total cross-sectional area of daughter branches is smaller than that of mother branches. 11
In theory, an optimal arterial network does not generate reflected waves. According to this criterion, however, real structures, such as the coronary artery studied by Changizi and Cherniak 3 apparently contain about 13% of non-optimal bifurcations. In this sense, the presence of reflected waves in the PPG signal might be viewed as an evidence of non-optimality of the arterial network. Different authors have estimated cardiovascular compliance, an index that considers the presence of several reflected waves in the descending phase of a pulse wave signal. Arterial compliance assessed from invasive and noninvasive continuous pressure signals, has been described as one of the best predictors of cardiovascular age (r=0.66, n=212). 12
We consider that here are two poorly explored avenues in this line of research: One of them is nonlinear time series analysis 13-14. In this approach, the morphology of a waveform is conceived as the result of an underlying dynamical system plus the influence of stochastic drive that is not necessarily measuring error or noise due to person’s movements but a real stochastic input into the system that can considerably change the properties of the generated signal 15-16. In this approach nonlinear identification consists of finding the autoregressive function that can better reproduce the underlying dynamics. From the obtained function a noise-free realization can be obtained via recursive evaluation of the obtained autoregressive function. In the case of nonlinear functions, periodic or chaotic Noise-Free Realizations (NFR) may appear. A criterion for quality of fit is, besides optimal one-step-ahead prediction, that the obtained NFR retains the typical pattern of the original trace [17]. Indeed, Shi et al (2000) have shown that pulse wave signals can be nicely estimated (and mimetized) using a Kernel nonparametric approach 18, See Figures 4 and 5 therein.
On the other hand, the photoplethysmographic (PPG) signal records pulsatile volume changes in the vessels irrigating a certain area, usually a finger or a toe. In theory at least [11], this signal is closely related to arterial pressure. Unlike other signals, the recording of the PPG signal is very simple and the commercially available devices from certified dealers can be on the order of 200 USD, compared to $3789.00 for an applanation tonometer or $40000.00 for a Finapress system. This makes PPG the metric of choice in field conditions or primary care situations.
Nonlinear estimation of PPG signals allows not only satisfactory one step ahead prediction, but also excellent mimetic capability, both in recovering the original pattern and in producing linear log-log spectra (Fig. 1). This mimetic capability enabled us to introduce a new index derived from estimating the slope of log-log spectra of PPG signal’s NFR. Our aim was to determine possible changes with age in the spectral composition of corresponding NFR.
A priori, we hypothesize that the spectral components beyond 7 Hz range correspond to the presence of reflected waves coming from deep parts of the vascular tree. Even when it is hard to demonstrate this assumption theoretically, simulation results obtained by Allastruey et al 19-20, indicate that reflected waves coming from farther branching sites do contribute to higher frequencies.
Methods
Subjects
Volunteers were recruited in the city of Orense, Spain. They were free of clinical cardiovascular disease and medication, and Body Mass Index never surpassed 31 kg/m-2. Approval was obtained from the local research ethics committee, and written informed consent was obtained from all participants. Five-min-duration photoplethysmographic signals were obtained from the pointer finger of the right arm with the subject in supine position, using a validated oximeter (Nellcor 395, USA). Signals were digitized at 1000 Hz and saved as ASCII files. For signal processing purposes data were down-sampled to 100 Hz. Continuous pulse pressure signals digitized at 125 Hz were downloaded from the “Fantasia” data base available at www.physionet.org.
Data analysis
Signal processing: Kernel nonlinear autorregression. Formally, a segment of the PPG (or pulse wave) signal is considered as dynamically emerging from a system of the type:
 (1)
(1)
 is state vector;
  is a smooth map called as the skeleton of the underlying dynamical system [10];
  is a sequence of dynamical noise, such that et is independent of xt-s for s>0; and m is a positive integer called lag.
In the most general case, when very few assumptions are made about the function f (smoothness, stationarity) it is convenient to estimate the nonlinear autoregressive function f via Naradaya-Watson nonparametric kernel estimation (11-13). In kernel nonparametric estimation, the estimate f in (1) at a point (Zt-1, Zt-2, …,Zt-n) of the state space, is obtained as a weighted average of all the data (x1, x2, …, xN). Specifically:
 (2)
(2)
Here,  is the kernel function and the parameter h is the bandwidth parameter to be selected for optimal approximation. In our implementation, h is selected via cross validation error minimization.
In this study the following exponential kernel was selected.

To find the bandwidth parameter h, a cross validation one-step-ahead criterion was applied. The obtained skeleton was regarded as valid if it also met two mimetic criteria; it means that the NFR must be able:
To capture the pattern of the original signal,
To present a linear section in the corresponding log-log spectrum similar to that of the original PPG signal.
Figure No. 1 summarizes the example of a satisfactory NFR

Fig. 1 Original PPG signal, (top left), the estimated NFR (top right), and corresponding power spectra.
The acquisition of a proper NFR from a time series is not granted by any of the estimation methods available today, it depends on the nature of the signal, its length, and other factors. In this study, a 300 data point segment was selected randomly from each individual signal. Nonlinear identification was applied to each individual segment. The process was repeated until at least three valid NFR were obtained from an individual recording.
KCRIndex. The index is estimated as the average of the absolute value of the negative slope from all valid NFR obtained during the estimation. At least 3 valid NFR must be obtained from each individual recording.
Statistical analysis. The following methods were used: regression and correlation analysis, Kolmogorov-Smirnov test for normality, Mann-Whitney U-test for comparing two groups, t-test for means.
Results
Continuous Pulse Pressure among Young and Elderly Clinically Healthy Subjects
The estimation of KCRIndex to these subjects summarized in Figure 2. Clearly, KCRIndex is reduced with age among healthy individuals (p=0.0037).
A nonparametric comparison between the two groups yielded a very significant difference (2*1sided exact p=0.000011, Mann-Whithney’s U-test).
Orense data
Recordings were performed on 190 subjects. All recordings were proven valid, and KCRIndex was obtained from each individual recording. The mean age was 45±18 years and ranged from 9 to 87 years, grouped by decades. Ages are distributed as per Table I.
Table I Demographic data for subjects from the Orense Database.
| Age group | Mean age | STD age | Sex Male/Female | Weight Mean | Weight STD | n |
|---|---|---|---|---|---|---|
| 9-15 | 10.71 | 1.25 | 4/3 | 41.2 | 12.2 | 7 |
| 16-25 | 21.19 | 3.12 | 17/3 | 71.7 | 18.7 | 21 |
| 26-35 | 31.10 | 2.66 | 19/21 | 70.0 | 11.4 | 40 |
| 36-45 | 40.36 | 2.84 | 19/17 | 71.0 | 12.8 | 36 |
| 46-55 | 49.58 | 2.59 | 16/15 | 72.4 | 12.5 | 31 |
| 56-65 | 60.55 | 3.26 | 11/11 | 71.8 | 9.7 | 22 |
| 66-75 | 69.75 | 3.21 | 8/12 | 68.3 | 9.8 | 20 |
| 76-85 | 79 | 1.76 | 5/5 | 66.7 | 10 | 10 |
| >85 | 88 | 1.41 | 1/1 | 64 | 5.7 | 2 |
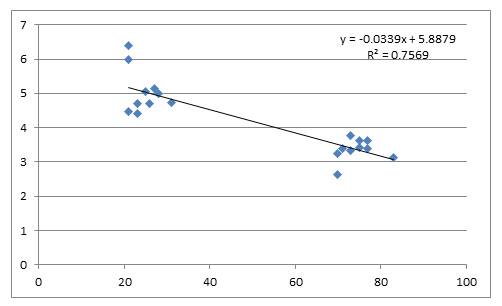
KCRIndex estimated from PPG recordings changed steadily with age in a linear manner (Fig. 3).

On the other hand, the obtained correlation coefficient is high (r=0.751; p<0.00005). Attempts to fit these data to other type of function did not increase the quality of fit, thus this dependence is strongly linear for the considered age group. There were no practically differences between genders (y=-0.026x+6.942; R2=0.558 for male y=-0.024x+6.819; R2=0.571 for female).
Age group comparisons
We attempted to detect whether adjacent age groups proved significantly different in KCRIndex values.
As figure 3 shows, a ten-year age difference means a reduction in KCRIndex of 0.25 units.
Table II basically supports this result.
Table II KCRIndex values distributed by age group.
| group | Mean age | SD age | Mean KCRIndex | SD KCRIndex |
|---|---|---|---|---|
| 9-15 | 10.71 | 1.25 | 6.77 | 0.41 |
| 16-25 | 21.19 | 3.12 | 6.19 | 0.50 |
| 26-35 | 31.10 | 2.66 | 6.12 | 0.45 |
| 36-45 | 40.36 | 2.84 | 5.83 | 0.44 |
| 46-55 | 49.58 | 2.59 | 5.64 | 0.33 |
| 56-65 | 60.55 | 3.26 | 5.23 | 0.45 |
| 66-75 | 69.75 | 3.21 | 5.17 | 0.41 |
| 76-85 | 79.00 | 1.76 | 4.82 | 0.21 |
| >85 | 88.00 | 1.41 | 4.72 | 0.01 |
KCRIndex passed the Kolmogorov-Smirnov test for normality (P>0.25), and we compared all adjacent groups for significant differences as per the mean KCRIndex values. Results appear in Table 3.
Table 3 “p-values” resulting from comparing neighboring age groups
| 10to20 | 0.00520 | |
| 20to30 | 0.29000 | |
| 30to40 | 0.03000 | |
| 40to50 | 0.02640 | |
| 50to60 | 0.00020 | |
| 60to70 | 0.32000 | |
| 70a80 | 0.00520 |
Legend: “10to20” means comparison between groups: aged 9-15 years with group aged 16-25 years.
Thus, it is not uncommon to see that age groups differing by a decade are different. With this dataset, it was not possible to find differences between any adjacent age group differing only by 5 year increments.
Discussion
The main findings of the current study are that spectral composition of noise-free-realizations obtained from both continuous pulse pressure and PPG recordings change with age in an apparently linear way. The main distinctive aspect of our approach has been to focus on the extraction of those features of the underlying dynamics that are less influenced by stochastic contributions. Beat to beat, PPG waveforms exhibit a variability in their shape and averaging is not the best way of getting rid of “noise” if data arise from a nonlinear system.
On the other hand, modeling the generation and propagation of pulse waves in the arterial network is a formidable task. Bottom up models with no less than 50 arteries can provide valuable insight about what can be expected. At the same time, as we know, the slightest perturbation in the network, be it a thrombus, an atheroma plaque or a tear in the intimae, can lead to huge changes in the solutions.
A top-down approach allows the data to drive the search for a likely solution. The fact that the obtained noise free realizations are capable of mimetizing the original waveforms can suggest that with this approach a substantial portion of the underlying dynamics is captured. Moreover, the fact that the slope of the corresponding log-spectra changes with age can suggest that this parameter reflects substantial processes taking place within the organism.
Besides these merely theoretical questions, our results also have practical implications.
In the literature there is much discussion regarding when changes in the arterial network begin. Results from table 3 suggest the following answer: changes start at around 15-20 years. A larger data sample perhaps can bring a more precise answer. This is in agreement with the idea that atherosclerotic changes start in childhood, but somewhat contradict the results of Giuliani et al. using HRV data who saw no differences between 25 and 35 years 21.
Cardiovascular researchers seem to expect much from the creation of a cardiovascular age estimator. This is not surprising: age, as suggested, is the major 'shareholder' in cardiovascular disease 22. Pathological conditions are thus likely expected to appear in individuals whose cardiovascular age is higher that chronological age. Among early attempts of creating a CV age estimator we find Giuliani et al 21, who obtained a correlation of 0.71 in a sample of 112 subjects. On the other hand, in a sample of 212 subjects McVeigh et al found that the compliance index strongly correlates with age (r=0.66). Correlation coefficient comparison reveals that our data present a stronger correlation than those of McVeigh (p=0.0353, one sided test). Other authors have based their CV age estimators on morphological properties of the arteries23, as aortic arch distensibility or pulse wave velocity at the aorta assessed via MRI 24, or a so called “calcium index” 25.
At this time it seems pretentious to predict cardiovascular age on the basis of the regression equation when predicted age can differ by up to 20 years in normal individuals.
On the other hand, it seems appropriate to use z-scores as a way to assess an individual’s condition. Taking our data as the normative database sub-sectioned into decades, it is possible to estimate the corresponding Z score for a person in a given age range (e.g. from 26y to 35 y). If this value goes below -1.96, the person falls below the 97 percentile for her/his age and can be considered to have an aged arterial network. As an illustration, we estimated KCRIndex in a sample of 25 obese subjects aged 6-75y. For comparison, 25 age-matched healthy individuals from our database were selected. We found that there is a higher proportion of individuals with z-scores below -1.96 among obese persons than among their healthy counterparts. (0.32 vs. 0.04; p=0.0066, proportion comparison test).These results may be interpreted as supporting the idea that obesity is a risk factor for accelerated vascular ageing.
Another approach to cardiovascular age estimation is via multivariate analysis where, besides KCRIndex, other indices reported in literature could be included. Possible candidates could be the PC1 obtained by Piccirillo from RQA analysis of heart rate variability. PC1 showed a strong correlation with age (r=0.73, n=112).
Other components could be the compliance index as described by McVeigh et al 12 as mentioned. This index is highly correlated with age (r=0.66, n=212). Finally, PTT, or transit time of the PPG signal can also be used but in this case, simultaneous recording of an ECG signal and a PPG signal (or two PPG signals) is required. Since PC1, PPT and KCRIndex apparently refer to 3 different physiological processes (autonomic regulation, arterial stiffness and network configuration); these seem to be good candidates for a multivariate cardiac age estimator. Currently, our group is working on the implementation of these measurements.
Summarizing, an index obtained from the PPG signal using a nonlinear identification approach has shown to be well correlated with age.

