


 Servicios personalizados
 Inglés (pdf)
 Articulo en XML
 Referencias del artículo
 Enviar articulo por email
 Citado por SciELO
  Similares en
SciELO
Similares en
SciELO 
 Permalink
INTRODUCTION
The rising in the energy costs driven by the global demand as well as environmental legislations created the need for a global standard to manage energy consumption.
Introduced in June 2011, the ISO 50001 International Standard was developed to provide a unified framework for energy management which aims at achieving a sustainable reduction of energy through its systematic control, documentation and awareness of all personnel involved [1]. ISO 50 001 is a documented structure that defines the organization's policy, objectives and responsibilities [2].
It establishes procedures and processes for planning, control, assurance, improvement, training, internal verification and corrective and preventive actions. The standard generally does not detail any specific performance criteria, but rather focuses on the identification of SEnUs and continuous improvement. [3]. ISO 50001 allows to the organizations:
Develop a policy for more efficient use of energy
Fix energy efficiency targets and objectives to meet the policy
Use data for better understanding and decision making concerning energy use and consumption
Measure the results of energy efficiency improvements
Review the effectiveness of the energy policy
Continually improve energy management
According to reports from the German Federal Environmental Agency in 2014, ISO 50001 showed a growth rate of 40 %, issuing 7345 certifications globally. In this scenario Europe reached 80% of the total number of certified companies, led by Germany (47 %) due to the country's energy legislation. A study of the business value of the standard evaluated nine facilities that reported a profitable recovery period of approximately 1,7 years with an average energy cost savings of $ 503 000 per year [4]. The statistic portal website [5] reported that in 2007 the world's telecommunications centers consumed a total of 293 GWh and it estimated an increase of 2, 24 times by 2020. Other sources consider that data processing centers (DPCs) and transmission centers consume more than 70% of electricity in this sector [6]. These facilities are characterized by uninterrupted
Information Transmission (IT) equipment and air conditioning systems equipment, which dissipate the heat emitted by the main equipment to be operated at a defined temperature and relative humidity [6]. This causes the cooling costs to be substantial. For example, in 2010, DPCs used 130,000 GWh worldwide to cool servers [7].
When an energy audit was carried out to a telecommunications company aimed at the broadcasting of radio and television networks, it was detected that they do not have an established Energy Management System (EnMs). The absence of Energy Performance Indicators (EnPIs) and the non-identification of SEnUs, among others things, did not allow an efficient monitoring of the energy resources in the transmission centers. In this context the implementation of ISO 50001 will increase its competitiveness. The present article focuses on showing the most relevant results of the analysis performed to this company for the future implementation of an EnMs based on the standard. The scope of the research is the energy planning phase and two methodologies present in specialized literature will be applied in this area.
MATERIALS AND METHODS
Planning process stage procedures
The model of this management system based on ISO 50001 assumes the Planning-Do-Check-Act cycle. This model is consistent with the quality management systems according to ISO 9001, management systems environmental protection according to ISO 14001 and systems of management of occupational health and safety according to ISO 18001, which facilitates the integration of all them [8]. The stage of process planning is an essential element in EnMs. It can be understood as the diagnosis of the organization in order to find the causes of the low level of energy efficiency. It allows determining the activities that can be carried out to improve the energy performance of the processes [9]. It establishes in an organized way, a detailed activity plan that will be carried out to reach the objectives and the energetic goals. It also implements deadlines, priorities, economic, material and human resources, as well as the scope of the management system and responsibilities.
A planning process flowchart was proposed by [10]. It was developed as a pilot project and integrated entities such as training material, data collecting tools, and project management to achieve a single unified framework. This procedure was used by [11] in order to build software created as a guide for energy management consultants to assist manufacturing plants. Correa, González, Borroto and Alpha [12] proposed other procedure for the energy planning of the EnMs based on the standards ISO 50001: 2011, UNE 216301: 2007, DIN EN 16001, ANSI/MSE 2000: 2008 and ISO 9001: 2008. The results obtained from the planning phase enabled the study case analyzed (Oleohidráulica Company) determining the significant consumption areas, a consumption structure and a base-line fitting the goal of the organization related to energy. The authors used tools and techniques such as: expert’s stakeholders, documents reviews, and tools from the Technology for Total- Efficient Management of Energy [12; 13], developed by the Study Center of Energy and Environment from the University of Cienfuegos, Cuba. The basic statistical tools were: Pareto chart, control chart, energy-production diagram: efficiency indicator base 100; graphic tendency or Sums Indicator Accumulate (CUSUM), among others.
Those tools were validated by previously quoted authors [14; 15; 16] that analyzed the use and consumption of energy in the organization studied and also identified the areas where the SEnUs presented opportunities for the improvement of energy performance.
Internal audits tools
Several documents were required to fulfill the audit process in the planning phase: re-examined old inspections and auditing reports of energy, all documents involving the EnMs (in case that the organizations have one) were presented for evaluation. The energy consumption data for each energy source for past and present usage. In order to assess the auditing processes in the planning stage, the Carbon Trust Standard development the two quantitative tools that organizations can use to self-assess their performance across the areas of energy management. They are both available as a single Excel file Energy management self-assessment tool (CTX614) from the Carbon Trust website [17]
The first tool used was the Energy Management Matrix, it helps organizations assess their strengths and weaknesses across the following six areas of energy management: policy, organizing, training, performance, measurement, communication and investment. The Energy Management Assessment (EMA), as a more explicit tool allows evaluating twelve key energy management areas and hierarchically valued in importance by having varying maximum scores. The different parameters evaluated are illustrated across an overall percentage score generated for each of the twelve areas and plotted on a radar (spider's web) type chart. This illustrates the relative strengths and weaknesses and therefore identifies areas for improvement.
2.3. ENPis for Data Centers
Control of energy management is done through ENPIs which constitute an important basis of comparison and monitoring. ENPISs are quantitative values or measures of energy performance. They can be expressed as a simple measurement, a quotient (consumption/production) or a more complex model. The fundamental objective is to control and reduce the energy losses in the productive processes, as well as to evaluate technically and economically the potential of reducing energy losses [8].
DPCs are informatics depots mainly composed of IT equipment and cooling systems. Similarly, DPCs use a series of energy indicators that allow them to quantify and compare energy efficiency levels [18; 19]. Taking into account the similarity existing between these and the centers of transmission considering the distribution of consumption, it is proposed to apply some of them in order to enrich the EnMs.
1. Power Usage Effectiveness (PUE) is a standard metric of the communications industry to illustrate the energy efficiency of the data center infrastructure. According to The Green Grid, "When it is viewed in the right context, PUE provides strong guidance and useful information to design efficient energy and cooling architectures, to deploy the equipment within those architectures, and to operate the equipment day to day. The mathematical expression of the PUE is observed in the equation (1):
By definition, PUE is always greater than 1,0; all that exceeds 1.0 is indirect energy consumed by other non-IT loads, such as cooling, lighting or security systems. The energy consumption of air conditioning systems represents the largest proportion, consequently the potential for energy savings is also the largest.
2. Data center infrastructure efficiency (DCiE), see equation (2), is the inverse of PUE. It relates the total energy consumed by IT equipment to the total energy consumed by the center. It appropriately displays the efficiency level by relating the input power to the output power. [20].
3. Unit Demand of Cooling (UDC) allows identifying if the energy expenditure in the refrigeration system is reasonable respect to the thermal demand to be dissipated by the IT equipment. High values of the indicator will describe facilities where the air distribution or type of technology used for refrigeration is less efficient. UDR was defined as: equation (3)
4. Another of the challenges these transmission centers have is the environmental impact associated with the use of electricity [21; 22]. Then the efficiency can also be measured in terms of its Technology Carbon Efficiency (TCE).
5. Indicates the link between used energy and emissions and identifies the most respectful centers with the environment. This is determined by the equation (4):
The purpose of these indicators is to provide a comparative framework to evaluate different transmission centers. This will be used to prioritize improvement actions depending on their level of energy efficiency.
DISCUSSIONS AND RESULTS
The Radio-communication and Broadcasting Company, which was taken as the object of study, guarantees the transmission of the radio channels by medium wave (MW), by amplitude modulated (AM) and frequency modulated (FM), besides the transmission of the TV channels. It is made up of 16 transmitting centers that offer coverage to a large part of the territory. From the economic point of view, the energy carriers represent the second significant value of the company’s expenses with 25, 24% of the total with the most significant electricity consumption representing 79%, so the energy analysis will be directed to electricity. In the case of radio transmitters broadcasting schedule is set for a 24 h time programming and 8 TV broadcasting programs of 5 channels with 24 h programs and the rest with 09:00 -23:00 fixed programs time.
Review of the energy planning process. The initial analysis of the current SGE's
First, a working team of researchers from the Centro de Estudio de Energía y Medio Ambiente (CEEMA) and employees of the company with responsibilities in the energy area was formed composed. Reports from previous auditing processes were reviewed; also all documentation presented by the company in terms of EnMs use was critically examined; 100 % of the personnel involved in the use of energy resources were polled. Some of the failures detected in the initial analysis were:
They do not have the legal document’s register applicable to the standard ISO 50001
They lack a defined energy strategy, an energy policy, energy objectives, goals and action plan for non-conformities
The energy planning processes were superficial; they were based in general plans of the organization's top management disregarding the company's potentialities; neither were they being applied by legal means
There is not sufficient information and monitoring of energy; there is no adequate energy analysis and there are insufficiencies in the implementation of the management tools. They were not having EPIs and a base-line
They were not calibrating the instruments for energy measurement periodically
There are neither methodology nor criteria to assess energy consumption and they had not identified the variables that influence areas or SEnUs equipment
They had not identified their saving opportunities
They were not executing the internal auditing of energy resources
The acquisition of equipment and products was being made without establishing criteria to evaluating their use and efficiency during their useful life; there were no definite purchase specifications documented regarding energy. Investment procedures did not take into account the energy factor.
The specialists are not aware of the importance of the energy management system. Deficient staff training; there are no training program issues related to the proper use and consumption of energy
With the application of the EMM and EMA tools, see figure 1. As results only 34 % of the energy requirements for successful EnMs were being fulfilled. This confirmed the low level of energy management of the company presented.

Establishment of legal requirements
The scope of the EnMs in a first stage will cover the centers of transmission that have specialized personnel who work directly in the facilities. The application of the standard was limited to four Transmission Centers of Medium Wave (TCMW) and a Television Broadcast Center (TVBC). The responsibilities and functions of the top management were established, in addition, the members of the energy committee and the roles that they play were defined. Finally, the energy policy formally made up and approved by the stakeholders was:
The management of the company, aware of being a high consumer of electrical energy, committed to maximize its potential savings, rational and efficient use of energy carriers and the protection of the environment established the commitment of:
Ensuring the measurement of energy consumption and monitoring the energy performance of the organization.
Implementing energy strategies to continuously improve the energy performance of the organization.
Ensuring the availability of information and the resources needed to achieve the goals and targets defined in energy strategies.
Supporting the acquisition of energy-efficient products and services economically justified.
Ensuring the performance of the relevant legal requirements, as well as other requirements of the organization related to the use and consumption of energy.
Establishing training, diffusion and communication programs at all levels about the organization's energy policy.
Updating regularly the energy policy and communicating it to all staff to ensure their participation in improving energy performance
Nineteen rules were identified related to the legislation applicable in the country regarding the use and efficient consumption of energy establishing the legal requirements for the implementation of ISO 50001
Energy review stage.
Through an energy diagnosis, the opportunities to improve energy performance of those processes or equipment that consume energy were identified. The following information is useful to support this stage: general information about the company, energy bills and electricity consumption measurements; census of load or inventory of energy-consuming equipment; energy-productive diagrams of the different areas and processes; maintenance plan and finally handbooks and technical catalogs of the technology installed. The bills for the consumption of electric energy (kWh) and the data of production as a function of transmitted energy (kWh radiated) from 2013 to 2016 were analyzed. The key characteristics of the case studies corresponding to the year 2016 were summarized in table 1. It can be seen that the centers with mixed productions do not predominate, only in cases D and E which have low power transmitters in addition to their predominant production, and this depended on the needs of the territory. Center E shows the highest levels of electric power consumption; this is due to the presence of TV transmitters.
Table 1 General characteristics of the transmission centers
| Transmitters centers | Broadcasting power of radio (kW) | Broadcasting power of Tv (kW) | Production (kWh broadcasted/year) | Consumption (MWh/year) | Stratification of the electric- energy consumption by equipments of SEnUs (%) | |||
|---|---|---|---|---|---|---|---|---|
| AM | FM | TI | Cooling | Others | ||||
| TCMW A | 3 | 3 | 45 702.1 | 117.7 | 61 | 32 | 7 | |
| TCMW B | 10 | 86 926.3 | 124.8 | 73 | 15 | 12 | ||
| TCMW C | 20 | 173 396.7 | 247.6 | 67 | 25 | 8 | ||
| TCMW D | 20 | 0.25 | 0.3 | 178 768.7 | 355.2 | 70.5 | 26.3 | 3.1 |
| TVBC E | 0.25 | 8 | 56 194.3 | 249.5 | 62 | 37 | 1 | |
For the stratification of the electric energy consumption by equipment of SEnUs the power, time and use mode of the equipment was recorded. The equipment was classified in three main categories: IT equipment conformed by the transmitters, air conditioning equipment, and others including lighting, PCs, etc. A similar distribution is seen in the centers. For the detailed study of consumption patterns, the following graphs were elaborated: Annual graphs of electricity consumption during the day, dawn, peak and total; behavior of the maximum demand registered, comparison with the contractor as well as energy control charts, annual graphs of electricity consumption and kWh radiated.
The company is framed in the M1-A medium voltage tariff according to resolution No.28-2011. It was verified that the company was not penalized for exceeding the maximum demand contracted in the peak hours during the period. The demand for each center was follows: TCMW A: 30 kW; B: 30 kW; C: 37 kW; Center D: 45 kW and the TVBC E: 60 kW. When the graph of the behavior of the maximum demand registered and its comparison with the contracted were elaborated significant differences in relation to the real demand were detected. This phenomenon is present in cases A and B with 10 kW, 15 kW of over-sizing. Considering that the tariff includes the fixed cost amount for the maximum contracted demand power of 7 $ per kW per month, a readjustment of contracted demand estimates a saving opportunity for the company.
There is also a similar tendency in the consumption of electric energy during peak hours, day and dawn hours.
According to historical records it was detected that there are errors in the reading of the electrical records. The energy control chart does not reveal anomalies in the centers. The consumption remained stable within the established limits of +/- three times the standard deviation, but when these readings are combined with those of annual production, inconsistencies were detected in the production process, the consumption of electric energy and production of radiated kWh due to failures in the air conditioning system of these rooms. Similar deficiencies appear in the rest of the centers. It should be pointed out that this tool was useful in the monitoring of both variables and enabled visualizing the impact of the corrective measures applied in each center.
Recognition of the areas and SEnUs equipment. Identification of opportunities to improve energy performance
Thanks to the relative simplicity in the structure of these centers, in the initial characterization shown in Table 1 it was determined that the SEnUs were the IT equipment and the air conditioning system, in order to identify energy saving opportunities and improvement in energy performance. The saving measures in a transmission center must focus on the acquisition of high efficiency transmitters and the correct sizing of the cooling system. As the company does not have liquidity to assume investments related to the acquisition of more efficient transmitters, the study focused on analyzing the application of organizational actions that do not require investment. The cooling requirements of the rooms are closely related to the technical characteristics of the transmission equipment: η the efficiency of this equipment; PDC the electrical power they consume and PD, the power that dissipates in the form of heat that was calculated as expressed in equation (5), [23 ;24].
The efficiency of the AM transmitters according to the catalogs of the manufacturers are in the order of 80 and 86%, the TV transmitters between 13% and 17% [25, 26]. Besides, the established working temperature in these places was known and it must be sustained between 0-50oC. After obtaining measurements of the consumption for the transmitters by different premises, it was determined the different heat gains for the rest of the equipment and the construction characteristics by premises. The cooling load was calculated by the TRNSYS software. The results are shown in table 2, where the over-sizing of the installed load in all the centers is appreciated.
Table 2 Cooling capacity and theory capacity comparison
| Transmitters Centers | Cooling capacity (kW) | Dissipate heat (kJ/h) | Theory System capacity required + 20 % over-sizing (kW) |
|---|---|---|---|
| A | 35.14 | 10 800 | 5.27 |
| B | 14.06 | 21 600 | 8.79 |
| C | 24.60 | 53 280 | 12.3 |
| D | 49.20 | 56 160 | 14.06 |
| E | 52.72 | 77 760 | 21.09 |
Another way to verify this phenomenon was through the electrical measurements made to the air conditioning system by the premises. For example, the climate equipment installed at the TCMW D have a nominal electric power demand of 16.15 kW and figure 2, shows how the split equipment are only working to a maximum of 44.6% of capacity.
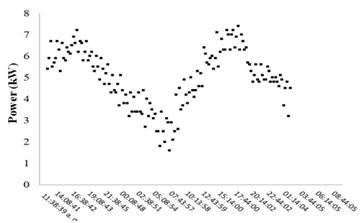
Table 3, summarizes the operation modes as well as the significant variable and control parameters that affect their operation and the potential savings of the measures proposed for the fulfillment of the energy saving goals. It was also considered the intermittency in television programming. As a whole, these measures will allow the company to save approximately 15 709 kW, which represents about 16% of annual consumption in 2015. From the economic point of view, this number represents 30 299 $ / year.
Table 3 SUEns summary
| Area or equipment | Function | Average consumption kWh/month | Control parameters | Saving measures | Potential Savings | |
|---|---|---|---|---|---|---|
| kWh/month | $/year | |||||
| Transmitters | Emitted electromagnetic waves |
A: 5 700 B: 7 661 C: 13 397 D: 14 361 E: 12 697 |
Connecting (On-Off) time (radio and TV programming) | (On-Off) time according radio and TV programming established | 3 840 | 7 008 |
| Air conditioners | Technological requirements for heat dissipation of transmitting equipment |
A: 2 990 B: 1 574 C: 4 999 D: 5 357 E :7 406 |
the thermostat’s setting filters cleanliness infiltrations control | Re-installing air conditioner equipment according to cooling load requirements | 11 869 | 21 091 |
| Public grid | demand contracted in the peak hours during the period | - | Readjustment of the cost for fixed fee | - | 1 600 | |
EPis and base-line
The expressions that define the baseline and goal in centers A, B and D are shown in table 4, The value of the energy not associated to the productive process and the coefficient of determination or quadratic coefficient of correlation (R2) show us the quality of the adjustment for the model to the experimental points. This model supports the use of ENPIS energy-productive kWh / kWh radiated. For TCMW C and D, the baseline was not established through the linear expression because of the low level of correlation.
Table 4 Outcomes of the planning process
| Transmitter center | Mathematical expressions | R2 | |
|---|---|---|---|
| A | Base-line |
|
0.84 |
| Goal-line |
|
0.90 | |
| B | Base-line |
|
0.79 |
| Goal-line |
|
0.82 | |
| E | Base-line |
|
0.89 |
| Goal-line |
|
0.92 | |
In the case of both centers it is observed that they have a range of consumption values for the same production value, see figure 3. This was given because in the case of the AM transmitters the electrical consumption depends on the depth of signal modulation [27].

The modulation depth of a 10 kW transmitter was in a range from 0 to 100% transmission and the consumption varied up to 7.8 kW of electrical power according to technical catalogs [28]. A normal audio program uses from 50 to 75% of modulation and it was established by technical standards of the country that was in a range of 80% up to 100%. Although the norm was applied in all the centers, the variation was notorious in those with the highest installed transmission power. Therefore, its ENPIs were measured through a limit of values to be met as shown in figure 4. Although the EPi is within the established range, it can be substantially improved decreasing the air conditioning load installed in them.

A summary of the behavior of the ENPIs it’s shown in table 5. The most efficient TCMWs currently are D and B. This comparative analysis allows the company's top management to prioritize those less efficient centers to implement the measures set out above.
Energy Control of and action plans
The monitoring of the ENPIs will be carried out through Excel files that incorporate other tools such as CUSUM, graphic ENPIs vs. Production and the EPI 100 BASE chart see figure 5.

Fig. 5 Tools for energy management control a) Results of EPI 100 BASE chart of transmitters centers TCMW A, TCMW B and TVBC E. b) results of CUSUM chart for TVBC E
After the base line's equation was obtained, see table 8, the graph EPI 100 BASE chart figure 5 a) revealed that for TCMW A in the last period the 42 % of their month measurements (energy consumption) were in the no-conformity zone, for TCMW B 68 % and 29% for TVBC E respectively. The CUSUM graph revealed that until July of 2015 the center TVBC E had a negative tendency to an inefficient period (over consumption) but as from the August 2015 until the last recorded measured (May 2016) the energy consumption was lower maintaining the similar levels of production (emitted hours). It’s important to highlight that those tools can be set to conform shorter time-lapses for example weeks or days, in order to improve and carry out a better monitoring of their EPIs.
The action plan derived from the energy planning phase complied with the company's energy policy, where the strategies, procedures and/or activities required to achieve the proposed goals were elaborated. Fitting the priorities defined, the corresponding improvement plans were designed using the 5Ws (What, Who, Why, Where, When) and 2Hs (How, How much) techniques [12]. It was recommended to the management team to make plans for staff training and to review in detail the description of the work content and the resources assigned to the energy specialists. Furthermore, they were advised to develop procedures for: capital investment to obtain funds for energy efficiency, carry out internal energy audits, maintenance that includes repair works to save energy, and a procedure that establishes the appropriate and systematic communication of the results to all the company workers.
CONCLUSIONS
The initial analysis made to the broadcasting company revealed that it has a low level of energy management. As a result of the implementation of the energy planning phase, the following were elements were established: the scope and limit of ISO 50001; the energy policy; the working group and functions applicable to senior management were defined; the legal requirements according to the legislation in the country; the main energy indicator was electric power. The SEnUs equipment comprises the transmitters and the air conditioning system.
The opportunities for improvement are concentrated in the readjustment of the air conditioning load installed in each center, the re-negotiation of the contracted demand and in the operating modes of the TV transmitters. All represent a total of $ 30,299 / year. The ENPIs were established taking into account the characteristics of each location as well as the baseline and goals of centers A, B and E. Finally, The ENPIs comparison will allow to prioritize the application of measures for energy saving.

