INTRODUCTION
For twenty years, the increasingly growing interest in the reality of climate change remains a broadly shared concern (reduction in rainfall, temperature increase, greenhouse, etc.). In Africa particularly, the reality of climate change is largely associeted with a drastic decline in rainfall which is the main climate factor as identified in several studies (Hubert et al. 1989; Mahe and Olivry 1995; Bricquet et al. 1997; Servat et al. 1999). This decline in rainfall has had several consequences, often dramatic (drought in the years of 1970 and 1980, 1984 and 2006 in several countries of West Africa).
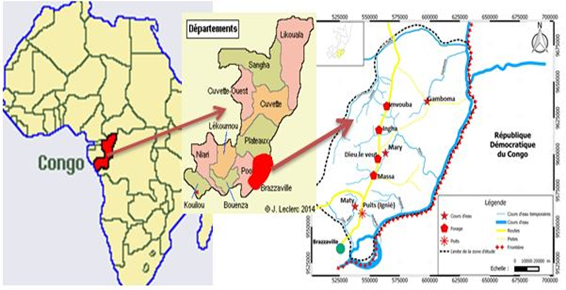
In Congo - Brazzaville, the Mbé plateau (Figure 1), the water issue was raised long time ago, both quantitatively and qualitatively, given the lack of water points in the area, poor water quality and in many cases, its drying during the dryseason (Le Marechal 1966). Several works stress this situation: Sautter (1952, 1953); Hudeley (1952); Archambault (1960); Palausi (1960); Mermollod (1961) concern for the availability of water for domestic and agricultural uses. There have been very little studies on several aspects in territory. Only the hydrochemical part of this area has been recently studied (Obami-Ondon et al. 2018). For sure, there is no comprehensive study on the impact of the seasonal variability of rainfall on the waters of Mbé tray. It is therefore appropriate to characterize these waters according to the seasons, to study its water resources on impact which may differ from one season to another.
The scarcity of surface water and the unsustainability of this resource on the surface of Mbé plateau is due to geological conditions that favored the use of the deep aquifer as a palliative to meet the needs of the populations. Indeed, training infiltration capacity at the outcrop are high. These formations are constituted by a series of essentially sand and sandstone formation aquifer which contains a deep groundwater. This ply is largely driven by the infiltration of rainwater into the ground. Currently, many traders have undertaken various activities (farming, agriculture, food industry, etc.) on this plateau.
MATERIALS AND EXPERIMENTAL METHOD
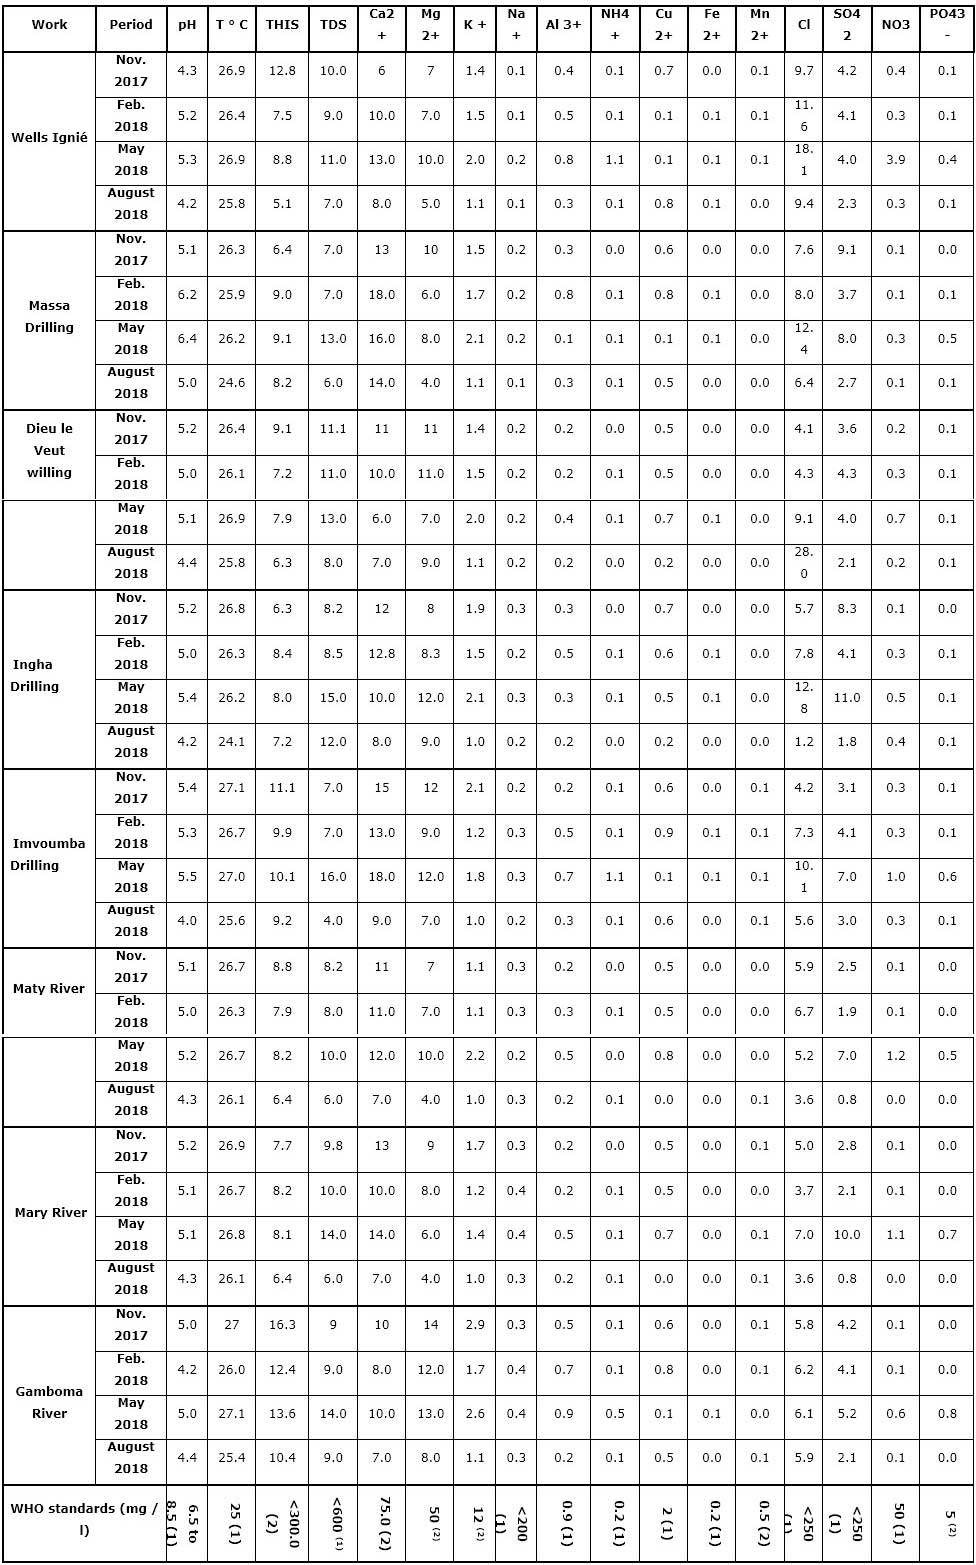
The eight samples of water points (1 well, 4 drillings, 3 rivers) were collected for four seasons. They were located by their geographic coordinates using GPS and 120 samples were collected for analyzes physicochemical between November 2017 and May 2018 (Figure 1). The samples were taken and put into vials of 1,5 liter polyethylene specially prepared for this purpose. Samples for the exploited wells with valves were made after the water run into space for several minutes. Filling before sample bottles were rinsed several times with water to collect before being filled and then immediately stored at 4 °C in a cooler with ice. The analysis was done quickly, within 24 hours after collection. Analyzing these physical elements, major and trace some heavy metals was performed in the laboratory of IRSEN using a spectrophotometer using conventional methods advocated by French standards (AFNOR). A comparison of the levels of physical and chemical elements of the water (Table 1) depending on the season and standards of the World Health Organization (WHO 2004, 2017) were performed. Then, a geochemical study was conducted using diagrams. The analyzes were controlled by the ionic balance to ensure the reliability of the results. A comparison of the levels of physical and chemical elements of the water depending on the season and standards of the WHO were performed. Then, a geochemical study was conducted using diagrams.
RESULTS AND DISCUSSION
Fluctuating monthly average interannual rainfall between 1987-2018
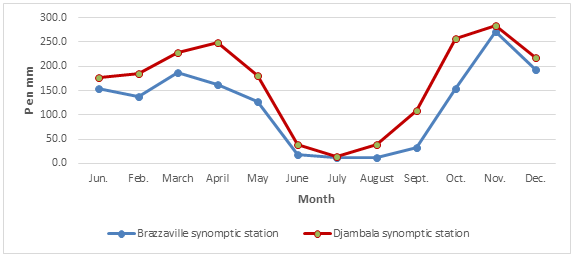
The change in rainfall indices of the study area is represented for the synoptic stations Brazzaville Djambala (Figure 2). The analysis of the evolution of rainfall indices shows a rainy period (September-May) 9 months with a slowdown rains (mid-January-February) and a dry season of 3 months (June-August).
Results of laboratory measurements
The results of physicochemical surface water and groundwater of Mbé plateau measured in the laboratory (see Appendix).
In this table, except pH, at 25 °C (µS/cm), T (°C) and all other parameters are expressed as mg/L.
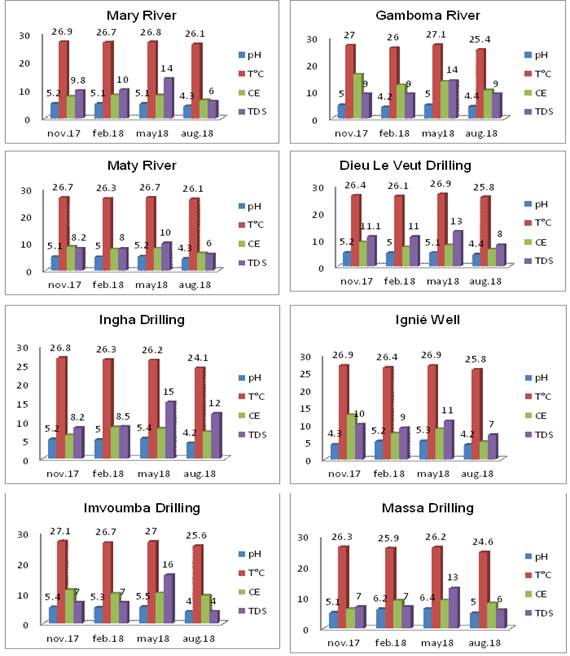
The variation of the physical parameters (pH, T °C, CE and TDS) of 8 points taken is shown in Figure 3. The analysis of the evolution of the physical parameters (Figure 3) depending on the seasonal variability (Figure 2), does not shows such a result this variability. For consecuence, the temperature seems to diminish on all points sampled in August. However, TDS show an increase in all items during the campaign in May. But the values remain below the standards set by the WHO for drinking water. We also note that the pH is experiencing dynamic (decrease from May to August) little significant throughout the study area. Drawing from our findings, we can say that the seasonal variability does not directly affect the physical parameters of the waters of the region. These results are consistent with those of Obami-Ondon et al. (2018) obtained during the rainy season.
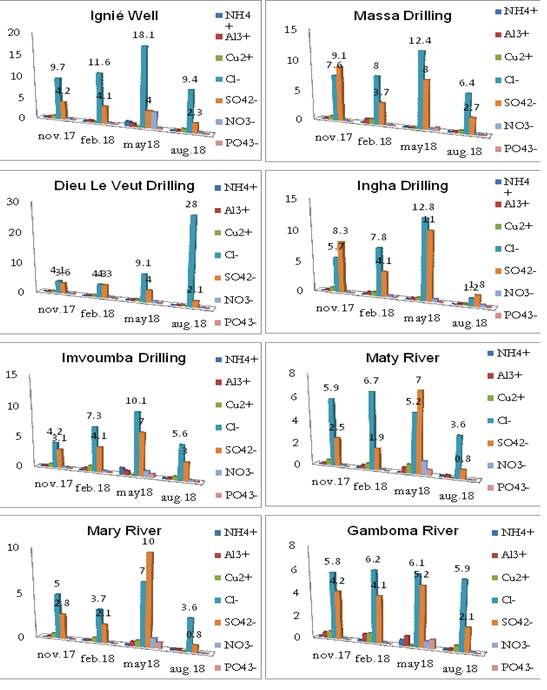
Among the studied metals and pollutants (Figure 4), we note that all metals are virtually nonexistent. As against the Cl- and SO4 -2, although the values are lower than those prescribed by WHO, are exceptionally dynamic at all points during the campaign in May. This variation is due to the transfer time of rainwater in the web. That same month, TDS (Figure 3) are also known an evolution in all water points of the study area.
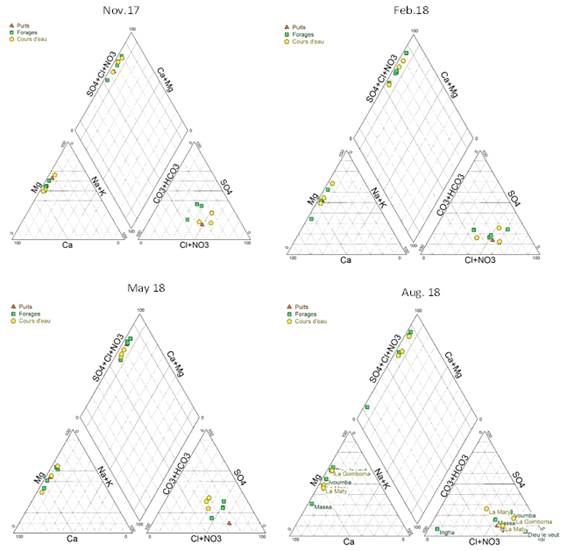
It follows from the projection campaign results, one only facies Piper diagram is shown (Figure 5): Facies chlorinated lime. However, the campaign of August 2018 (dry season) proved to be different by presenting two facies include: calcium chloride-Facies and Facies calcium bicarbonate. This second facies is marked by the drilling Massa that deviates from the other. It is noted that, in the triangle cations, the same drill village Massa moves away from the others, this would certainly due to human activities around this drill because it is in a farm.
In general, Mbé shelf waters are chlorinated calcium during the four seasons and do not present a significant hydrochemical dynamics.
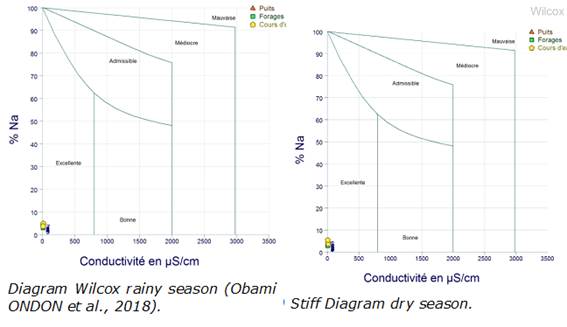
Within the potability of the waters of the region, 120 samples shown in the diagram Wilcox (Figure 6) are included placed into one single group (Excellent) in rainy season as the dry season.
CONCLUSION
This study made it possible to characterize the physico-chemical parameters by following the seasonal variability of the region. It revealed that all the parameters measured during the four seasons are all in conformity with the WHO standards for drinking water and do not show a variation corresponding to the seasonal variation. However, surface and groundwater temperatures are between 24,1 °C and 27,1 °C, and do not present a particular dynamic depending on the season; these temperatures are close to those recommended by WHO. They are acidic with pH values between 4,02 and 6,4 and are therefore aggressive. As for the electrical conductivity values, they vary from 5,14 μS/cm to 16,3 μS/cm. This is reflecting the low mineralization of the waters in the area in which we conducted our study, and the low local indices of contamination by human activities.


