INTRODUCTION
The tapes are flexible pipes, capable of taking a flat shape, provided with emission points at variable distances and consisting of two parallel conduits, a principal conduit from which the water passes to the secondary through a hole that causes a first loss of load and a secondary one from which the water exits outdoors (Ucker et al., 2013; Carmenates, et al., 2017). The irrigation pipes or tapes conduct and apply the water simultaneously through holes made in the manufacturing process (Carmenates- et al., 2017). They are normally made of polyethylene (PE) and are usually used in crops with very narrow planting frames that require a high density of emitters or in line crops, with the purpose of creating a continuous moisture band (FAO, 2013; Carmenates et al., 2014). The drip systems have numerous benefits among which are: greater uniformity and high production, integrated emitters, each dropper outlet is part of an emitter that emits a flow without jets, provide water efficiency in the root zone, saving of water and energy, reduce water consumption and reduce energy costs, saving on crop protection products, eliminating stagnant water that reduces diseases and weeds, efficient labor savings, less soil compaction and dry furrows that improve access to the field (Vélez et al., 2013; Valipour, 2014; Carmenates, et al., 2017). The objective of this work is to carry out a comparative study of two models of self-compensating and non-compensating Aqua Traxx irrigation tapes.
METHODS
The research was carried out at the University of Ciego de Ávila and in areas of the Agroindustrial Company of Ceballos, in the cultivation of guava in a typical Red Ferrallitic soil. The tapes used were the existing models in the company Aqua Traxx self-compensating (A1) and non-compensating Aqua traxx (A2), which were acquired from foreign firms that commercialize components of irrigation systems. The samples of the irrigation pipes used were obtained from a universe of 500 emitters for each model, choosing 20 emitters of each tape model. The methodology used for the evaluation of irrigation pipes was based fundamentally on the recommendations specified in the Mexican standard (IMTA.MX, 2003).
TABLE 1 Hydraulic characteristics of the evaluated tape models
| No. | Manufacturer | ModeL | Flow | Rate (L/h) | Diameter of the nozzles (mm) | Compensation Range kPa | Spacing between droppers (EEG) (cm) |
|---|---|---|---|---|---|---|---|
| 4 | Mondragón | Aqua Traxx 1 | AC | 1.02 | 1.578 | 70-175 | 0.80 |
| 5 | Mondragón | Aqua Traxx 2 | NC | 1.14 | 1.327 | 0.80 |
Determination of the Flow Variation due to the Temperature of the Irrigation Pipes
This test was carried out by measuring three times the discharge of each of the emitters selected at random with the numbers 3, 12, 13 and 23, according to Bralts (2010), at different water temperatures in a range of 7-55oC and to the nominal pressure of each dropper, in the case of non-compensated drippers and in the middle of the regulation interval in the case of self-compensating drippers. To obtain water temperatures higher than the ambient temperature, a commercial heater was used connected at the entrance of the test facility main piping. The temperature of the water was measured with thermometers in the cistern that supplies the water tank and at the entrance of the side. The temperature difference between these readings should not exceed 20C. To determine the quality of the pipes the Mexican norm IMTA.MX (2003) was used.
Determination of the Spacing between Emitters or Emission Points according to the Standard (ISO. 9260: 91, 1991).
The sample unit is five linear meters (m) of irrigation pipe or tape. For the case of the emitters of the Aqua Traxx tape, models A1 compensated and A2 non-compensated, the spacing between emitters is 0.80m. To determine the wall thickness of the irrigation pipe or tape by the aforementioned Standard (ISO. 9260: 91, 1991) was used.
Determination of the Manufacturing Variation Coefficient (CVF) of the Pipes
For the measurement of flow uniformity, a stretch of tape with 20 emission points was selected. In the case of the self-compensating tape, the following procedure was followed: The test line was subjected 3 times to a pressure close to the maximum operating pressure, for 3 minutes and at a minimum pressure for the same time. The emission points were measured at a pressure equal to the midpoint of the regulation range. Finally, when the test pressure stabilized (after 3 minutes), the measurement of the emission flows of the irrigation pipe was carried out, registering each point separately. In the case of the non-compensated irrigation tape, the following procedure was followed: As it does not require a previous conditioning, it was only brought to the nominal pressure specified by the manufacturer. Then the flows were measured and each point was recorded separately. For both types of irrigation tape, the evaluations were made with a water temperature of 23 0C _ + 1 0C.
Determination of the Flow versus Pressure Curve (q = f (h))
At random, 25% of the emitters of the sample obtained were taken, identifying each of them. Those selected on the pipe were tested at different pressures within a range of 0 to 1.2 times the maximum pressure (pmax), the self-compensating emitters were operated within the amplitude of regulation, increasing or decreasing the inlet pressure. The curve was constructed (q = f (h)).
RESULTS AND DISCUSSION
Determination of the Quality of Irrigation Pipes
In Table 3, the results obtained from the spacing between emitters of the irrigation pipes and their comparison with the values offered by the manufacturers are presented. The models evaluated were the following: Aqua Traxx and their respective models evaluated (A1) self-compensating and (A2) not self-compensating.
TABLE 3 Spacing between the emitters of the irrigation pipes
| Model | Spacing of the manufacturer (m.10)-2 | Measured spacing (m.10)-2 | Percentage difference |
|---|---|---|---|
| A1 | 20 | 20.52 | 2.6 |
| A2 | 10 | 10.64 | 6.4 |
In Table 4, the results of the wall thickness measurement of the irrigation pipes studied are shown. The models measured comply with the standard, that is, they present a difference of less than 10% of that reported in the catalogs by the manufacturers.
TABLE 4 Wall thickness by model of irrigation pipes
| Model | Thickness according to manufacturer (m x 10-2) | Measured thickness (m x 10-2) | Percentage difference |
|---|---|---|---|
| A1 | 152.4 | 154.98 | 1.7 |
| A2 | 381 | 385.78 | 1.2 |
In Table 5, the range of critical values of the deviation of the flow rate of the irrigation belts evaluated with respect to the nominal flow rate (qn) according to (ISO. 9260: 91, 1991) are shown. As it can be seen, the Aqua Traxx compensated model pipe is of category A, according to the deviation of the flow with respect to the nominal flow (qn) and the non-compensate Aqua Traxx pipe, did not obtain any category according to this standard, since its deviation exceeds 10%. The models comply with ISO 9260 according to Bralts et al. (1981). These results coincide with those obtained by Levien & Figueirêdo (2013), Ouazaa et al. (2013) and González et al.(2014).
TABLE 5 Critical values of deviation of the average flow of the pipes with respect to the nominal flow, according to the ISO9260 standard
| No. | Irrigation pipe | qn10% L/h | qn5% L/h | Nominal flow L/h | qn5% L/h | qn10% L/h | Classification according to norm ISO9260 |
|---|---|---|---|---|---|---|---|
| 1 | Aqua Traxx PC (A1) | 0.918 | 0.969 | 1.021 | 1.072 | 1.123 | Category A |
| 2 | Aqua Traxx NC (A2) | 1.026 | 1.083 | 1.14 | 1.197 | 1.254 | Without category |
Determination of the Coefficient of Variation of Manufacture and Variation of the Flow in the Irrigation Pipes
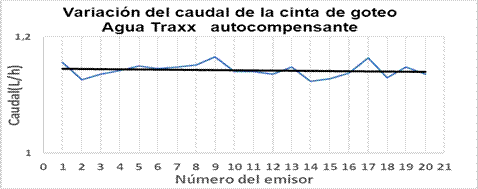
Figures 1 and 2 show the distribution of flow rates in the test pipe of the irrigation tapes, Aqua Traxx, model A1 and A2. For the case of Aqua Traxx irrigation pipe or tape, they are presented, in Figure 1, for the self-compensating and in Figure 2, for non-compensating models. When analyzing the obtained data it is observed that the Aqua Traxx pipeline or irrigation tape model (A2) non self-compensate shows the greatest dispersion of flows in the test line, which gives it the highest value of the coefficient of variation of manufacturing compared to the self-compensating Aqua Traxx pipe or pipe model (A1) whose flow variations can be classified as much lower compared to the A2 model. It is important to point out that the two values of the manufacturing variation coefficient of the Aqua Traxx compensated (1.02%) and non-compensated (4.46%) pipes belong to category A of ISO9260 according to Nakayama and Bucks,(1991) and its category is good according to the Standard ISO. 9260: 91 (1991). However, the A1 model has a lower manufacturing variation coefficient than the A2 model and is, therefore, of better quality.

FIGURE 1 Distribution of flows in test line belonging to the Aqua Traxx irrigation pipe (model A1) self-compensating (68.966 -172.416 kPa), nominal flow rate (qn = 1.021 L / h).
Determination of the Flow-Pressure Curve
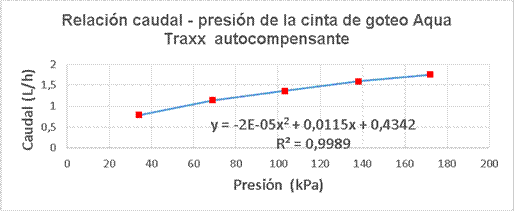
In Figures 3 and 4, the variation of the flow-pressure curve of the irrigation pipes of the compensating and non-compensating models, when subjected to different pressures are shown. Figure 3 shows the flow-pressure ratio of the Aqua Traxx self-compensating model, which has a nominal flow rate of 1.021L / h and a compensation range of 68. -172.416 kPa. In the figure, there is a strong relationship between flow and pressure, which is evidenced by the correlation coefficient obtained, that reached a value of 0.9989. It can be pointed out that, the variations obtained in the flow rates when the pressure changes, vary from the parameters given by the manufacturer according to the nominal flow rate of this model.
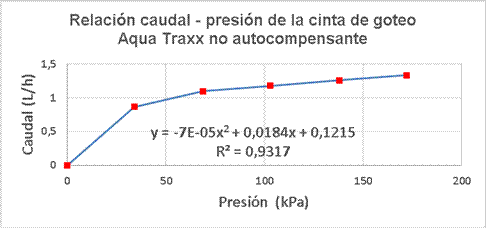
In Figure 4, it is shown the flow-pressure ratio of the Aqua Traxx non-self-compensating pipe, which has a nominal flow rate of 1.14 L / h and a nominal pressure of 68.966 kPa. In the figure, it can also be observed, a strong relationship between flow and pressure, which is evidenced by the correlation coefficient obtained that reached a value of 0.9317. In the irrigation tapes or pipes compensating and non-compensatin models, the equation that shows the behavior of the flow - pressure curve obtained experimentally in this investigation are of the polynomial type of the form: y = ax2 + bx + c. It is shown in the cited figures the high correlation coefficients for the A1 model of 99% and for the A2 model of 93%.
Determination of the Flow Variation due to the Temperature Variations
In Figure 5, it is shown the behavior of the flow temperature curve of the Aqua Traxx irrigation pipes, both compensated and non-compensated models, which respond to a linear behavior in their flow variation according to different temperatures. In the case of irrigation pipes, the highest values of the slope of the curve are obtained and, therefore, a greater sensitivity of the flow to the temperature for the compensated model. This is because the material of the resilient type that presents the elastomer that provides the self-compensating feature to the Aqua Traxx A1 tape, expands more easily due to the increase in water temperature, blocking the passage of this and compensating with this, the increase of the flow due to the lower viscosity of the liquid. These results coincide with those obtained by Bralts (2010) where he found that the increase in temperature decreases the kinematic viscosity of the water and increases the Reynolds number. As a result, the Darcy-Weisbach coefficient decreases and the flow increases.
CONCLUSIONS
With the study carried out, it was shown that the self-compensating Aqua Traxx pipe showed less variation of the flow than the non-compensating one, proving to be the best quality model.
In the flow-pressure ratio, correlation coefficients greater than 90% were obtained for both pipe models, obtaining polynomial equations under conditions for experimental conditions of the form y=ax2+bx+c.
In the determination of the flow variation due to the water temperature of the evaluated pipe models, the self-compensating model showed greater sensitivity of the flow to the water temperature.


 texto en


