


 Servicios personalizados
 texto en
  Inglés (pdf)
 Articulo en XML
 Referencias del artículo
 Enviar articulo por email
 Citado por SciELO
  Similares en
SciELO
Similares en
SciELO 
 Permalink
Due to its productivity, the bubaline species is becoming an important alternative to achieve profitable production and reproduction in marginal areas, where the buffalo, due to its physiology, survives and produces. The commercial exploitation of buffalo cannot and does not intend to compete with that of cattle, but represents a valid alternative for certain fields with ecosystems such as those mentioned above (Crudeli 2011).
Warriach et al. (2015) have referred to the importance of knowing the reproductive performance of buffaloes and their interest in genetic improvement. These authors have indicated where to direct future researches based on these indicators.
In Cuba, to the east of Mayabeque province is the Empresa Pecuaria Genética del Este, which started its activity with this species in 2000. At present, this enterprise has a bubaline farm with nine dairies, whose production is marketed at the dairy industry.
The reproductive information of these herds has not been studied yet, so the objective of this study was to determine the performance of the main reproductive indicators of the enterprise bubaline herd and estimate the influence exerted on them some environmental effects, as the herd, parturition year, time and number of parturition.
Materials and Methods
The data was collected from the master cards of the Technical Control Department of a bubaline farm, subordinated to the Empresa Pecuaria Genética (EPG) of the East, in Madruga municipality, belonging to the Ministry of Agriculture. Subsequently, a database of 1905 observations was drawn up, imported into the statistical package SAS Institute Inc. (2013, version 9.3), to perform the statistical analysis. For the data cleaning, the observations that did not biologically comply with the possible values of the indicators under study were eliminated.
T he re wa s i nform a t i on of ni ne he rds, wi t h approximately 30 female buffaloes and one sire per herd in direct mating. At eight months, when the pregnancy was confirmed, the pregnant females were separated and formed another group in the same herd. After parturition, they were treated with veterinary treatment to prevent possible complications during the puerperium and were incorporated into the milking at 10 d postpartum.
The feeding was based on grasses such as the Hemp- agrimony (Eupatorium cannabinum) and the pangola grasss (Digitaria decumbens). The paddocks also had a large infestation of aroma (Acacia farnesiana) and marabou (Dechrostachys cinerea). The grazing was done in the morning, after finishing the milking, until the afternoon. The animals always had access to water and were not supplemented with concentrate.
Calculation of the indicators. The indicator parturition- parturition period (PPP) was calculated from the differences between the parturition dates and the service period (SP). This was determined from the parturition-parturition period, to which the duration of gestation was subtracted, considered fixed with 304 d. The incorporation age (INCA) was obtained from the difference between the incorporation date and the date of birth. The incorporation weight (INCW) was obtained with the use of a tape measure and the age at first parturition (AFP) by the difference between the date of the first parturition and the birth date of each female buffalo.
Used models. For the statistical analysis of the indicators parturition -parturition period and service period, the herd, year and season of parturition were taken into account as fixed effects. As random, the effect of the animal nested in the herd where it is located was considered. For the statistical analysis, the parturition number (1-5) was considered as a covariate and the following mathematical model was applied:
where:
Yijklm= represents the mth observation of the variables PPP and SP.
X= parturition number (m=1,…,5).
β= Covariate of the mth parturition number (m=1,..5)
In the case of the indicators incorporation weight, incorporation age and age at first parturition, only the herd effect was contemplated in the mathematical model, since these indicators are previous to parturition. For the statistical analysis, the following mathematical model was considered:
where:
The dispersion statistics (mean, standard deviation and coefficient of variation), number of observations and normality test of the variables were analyzed using SAS INSIGHT. It was proceeded to use the generalized mixed linear models (Wolfinger and O'connell 1993) using the SAS GLIMMIX procedure, version 9.3 (SAS Institute Inc. 2013), because the measures evaluated did not fulfill with the fitted normality test. Gamma distribution and link log were used in the procedure used. The differences between means were established by Kramer (1956) test.
Results and Discussion
Table 1 shows the number of observations, as well as some dispersion statistics for the indicators under study (PPP, SP, INCW, INCA, and AFP).
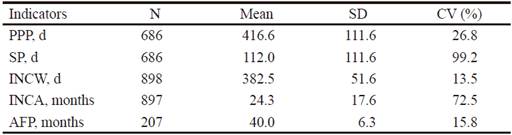
The higher standard deviation (SD) was observed in the PPP and SP, although the SP was the one with the highest CV (%). This is attributed to that artificial insemination is not available, it does not have the exact date on which the conception occurred and it was obtained on predetermined values.
The parturition- parturition period showed duration longer than that obtained by Ceró et al. (2013) in the Empresa Genética Maraguán, Camagüey province, in Cuba. These authors reported PPP of 389.2 d. and it also exceeded the result of Padrón et al. (2010), who reported values of 367.3 to 416.5 d, under similar breeding conditions in another livestock enterprise in Mayabeque province. In an experimental herd, Fundora (2015) reported a PPP duration of 372.8 d.
The SP, INCW, INCA and AFP showed better performance if are compared with that obtained by Hernández et al. (2010) in buffaloes herds from the central region of Cuba, who reported 227.05 d, 284 kg, 26.78 months and 44.30 months, respectively. Fundora (2015) referred duration of 52 d for the SP.
Lower results for age at first parturition reported Vergara et al. (2010), with values of 1140 ± 283.5 d (38 months), considered of great importance because the more precocious the animal is, the more it can produce during its reproductive life. García et al. (2006) affirmed that lower ages of female buffaloes at first parturition reduce the generational interval, while shorter service periods and lower parturition- parturition period offer a greater number of buffalo calves.
If a comparison of the results of this study with those established by Mitat et al. (2010) for Cuba is carried out, it can be affirmed that generally the indicators PPI, INCW and INCA coincide with those of this study.
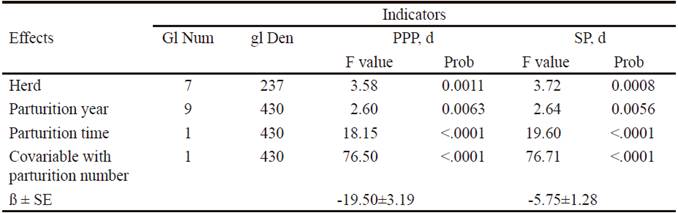
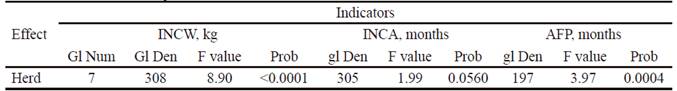
Tables 2 and 3 show the results corresponding to the analysis of variance of the evaluated indicators. The herd effect was significant for the PPP, SP, INCW and AFP, while the parturition year influenced on the PPP and SP. The same happened for the effect of the parturition time.
The effect of the parturition number in the variables PPP and SP was significant. This shows the importance of the variations in the parturition number for the reproductive measures evaluated, and shows that the increase in the parturition number is accompanied by reductions in these indicators of almost 20 and 5 d respectively, for each unit of increase in the parturition number.
Many of the studies carried out in Cuba and Latin America corroborate the influence of the parturition number and parturition season on the reproductive performance in the bubaline species (Ceró et al. 2013).
According to Mitat (2008), several factors have affected these indicators and, in particular, the herd, which has a significant influence. This is determined, mainly, by the differences between the herds by management and feeding. Fraga and Ramos (2010), Suárez and Ramos (2011) and Ceró et al. (2015) reported that the effect of the herd is determinant on the reproductive performance, due to the variations of feeding and climatic conditions of each region in which the herds are located.
Table 4 shows that the lowest values of PPP were in herds 212 and 213, although there were no statistical differences with respect to herds 201, 209 and 210. It was not the case of the herd 202, which presented the highest value of this indicator, although there were no differences of this herd with respect to 199, 200, 201 and 210.
Table 4 Herd effect on PPP, SP, INCW and AFP
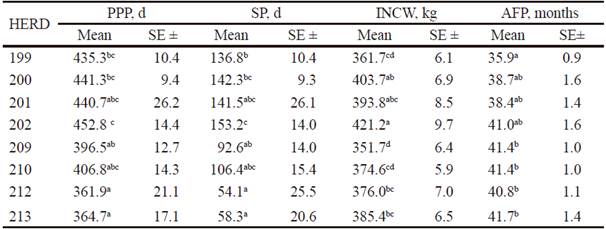
abc Means with different superscripts in the same column differ at P ˂ 0.05 according to Kramer (1956)
For the SP, there was similar performance to that of the PPP. The highest value was in herd 202, although this did not show differences with the herds 200, 201 and 210. The lowest values were in herds 212 and 213, without differences with respect to 201, 209 and 210. For the INCW indicator, the best value was in the herd 202 although there were not significant differences in comparison with herds 200 and 201. The lowest values were in herd 209, without differences with respect to herds 199 and 210. Regarding the AFP, the best values were in herd 199. Between the herd 200, 201 and 202 there were no differences. The least desirable values were in herd 209, 210, 212 and 213, which did not show differences with respect to herd 200, 201 and 202. However, in comparison with herd 199 there were differences between 5 and 5.5 months.
Among the factors that can affect the differences between herds and parturition years of the reproductive indicators considered, can be found those of genetic origin and others related to non-genetic effects (Ceró et al. 2013 and Fundora 2015).
Table 5 shows that the best parturition years for the PPP were 2004 and 2007. The worst year was 2013 with a significant difference of 67 d. The rest of the years did not differ from the extremes, since they reached intermediate values. There was an increase from 2007, possibly due to the gradual incorporation of some animals that, due to their characteristics of longevity and considerable decrease in production, were exclusively dedicated to the breeding of their buffalo calves. Something similar happened with the SP, which explains what happened at the PPP level.
Table 5 Effect of parturition year on the PPP and SP
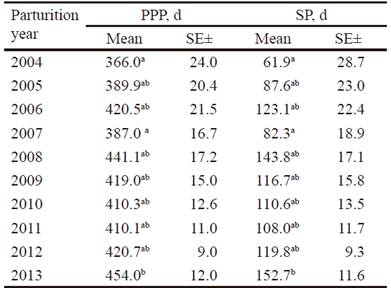
abcMeans with different superscripts in the same column differ at P ˂ 0.05 according to Kramer (1956)
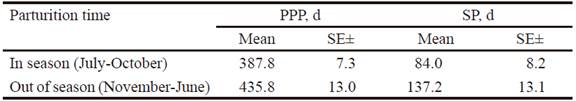
The results of table 6 show that the parturitions that occurred in the July-October period had an improvement on the evaluated indicators, as there was a reduction in the duration of the indicators PPP and SP of 48 and 53.2 d, respectively. García et al. (2007) also found this difference between periods. These authors stated that the season of the year in which the parturition occurs has an important effect on the production of female buffaloes milk and on reproductive performance, due to the greater availability of grasses.
The differences found in this study for the PPP indicator are higher than those reported by Ceró et al. (2013), of 24.9 days (dry season 402.3 ± 9.7 and rainy season 377.4 ± 6.4 days). In the eastern region, values of 429 d were reported for PPP, when parturition occurs in the rainy season and 431 d, when it occurs in the dry season (Almaguer et al. 2015).
Conclusions
The parturition year 2013 had a higher PPP value than in 2007, which should serve as a reference so that there are no increases in this indicator. The values of herds 212 and 213 should be taken as a reference to improve the performance of the rest of the indicators. The incorporation weight and the age at first parturition were the best in herds 202 and 199, respectively. In other studies, the causes that determined these results must be evaluated in detail. The incidence of parturitions in the July- October period improved the reproductive indicators, according to what was found in previous studies. It should work to ensure that future parturitions occur mostly during this period.

