Introduction
Nitrates constitute one of the monitored water pollutants due to its harmful effects on human health.1-3 The classical determination of this ion can be carried out by methods such as UV-Visible spectrophotometry, ion chromatography, among others.4-6 These methods, in addition to requiring sample treatment, are quite laborious, so they require time and can also be expensive. The determination can be carried out more easily by means of the potentiometric method, using ion selective electrodes (ISE). The ion selective electrode has many advantages such as speed of determination, simplicity of measurements, allows determinations to be made in the field of sampling, easy elimination of chloride ion interference at low nitrate concentration by using ISA -Pb n 7) or ISA-Ag solutions. In addition, determinations are possible in small sample volumes and the measurements are unaffected by sample color, turbidity, suspended matter, or viscosity, and do not require expensive equipment.8-15
Due to these advantages and the need for monitoring, there are many works reported by researchers on the characterization of new ISEs for nitrate 16-26) using membranes with various ionophores and plasticizers. However, in these works, only the confidence interval of the slope is reported and not the measurement uncertainty as a criterion of metrological quality of the sensing membrane. Currently, this statistical parameter plays a fundamental role in the interpretation of the analytical result since it allows a high degree of confidence to find the range of probable results of a measurement, thus ensuring the quality of the analysis. For testing laboratories and services such as the UEB Laboratory of Empresa Geominera Oriente, guaranteeing this performance parameter means having a strong mathematical tool in the evaluation of their results, thus providing clear and concise information to their clients.
For this reason, in this work, nitrate was determined in real samples by using a new ISE polymeric liquid membrane with the quaternary salt trioctylmethylammonium chloride (TOMACl) as ionophore, diethylphthalate (DEP) as a plasticizer in a polyvinylchloride (PVC) matrix on a conductive support.
Materials and methods
All the reagents used, both in the preparation of the polymeric membrane and in the evaluation of the electrodes were analytical grade. The epoxyconductive resin was prepared by mixing Araldite M and HR Hardener from Gigas-Geiggy and graphite powder was from Merck. All the salts used in the study of the ISEs were oven dried at 110 ºC and cooled before weighing using a Sartorius digital scale. A digital pH-Meter from Fisher and micropipette (10-50 µL) from Hirschmann were used. The solutions to be measured were stirred with a Jenway-1000 magnetic stirrer.
The reference electrode used to measure the potential differences corresponds to a double junction Ag/AgCl electrode (HI 5311). As an internal reference, solution one supplied by the same brand has been used. For the external compartment a solution of 0,1 mol ∙ L-1 of K2SO4 was used.
The indicator electrode used was a built-in liquid membrane nitrate selective electrode (ISE) composed of trioctylmethylammonium chloride (TOMACl) as ionophore, polyvinylchloride (PVC) as the matrix and diethylphthalate (DEP) as plasticizer.
The composition of the electrochemical cell is as follows:
Ag/AgCl|KCl0,1 mol ∙ L-1|K2SO40,1 mol ∙ L-1||Invest.Sol.||PVC memb.|cond. support| Cu(s)
The composition of the membrane was: Ionophore 7 %, Mediating solvent 64 % and Matrix 29 %.
The preparation of the electrode body and the subsequent application of the membrane have been carried out in a similar way to the method used in the construction of the "all-solid-state" ion-selective electrodes.27
The method of known additions 27 was followed for the calibration of the electrodes, determining the activity of the main ion by the Debye-Hückel equation (equation 1).
Once the calibration of the electrodes is finished, the graphical representation of the potential values against the log aA allows to obtain the calibration curve of the electrode and from the subsequent calibrations the calibration parameters can be calculated, these are: Slope of the line (S), Lower Linear Response Limit (LLRL) and Practical Detection Limit (PDL).
Determination of uncertainty
The expanded measurement uncertainty was calculated according to the method established in the specialized literature, applying the methodology described in the measurement uncertainty guide (UMG) 28-33 for its acronym in English, where the first thing to do is identification of the measurand, in this case it corresponds to the nitrate ion in natural waters. Then the possible sources of uncertainty that contribute to the analysis are identified and quantified, then it is taken to a mathematical model where the combined uncertainty of the measurement is calculated as the root square of the sum of the squares of the calculated typical uncertainties (equation 2).
For this study the combined uncertainty was calculated as follows:
Being  the absolute combined uncertainty of nitrate ions expressed in mg · L-1.
Where,  is the standard uncertainty associated with the estimated precision (intermediate precision), where intervenes the variability associated with the random errors of the analysis was calculated as the square root of the sum of the squares of the uncertainty associated with a series of n content replicates of the analyte in high and low concentrations and the uncertainty associated with duplicate levels of content of the analyte of interest, using the same method, in the same laboratory and the same analyst in one week of study.
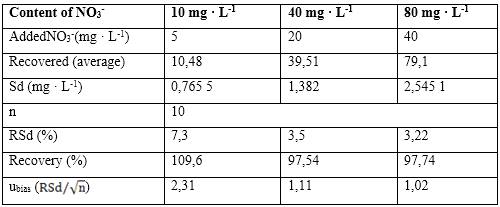
 : This uncertainty was quantified from recovery tests at three concentration levels, where the student's t-statistic was chosen as criterion for the acceptance percentage of recovery.
 : The uncertainty of the calibration curve was calculated as the square root of the sum of the squares of the standard deviation developed by the slope and the intercept.
 : The uncertainty of the response potential was quantified considering the repeatability of the measurements of the equipment, the resolution reported by the manufacturer and the rounding of the significance numbers.
 : is the uncertainty associated with routine analysis according to the method.
Includes the uncertainty associated with the preparation of the standard and the interference suppressor, tolerances of pipettes, volumetric, scales, molar masses, etc. In this source of uncertainty, it was decided to group all the components that contribute in a minor amount to the mathematical weight of the combined uncertainty in the determination of the measured.28
Results and discussion
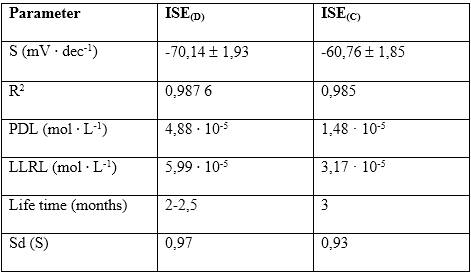
Table 1 shows the average of the characteristic response parameters of the ISEs developed in this study together with the results of a commercial ISE to nitrate ORION 9700BNWP, USA. As observed, the value of the slope of the developed ISE is over-Nernstian (-70,14 ( 1,93 mV ∙ dec-1), indicating that the prepared membrane is very sensitive to the primary ion.
ISE(D): Developed ISE, ISE(C): Commercial ISE
An Analysis of Variance (ANOVA) was performed to compare the slopes of the three ISEs. The results are shown in table 2. Before the comparison, a contrast was performed to verify if there was homogeneity between the variances. The p-value of the Levene test was 0,922 9 by considering that it is higher than the significance level (α = 0,05), there are no statistically significant differences between the variances for a confidence level of 95 %.
Table 2 Analysis of variance performed on ISEs

S.S.: Sum of squares, D.F.: Degrees of freedom, H.F.: Half square
As can be seen in the ANOVA table, the p-Value is greater than the significance level (α = 0,05), indicating that there are no statistical differences between the means of the three constructed ISEs for a 95 % confidence level, for which ISEs can be used interchangeably to assess their response to nitrate.
The PDL and LLRL values are in the same order. The ISEs built with the TOMACl salt follow the following order depending on the mediating solvent used: DBP (1,90 ( 10-5mol ∙ L-1) < DOP (2,41 ( 10-5mol ∙ L-1) < DEP (4,88 ∙ 10-5mol ∙ L-1)/21/, therefore, a dependence on PDL and lipophilicity of the plasticizer used in the sensing membrane cannot be assured.
For the study of the response of the electrode against different activities of the primary ion, the regression line was prepared as shown in figure 1. An analysis of variance collected in table 3 was applied to corroborate the linearity of the model used as one of the best statistical tests to demonstrate linearity of a calibration curve.
As seen in figure 1, the adjusted determination coefficient (`R2) equal to 0,987 4 was obtained from the range of final activities and the measured potential, which indicates the degree of adjustment of the model referring to degrees of freedom. The over-Nernstian slope of -70,14 mV ∙ dec-1 and the correlation coefficient (r) of 0,993 6 indicates the strong relationship that exists between the response potential originated in the electrochemical cell and the activity of the primary ion.
The result of the analysis of variance carried out is shown in table 3.
Table 3 Analysis of variance carried out to determine linearity

SS.: Sum of squares, DF.:Degrees of freedom, HS.: Half square
Application of the ISE for determination of nitrate in natural water samples
Nitrate was determined in natural water samples, using the ISE developed through the potentiometric method of analysis and their results were compared by ANOVA with a commercial ISE ORION 9700BNWP, USA, and the UV-visible method established in the Standard Method. Table 3 shows the results obtained at different concentration levels studied.
As observed in table 4, the P-Value was higher than the chosen significance level (a = 0,05) in the three concentration levels analyzed, which shows that there are no statistically significant differences between the means of the concentrations of the determined analyte for 95 % confidence.
Calculation of uncertainty
Figure 2 shows the main sources of uncertainty that contribute to the analysis under conditions of intermediate precision of the analysis using a cause-and-effect diagram, The measurement in this case corresponds to the concentration of nitrate ions in natural waters, where the GUM method was followed "step by step" for a better analysis of the components of the associated uncertainty.
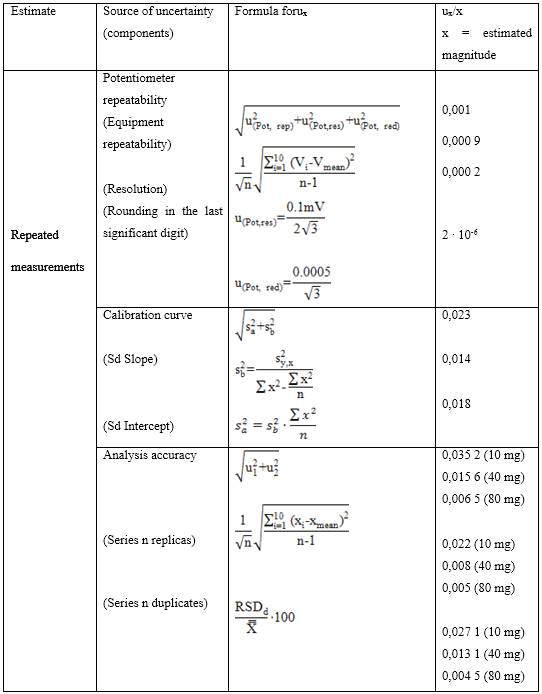
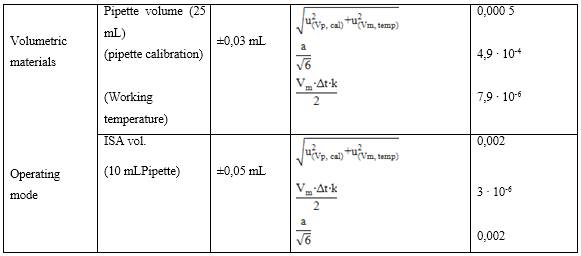
Tables 5-8 show the different components associated with the combined uncertainty in the determination of the primary ion with its corresponding mathematical weight in the calculation of the relative uncertainty.
As observed in tables 5 and 6, the main components with the greatest contribution to the mathematical weight of the equation for calculating the combined uncertainty of the measurement for the determination of nitrate in natural waters with the developed selective electrode are detached; which were obtained on the basis of repeated measurements, these being, the bias of the analysis through recovery tests and the precision of the analysis itself under conditions of intermediate precision of the method developed.
This is in accordance with what is referred to in the specialized literature consulted 6,34,35 in works related to the calculation of uncertainty in analytical measurements.
As can be seen, the uncertainty associated with the quantification of bias is taken into account independently of the result of its evaluation (table 7), as occurs in the case of levels higher than 40 mg ∙ L-1, which although they do not present significant bias, their mathematical component is taken into account in the calculation of the combined measurement uncertainty. In addition, it was considered to leave in the calculation since it gives more credibility to the estimation of the final combined uncertainty, as it is known that it is better to overestimate the measurement uncertainty than to underestimate it.
As observed in table 8, the calculated relative typical uncertainties associated with the tolerances of the volume equipment, differences in the calibration temperature and working temperature of the volumetric materials used, certificate of purity of the reagents, tolerance of the analytical balance used as well as the uncertainty associated with the molar mass of the analyte tested were those with the least significant contribution to the combined uncertainty of the measurement, the total mathematical component was lower compared to the estimated apportionment in repeated measurements,
The relative expanded uncertainties were calculated, as observed in table 9, at two concentration levels.
Table 9 Relative expanded uncertainties calculated at 2 concentration levels for 95 % confidence with coverage factor k = 2

Note: y (Result), C (Concentration)
The calculated relative expanded uncertainty resulted in a lower value for higher concentration levels while for a higher concentration level it was lower. This is in accordance with the different calculated typical uncertainties and the contribution of each of them to the combined measurement uncertainty. As can be seen in figure 3, the mathematical weight of each evaluated component is estimated apportionment against the Ur according to the studied concentration level.
In the case of the lower concentration level (10 mg ∙ L-1), the precision of the method is the one with the greatest mathematical weight in the selected calculation model (GUM “step by step”) above the source of uncertainty associated with the calibration curve, the bias that was significant and that associated with the operating mode. Therefore, it is expected that the behavior of the expanded uncertainty relative to different concentration levels under the same analysis conditions used in the study has an analogous behavior the precision of the method, that is, the lower the concentration, the precision decreases (numerical value increases, the presence of random errors in the method increases), the greater the concentration, the precision increases (numerical value decreases, the presence of random errors in the method decreases). This was evidenced in the estimation of the uncertainty for higher concentration levels, where the fundamental component that gives greater weight to the variability of the analysis turned out to be the uncertainty associated with the calibration curve, thus not being the component of precision as it was for the level of lower concentration.
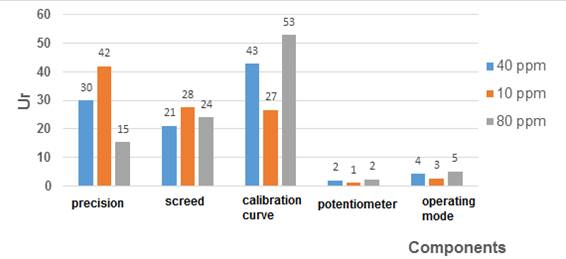
Fig. 3 Percentage distribution of components evaluated to distinct concentration levels in terms of the Ur
It should be noted that as a result of the step-by-step study of the uncertainty, the sensor membrane developed with diethylphthalate as a new plasticizer is the one with the highest sensitivity (higher slope value) compared to the phthalate families, but it is less reproducible as the concentration level of the primary ion increases. This agrees with many analytical systems where the most sensitive equipment is less reproducible and those that are capable of repeating the experiment with a high degree of agreement have a lower sensitivity.
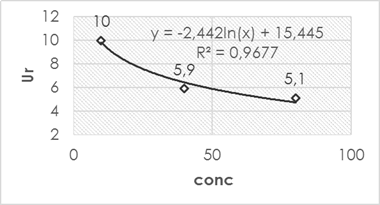
Once the uncertainties for the three concentration studied levels have been estimated, it is possible to develop a regression model (figure 4), which estimates with a certain degree of confidence the uncertainty associated with different concentration levels of the primary ion under the same conditions of analysis.
Conclusions
The ISE constructed with the quaternary ammonium salt TOMACl and DEP as plasticizer, presented an overnernstian slope of -70,1 ± 1,93 mV ∙ dec-1, with the value of its PDL and LLRL in the range of 10-5mol ∙ L-1. The electrode was evaluated in real samples with satisfactory results. The estimated measurement uncertainty showed that under conditions of intermediate precision of the analysis at lower levels of measurand content, the Ur component was 10 % higher than for higher analyte content levels, where Ur was less than 5,1 %


