


Mi SciELO
 Servicios personalizados
Servicios Personalizados
Articulo
 Articulo en XML
 Referencias del artículo
 Enviar articulo por email
Indicadores
-
 Citado por SciELO
Links relacionados
-
 Similares en
SciELO
Similares en
SciELO
Compartir

 Permalink
Revista Cubana de Farmacia
versión On-line ISSN 1561-2988
Rev Cubana Farm v.40 n.2 Ciudad de la Habana Mayo-ago. 2006
Artículos originales
Pedro Kourí Institute
Bioequivalence study: generic and trade formulations of stavudine, lamivudine, zidovudine and indinavir in Cuban HIV-infected subjects
Alicia Tarinas Reyes,1 Rolando D. Tápanes Peraza,2 Lizette Gil del Valle,3 Daniel González Rubio,4 Osvaldo Castro Peraza,4 Alejandro Saúl Padrón,2 Alina Martínez Rodríguez,5 Mylai Orta Gutiérrez,6 Geisy Ferrer Linares7 y Jorge Pérez Ávila8
Summary
Objective: The present study describes the determination of the bioequivalence of the Cuban generic and trade formulations of stavudine, lamivudine, zidovudine, and indinavir. Design: The bioequivalence of each antiretroviral drug (test and reference formulations) was determined in 13 or 14subjects by means of a randomizedcrossover blind study with a wash-outperiod of ten days. Methods: The plasma concentrations were monitored over a period of 12 h after drug administration using a validated HPLC method. The pharmacokinetic parameters were determined by using WinNolin Professional software, Version 2.1. The comparison of the pharmacokinetic parameters was made at 95 % confidence interval using the NCSS 2000 and PASS 2000 trial software (paired t-test, null hypothesis).The bioequivalence study was conducted by the EqivTest software of statistical solutions. ANOVA was utilized with 90 % confidence interval. Results: The present study showed that no significant differences were observed in the means of AUC0-12, AUC0-¥, C max, and T max of both formulations of stavudine, lamivudine zidovudine, and indinavir. It wasconcluded that the studied pharmacokinetic parameters are withinthe established range. The ranges for Cmax, AUC0-12, and AUC0-¥ were 80-125 %, whereasthe range for Cmax of zidovudine was 70-143 %. Conclusion: These results prove that the Cuban generic antiretroviralsare bioequivalent to their respective innovatory products in terms ofthe rate and extent of absorption.
Key words: Antiretroviral, bioequivalence, HPLC, HIV, generic drugs.
4.8 million people became newly infected with HIV in 2003. This figure is higher than in any other attained in previous years. 37.8 million of people are living with HIV today, and 2.9 million of people died. In Latin America and the Caribbean, 11 countries have a national HIV prevalence of 1 % or more (Report on the global HIV/AIDS epidemic. Joint United Nations Programme on HIV/AIDS (UNAIDS) 2004; 04.16E). Five to six million people in low- and middle-income countries urgently need antiretroviral treatment. Of them, the World Health Organization (WHO) estimated that only 400 000 people at the end of 2003 had access to it. This means that six million will die in the next two years if they do not receive antiretroviral treatment ( Progress Report on the Global Response to the HIV/AIDS Epidemic, UNAIDS, 2003; Coverage of selected services for HIV/AIDS prevention and care in low- and middle-income countries in 2003, UNAIDS/USAID/WHO/CDC and the Policy Project, 2004).
The use of generic drugs has been steadily increasing internationally as a result of economical pressure on drug budgets.1 Generic drugs provide the opportunity for major saving in healthcare expenditure since they may have substantially lower prices than the innovator brands. The practice of generic substitution is strongly supported by health authorities in many countries.2
The design of different formulations of the same drug substance, performance and evaluation of bioequivalence studies, have received major attention over the past century3,4 (Committee for Proprietary Medicinal Products. CPMP/EWP/QWP/1401/98. Note for guidance: investigation of bioavailability and bioequivalence. Food and Drugs Administration (FDA) Division of Biopharmacutics. Bioavailability Protocol Guideline for ANDA and NDA Submission. 1977. Food and Drugs Administration (FDA). Report by the bioequivalence task force on recommendation from the bioequivalence hearing conducted by the FDA, 29 September-1 October 1986, 1988. Nordic Council on Medicine. Bioavailability studies in man. Nordic Guidelines. NLN Publication No. 18. Nordiska L ä kemedelsn ä mnden, Uppsala, 1987) and over the last years5 and, comprises equivalence with respect to rate and extent of drug absorption. The bioequivalence range of 0.80-1.25 for AUC0-t, AUC0-¥, and Cmax wich is accepted by major health authorities including the European CPMP (Committee for Proprietary Medicinal Products), and the US FDA (United State Food and Drug Administration), was used in this study (Committee for Proprietary Medicinal Products. CPMP/EWP/QWP/1401/98. Note for guidance: investigation of bioavailability and bioequivalence. Food and Drugs Administration (FDA) Division of Biopharmacutics. Bioavailability Protocol Guideline for ANDA and NDA Submission. 1977. Food and Drug Administration (FDA), The Division of Bioequivalence. 1992. Statistical procedures for bioequivalence studies using a standard two-treatment crossover design. FDA Guidance).
The objective of this study was to evaluate the single oral dose bioequivalence parameters of the innovators (Zerit®, Epivir®, Retrovir® and Crixivan®), and generic formulations to assure that both generic or trade formulation of stavudine (d4T), lamivudine (3TC), zidovudine (AZT), and indinavir (INV) could be taken indistinctly.
Methods
Subjects
Because of the potential toxicity and mutagenicity of antiretroviral agents, pharmacokinetic and bioequivalence studies have been conducted in HIV subjects.6 Nevertheless, these studies are highly controlled with strict criteria for enrolment and exclusion' subjects. HIV prerecluted subjects signed an informed consent before the study initiation. Subjects with a history of bleeding disorders, cardiac, renal, hepatic, and gastrointestinal diseases were excluded from the study. The study was approved by the Ethics and Research Committee for Human Research at Pedro Kourí Institute, and was carried out according to the ethical principles (WHO/PAHO. International Ethical Norms for biomedical investigation involving human subjects. Geneve, 1996. World Medical Association (WMA). Declaration of Helsinki. Edinburgh: Ethical principles for medical research involving human subjects; October 2000), the National Sanitary dispositions (Requerimientos para estudios de biodisponibilidad y bioequivalencia. Regulación 18-99, CECMED. Cuba) and executed under Good Clinical Practice (GCP) conditions.
The subjects were admitted to the ward the same day or the day before dosing
Fifty-four HIV subjects (13 for lamivudine, 13 for zidovudine, 14 for stavudine, and 14 for indinavir) 41 males and 13 females aged 22-49 years old were studied. The mean age of the study population ranged from 22 to 49 years (mean ± SD, 33.8 ± 6.7 years), and the average weight was 65.5 ± 14.4 kg.
The including subjects were considered as the appropriate sample size to estimate the intra-subjects variability and to estimate the sample size for this study. All enrolled subjects were included in the pharmacokinetic and bioequivalence study. The subjects were not allowed to consume food or beverages 10 h prior to dosing. A nurse supervised drug administration and the dose was taken with 120 mL. No food was allowed 30 min after dosing.7,8
Study Drugs
The tested drugs were:
A Cuban Novatec 40 mg capsule of stavudine (treatment B) ( Lot number 20010001, expiration date February 2003). The reference formulation was a Zerit® 40 mg capsule (treatment A) ( Lot number 0J42825, Bristol-Myers Squibb Co (USA), expiration date September 2002. Study date (September 2001-April 2002).
A Cuban Novatec 150 mg tablet of lamivudine (treatment B) ( Lot number 00004, expiration date December 2002). The reference formulation was an Epivir® 150 mg tablet (treatment A) ( Lot number B028741, Glaxo-Wellcome (UK), expiration date October 2002. Study date (November 2001-February 2003). The drug administration and blood collection were made from January 2002 to March 2002.
A Cuban Novatec 100 mg capsule of zidovudine (treatment A) (Lot number 0003, expiration date October 2004). The reference formulation was Retrovir® 100 mg capsule (treatment B) (Lot number OZP0105, Glaxo-Wellcome (UK), expiration date August 2003. Study date (March 2002- April 2003).
A Cuban Novatec 200 mg capsule of indinavir (treatment A) (Lot 20020009, expiration date November 2004). The reference formulation was Crixivan® 400 mg capsule (treatment B) (Lot number L8299, Merck (Germany), expiration date July 2004. Study date (November 2003-June 2004).
Trial Design
The study was carried out in a randomized 2 x 2 crossover, blind, and single oral dose design. The washout period between formulations was at least ten days. All volunteers received a single dose (stavudine 40 mg, lamivudine 150 mg, zidovudine 300 mg, or indinavir 800 mg) during each of the 2 trial periods. These doses are the most used and recommended for a simple dose in each time period. The subjects who were administered these drugs were not the same. The treatment sequences were either treatment A in the first period followed by treatment B in the second period, or vice versa (AB; BA). Subjects were assigned to one of the two-drug sequences. The human bioavailability study and the analysis of the plasma concentrations levels by isocratic HPLC system was performed from 2001 to 2004 at the Clinical Pharmacology Laboratory of the Pedro Kourí Institute Hospital's in Havana City.
Chemicals and reagents
All used chemicals were HPLC-grade, from Merck (Darmstadt, Germany). The Marianao Blood Bank, Havana City, Cuba, supplied drug-free human plasma. Solid-phase extraction cartridges (C18 LiChrolut, 1 mlL 100 mg) were purchased from Merck (Darmstadt, Germany).
Apparatus and HPLC-conditions
The EuroChrom 2000 chromatography manager software was used to control the HPLC system witch consists of a K-1001 HPLC pump, a K-2600 UV variable detector, and the Basic Maraton automatic injector, all from Knauer (Berlin, Germany ). The UV detector was used to monitor the drugs at wavelengths of 271 nm (stavudine and lamivudine), 267 nm (zidovudine) and 210 nm. (indinavir). The mobile phase was different for each drug and was vacuum degassed before use. Acetonitrile and water (9:91, v/v) at a flow-rate of 0,7 mL min-1 was used for stavudine and lamivudine. Methanol and water (20:80, v/v) at a flow rate of 1,2 mL min-1 for zidovudine,9 and buffer phosphate (pH 5.7) and acetonitrile (60:40, v/v) with 0.2 % triethylamin at a flow rate of 1.3 mL min-1 for indinavir. A Merck C18 reversed-phase column, 250 mm x 4 mm (ID) with 5 µm particle size packing was used. The HPLC method used for the quantification of stavudine and lamivudine in this study is a new rapid, sensitive, and specific procedure. Samples from the indinavir study were analyzed by a modified version of the Foisy ML assay.10 The modification consisted in the addition of 2 % triethylamine as ion-paired to ensure an appropriate retention time for indinavir to differentiate it from other potential interference from plasma peak. The three methods were validated under Good Laboratory Practice (GLP) conditions.
Collection and Storage of Samples
Venous blood samples were collected before and 0.25, 0.5, 0.75, 1, 1.5, 2, 3, 4, 6, 8, and 12 h after drug administration. The collected blood samples were immediately chilled and centrifuged at 3 000 rpm for 10 min. The separated plasma was then stored at -20 °C until assay.
Samples preparation and quantification
HIV subjects samples were routinely heated at 57 oC for 30 min to inactivate the virus prior to handling.
The solid-phase extraction cartridge was conditioned with 2 mL of methanol and 2 mL of bidis- tilled water before 500 µL of patient's plasma samples were loaded into the column and were allowed to pass through the bed with minimal suction followed by 500 µL of bidistilled water and collected in 500 µL of methanol. The eluent was evaporated to dryness under a nitrogen stream at 40 oC, the residue was reconstituted in the mobile phase (200 µL), and an aliquot (50 µL) was injected onto the HPLC system. An automatic injector system facilitated the samples injections. Plasma drug concentrations were determined by isocratic HPLC and the external standard method was used.11,12
The powdered drugs were weighed and dissolved in bidistilled water to obtain a stock solution of 1,0 mg mL-1. Serial dilutions of the stock solutions were appropriately diluted to lower concentration for spiking the calibration standards. Calibration standards covering the concentration range between 10 to 1 600 ngmL-1 (stavudine), 50 to 3 200 ngmL-1 (lamivudine), 0.05 to 5,0 mg µL-1 (zidovudine), and 0.1 to 10.0 mg µL-1 (indinavir) were prepared by adding appropriate volumes of the diluted solutions to drug-free human plasma. Seven standards were used to obtain the calibration curves for assay validation and for clinical assay. Aliquots of calibration standards, and quality control (QC) samples were pipetted into screw-capped culture tubes, and kept frozen at -20 oC until required for analysis. Frozen plasma samples from study subjects, and calibration standards were thawed as needed.
Parameters studied
The pharmacokinetic variables area under the plasma concentration vs. time curve (AUC0-t, and AUC0-¥), the maximum plasma concentration (Cmax) and the time to maximum serum concentration (Tmax) were calculated for each subject in each treatment period.
Pharmacokinetic parameters and statistical analysis
The pharmacokinetic characteristics of stavudine, lamivudine, zidovudine, and indinavir were determined from the plasma concentration-time data. Peak plasma concentration (Cmax) and time to maximum plasma concentration (Tmax) were determined directly from raw data. The area under the curve (AUC0-t, and AUC0-¥) was calculated by the trapezoidal method plus extrapolation to infinity from the curve relating plasma concentration to time.
Data were expressed by means ± SD from replicates. The Microsoft Excel 5.0 software was used to calculate means, and SD values.
The pharmacokinetic parameters were determined by using the PKCALC and WinNonlin Professional Edition, version 2.1 programs (non compartmental method). The comparison of the pharmacokinetic parameters was carried out at 95 % confidence interval using the NCSS 2000 and PASS 2000 trial software (paired t-test, null hypothesis).
The software Equiv Test, version 2, from Statistical Solutions made the bioequivalence test at 90 % confidence interval for the ratio of central values of natural log-transformed AUC0-t; AUC0-¥ and Cmax . That should be generated using a two one side test at the 0.05 level.
Results
Stavudine, lamivudine, zidovudine, and indinavir were well tolerated in the administered dose, and no adverse effects were reported.
The mean antiretroviral concentration-time profiles after administration of the test and reference formulations are depicted in figure (A, B, C, D).
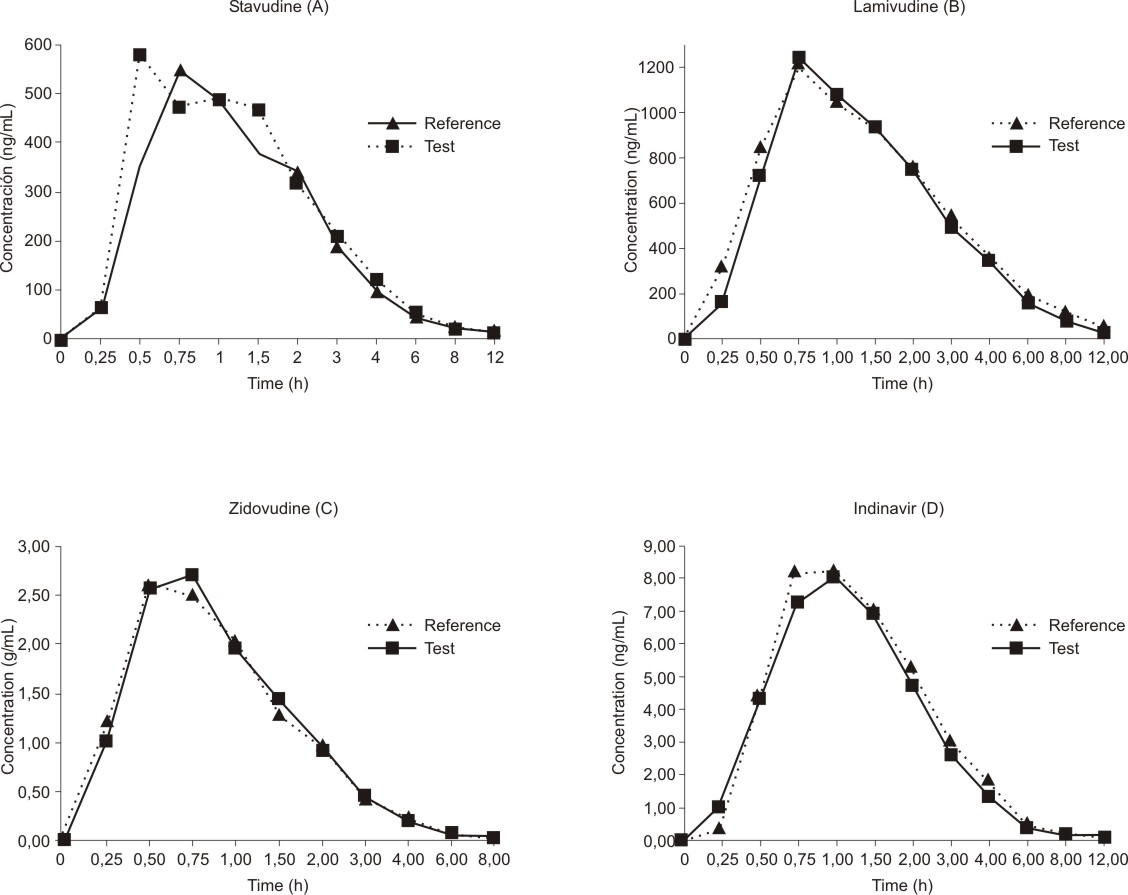
Fig. Plasma concentration-time profiles of stavudine (A), lamivudine (B), zidovudine (C), and indinavir (D).
All of the pharmacokinetic parameters calculated for the Test formulation were close to those of the Reference formulation and there were no statistically significant differences between the two products of each drug (table 1). The differences were considered statistically significant when the probability of accepting the null hypothesis (Ho) was bellow 0.05. Results are expressed as the mean ± standard deviation. The null hypothesis (t-test) was performed with terms of status of test, and reference formulations. The 95 % confidence intervals were calculated for the means, the differences between means, and the corresponding ratio of the means. In our study the AUC0-t, AUC0-¥, Cmax, and the T max for the trade and generic formulationsof each drug did not differ significantly (Ho > 0.05).
Table1. Pharmacokinetic parameters
| Stavudine | Parameters | Reference | Test |
|
| Cmax (ng mL-1) | 77 3.41 ± 313.28 | 884.76 ± 401.69 |
|
| Tmax (h) | 1.13 ± 0.49 | 0.98 ± 0.48 |
|
| AUC0-12 (ng.h mL-1) | 1380.94 ± 582.13 | 1477.32 ± 522.28 |
|
| AUC 0-¥ (ng.h mL-1) | 1585.99 ± 831.29 | 1622.57 ± 500.81 |
|
| AUC 0-t/0-¥ (%) | 91.7 ± 12.8 | 95.7 ± 5.50 |
|
| Ln AUC0-t (ng.h mL-1) | 3.14 ± 0.17 | 3.10 ± 0.17 |
|
| Ln AUC0-¥ (ng.h mL-1) | 3.16 ± 0.16 | 3.15 ± 0.21 |
|
| T½ | 2.31 ± 1.59 | 2.35 ± 0.68 |
| Lamivudine | Parameters | Reference | Test |
|
| Cmax (ng mL-1) | 1333.09 ± 655.41 | 1430.24 ± 726.98 |
|
| Tmax (h) | 1.0 ± 0.35 | 1.06 ± 0.42 |
|
| AUC0-12 (ng.h mL-1) | 3990.01 ± 1802.90 | 3615.34 ± 1542.24 |
|
| AUC0-¥ (ng.h mL-1) | 4046.24 ± 3598.26 | 3728.55 ± 1569.66 |
|
| AUC0-t/0-¥ (%) | 97.1 ± 10.88 | 96.2 ± 2.89 |
|
| Ln AUC0-t (ng.h mL-1) | 3.56 ± 0.21 | 3.51 ± 0.22 |
|
| Ln AUC0-¥ (ng.h mL-1) | 3.57 ± 0.17 | 3.52 ± 0.22 |
|
| T½ | 3.41 ± 1.63 | 3.11 ± 1.10 |
| Zidovudine | Parameters | Reference | Test |
|
| Cmax (µg mL-1) | 3.5 6 ± 1.34 | 3.35 ± 1.41 |
|
| Tmax (h) | 0.85 ± 0.56 | 0.75 ± 0.40 |
|
| AUC0-8 (µg.h mL-1) | 4.56 ± 1.23 | 4.71 ± 1.50 |
|
| AUC0-¥ (µg.h mL-1) | 4.72 ± 1.34 | 4.76 ± 1.41 |
|
| AUC0-t/0-¥ (%) | 98.3 ± 1.0 | 98.8 ± 1.0 |
|
| Ln AUC0-t (µg.h mL-1) | 0.65 ± 0.13 | 0.64 ± 0.16 |
|
| Ln AUC0-¥ (µg.h mL-1) | 0.65 ± 0.13 | 0.65 ± 0.16 |
|
| T½ | 1.26 ± 0.26 | 1.24 ± 0.25 |
| Indinavir | Parameters | Reference | Test |
|
| Cmax (µg µL-1) | 10.56 ± 2.77 | 9.73 ± 2.93 |
|
| Tmax (h) | 0.96 ± 0.29 | 1.0 ± 0.32 |
|
| AUC 0-12 ( µg.h mL-1) | 21.28 ± 10.65 | 19.05 ±8.03 |
|
| AUC 0-¥ ( µg.h mL-1) | 21.54 ± 10.83 | 19.26 ± 8.07 |
|
| AUC 0-t/0- ¥ (%) | 98.9 ± 1.29 | 98.7 ± 1.28 |
|
| Ln AUC 0-t ( µg.h mL-1) | 1.19 ± 0.40 | 1.23 ± 0.23 |
|
| Ln AUC 0-¥ ( µg.h mL-1) | 1.27 ± 0.27 | 1.24 ± 0.21 |
|
| T½ | 1.48 ± 0.50 | 1.82 ± 0.66 |
The ratio of the ln transformed data of both formulation (test and reference) were calculated for each subject (table 2, and 3). It should also be noted that none of these values obtained from all subjects in the four studies were outside the range 0.8-1,25 or 0.7-1.43 (Cmax for zidovudine). For T max the mean of test product (0.98 ± 0.48 for d4T, 1.06 ± 0.42 for 3TC, 0.75 ± 0.40 for AZT, and 1.0 ± 0.32 for INV) are within the bioequivalence limits for this parameter (0.90-1.36, 0.80-1.20, 0.68-1.02 and 0.76-1.16 respectively). This bioequivalence limits are calculated with the mean Tmax reference product ± 20 % of mean Tmax test product (1.13 ± 0.23 for d4T, 1.0 ± 0.20 for 3TC, 0.85 ± 0.17 for AZT, and 0.96 ± 0.20 for INV).
Table 2. Bioequivalence studies for test vs reference formulations stavudine (d4t) and lamivudine (3tc)
|
Subjects | d4T | 3TC | ||||||||
| Cmax T/R | Log Cmax T/R | Tmax (T-R) (hours) | AUC | Log AUC | Cmax | Log Cmax T/R | Tmax (T-R) (hours) | AUC T/R | log AUC | |
| 1 | 2.46 | 0.90 | 0.25 | 2.09 | 0.74 | 0.92 | -0.29 | 0.0 | 1.11 | 0.10 |
| 2 | 1.96 | 0.67 | -0.10 | 0.97 | -0.03 | 1.02 | 0.29 | 0.25 | 0.57 | -0.56 |
| 3 | 0.22 | -1.51 | 0.25 | 0.27 | -1.31 | 1.02 | 0.08 | 0.0 | 0.81 | -0.21 |
| 4 | 0.88 | -0.13 | 0.50 | 1.61 | 0.48 | 1.29 | 0.31 | 0.0 | 0.73 | -0.31 |
| 5 | 0.55 | -0.60 | 0.75 | 1.64 | 0.50 | 0.75 | -0.80 | 0.75 | 1.10 | 0.10 |
| 6 | 1.18 | 0.17 | -0.25 | 0.76 | -0.27 | 1.34 | 0.62 | -0.75 | 0.83 | -0.19 |
| 7 | 1.95 | 0.67 | -1.0 | 0.95 | -0.05 | 1.08 | 0.25 | -0.25 | 0.98 | -0.02 |
| 8 | 2.08 | 0.73 | -0.50 | 1.36 | 0.31 | 1.36 | -0.07 | -0.5 | 1.08 | 0.08 |
| 9 | 1.13 | 0.12 | -1.25 | 0.57 | -0.56 | 0.45 | 0.29 | 1.25 | 0.70 | -0.36 |
| 10 | 0.87 | -0.14 | 0.25 | 1.78 | 0.58 | 1.86 | -0.29 | -0.75 | 0.92 | -0.08 |
| 11 | 1.52 | 0.42 | -0.50 | 1.65 | 0.50 | 1.29 | 0.29 | 0.75 | 1.30 | 0.26 |
| 12 | 0.97 | -0.03 | 1.25 | 1.30 | 0.26 | 0.93 | 0.08 | 0.0 | 0.70 | -0.36 |
| 13 | 1.58 | 0.46 | -0.75 | 0.99 | -0.01 | 1.34 | 0.31 | 0.0 | 1.20 | 0.18 |
| 14 | 0.71 | -0.34 | 0.0 | 1.0 | 0.0 | - | - | - | - | - |
| _ | | | | | | | | | | |
| SD | 0.65 | 0.64 | 0.69 | 0.51 | 0.54 | 0.35 | 0.35 | 0.59 | 0.22 | 0.24 |
| GM | - | 1.10 | - | - | 1.08 | - | 1.07 | - | - | 0.90 |
| CI90 % | - | 0.92-0.99 | - | - | 0.96-1.02 | - | 0.98-1.05 | - | - | 0.97-1.06 |
| BCmm | - | 0.80-1.25 | - | - | 0.80-1.25 | - | 0.80-1.25 | - | - | 0.80-1.25 |
| BCam | - | - | 0.23 | - | - | - | - | 0.20 | - | - |
_
X: arithmetic media; SD: standard deviation; GM: geometric media; CI90 %: confidence interval (5 % confidence limit); BC mm: bioequivalence criterium for the multiplicative model (relative values); BCam: bioequivalence criterium for the additive model (absolute values, hours)
Table 3.Bioequivalence studies for test vs reference formulations zidovudine (zvd) and indinavir (inv)
|
Subjects | ZVD | INV | ||||||||
| Cmax | Log Cmax | Tmax (T-R) (hours) | AUC | Log AUC | C max | Log Cmax | Tmax (T-R) (hours) | AUC | Log AUC | |
| 1 | 0.82 | -0.20 | -0.25 | 1.02 | 0.02 | 0.65 | -0.43 | 0.25 | 0.66 | -0.42 |
| 2 | 1.06 | 0.06 | 0.0 | 1.05 | 0.05 | 0.66 | -0.41 | -0.25 | 0.64 | -0.45 |
| 3 | 1.65 | 0.50 | 0.0 | 1.45 | 0.37 | 1.09 | 0.08 | -0.25 | 1.04 | 0.04 |
| 4 | 0.89 | -0.12 | 0.25 | 1.20 | 0.18 | 0.75 | -0.28 | 0.0 | 0.78 | -0.25 |
| 5 | 0.37 | -0.99 | 0.0 | 0.40 | -0.92 | 0.90 | -0.10 | 0.0 | 0.86 | -0.15 |
| 6 | 0.90 | -0.11 | 0.0 | 0.79 | -0.24 | 1.45 | 0.37 | -0.50 | 1.01 | 0.01 |
| 7 | 1.55 | 0.44 | -0.5 | 1.10 | 0.10 | 1.27 | 0.23 | 0.25 | 1.41 | 0.34 |
| 8 | 0.65 | -0.43 | 0.75 | 0.88 | -0.13 | 0.82 | -0.19 | 0.0 | 1.01 | 0.01 |
| 9 | 1.72 | 0.54 | -0.25 | 1.10 | 0.10 | 0.87 | -0.13 | 0.0 | 1.20 | 0.18 |
| 10 | 1.86 | 0.62 | -1.5 | 1.04 | 0.04 | 0.56 | -0.57 | -0.25 | 0.43 | -0.84 |
| 11 | 1.05 | 0.05 | -0.25 | 1.25 | 0.22 | 0.96 | -0.04 | 0.0 | 0.77 | -0.26 |
| 12 | 0.72 | -0.33 | 0.25 | 1.45 | 0.37 | 0.88 | -0.12 | 0.0 | 0.99 | -0.01 |
| 13 | 0.86 | -0.15 | 0.25 | 1.03 | 0.03 | 1.10 | 0.09 | 0.25 | 2.05 | 0.72 |
| 14 | - | - | - | - | - | 1.29 | 0.25 | 0.0 | 1.18 | 0.17 |
| _ | | | | | | | | | | |
| SD | 0.46 | 0.46 | 0.53 | 0.28 | 0.33 | 0.26 | 0.28 | 0.22 | 0.40 | 0.38 |
| GM | - | 0.99 | - | - | 1.02 | - | 0.91 | - | - | 0.94 |
| CI90% | - | 0.79–1.29 | - | - | 0.87–1.16 | - | 0.95 – 1.14 | - | - | 0.90 – 1.16 |
| BCmm | - | 0.70–1.43 | - | - | 0.80–1.25 | - | 0.80–1.25 | - | - | 0.80–1.25 |
| BCam | - | - | 0.17 | - | - |
|
| 0.20 |
|
|
_
X: arithmetic media; SD: standard deviation; GM: geometric media; CI90 %: confidence interval (5 % confidence limit); BC mm: bioequivalence criterion for the multiplicative model (relative values); BCam : bioequivalence criterion for the additive model (absolute values, hours)
Discussion
Two Pharmaceutical products are bioequivalent if they are pharmaceutically equivalent and their bioavailabilities (rate and extent of availability), after administration in the same molar dose, are similar to such a degree that their effects can be expected to be essentially the same (OMS, Guideline (1996): Multisource (generic) pharmaceutical products: guidelines on registration requirements to establish interchangeability WHO Technical Report Series N o 863, 114-155).
Comparative pharmacokinetic studies of the two products of each drug (test and reference formulation of zidovudine, stavudine, lamivudine, and indinavir) in HIV subjects revealed that the parameters which indicate the amount of drug absorbed into the body (AUC0-t; AUC0-¥) and the relative rate of drug absorption (Cmax) obtained from the two formulations of each antiretroviral agent were very similar. The 90 % confidence interval of the mean ratio of lnAUC0-t and lnAUC0-¥ were within 0.80-1.25 range which indicates that the Test formulations were bioequivalent to the Reference formulations for each case. Thus, it can be concluded that these two formulations of zidovudine, stavudine, lamivudine, and indinavir when orally administered to HIV patients were bioequivalent regarding rate and extent of absorption.
Resumen
Estudio de bioequivalencia: formulaciones genéricas y comerciales de estaduvine, lamiduvine, zidovudine e indinavir en pacientes cubanos infectados con VIH
Objetivo: El presente estudio describe los estudios de bioequivalencia de los genéricos cubanos antirretrovirales estavudina, lamivudina, zidovudina e indinavir con respecto a sus productos innovadores. Diseño: Los estudios de bioequivalencia de cada antirretroviral estudiado (formulación de prueba, P y referencia, R), se realizaron en 13 ó 14 sujetos, según el caso con la utilización de las medias en un estudio aleatorio, cruzado y a dosis única con un período de lavado de 10 días. Métodos: Las concentración de los antirretrovirales en plasma se monitorearon durante un período de 12 h después de la administración de estos, mediante el uso de métodos validados de cromatografía líquida de alta resolución (HPLC). Los parámetros farmacocinéticos se determinaron con el uso el software profesional WinNolin, versión 2.1. La comparación de los parámetros farmacocinéticos se realizó con un intervalo de confianza del 95 % con la utilización del software NCSS 2000 PASS 2000 (hipótesis nula). Para el estudio de bioequivalencia se usó el software Equiv Test de soluciones estadísticas, empleando ANOVA con el 90 % de intervalo de confianza. Resultados: El presente estudio mostró que no se observaron diferencias significativas en las medias de AUC0-12, AUC0-¥, Cmax y Tmax de ambas formulaciones de estavudina, lamivudina, zidovudina e indinavir. Se concluye que los parámetros farmacocinéticos estudiados se encuentran dentro de los rangos establecidos siendo 80-125 % para Cmax, AUC0-12, y AUC0-¥. En el caso de Cmax de la zidovudina el rango fue 70-143 %. Conclusión: Estos resultados avalan que los genéricos antirretrovirales cubanos son bioequivalentes con sus respectivos productos innovadores en términos de velocidad y magnitud de la absorción.
Palabras clave: Antiretroviral, bioequivalencia, HPLC, HIV, medicamentos genéricos.
References
1. King DR , Kanavos P. Encouraging the use of generic medicines: implications for transition economics. Croat Med J. 2002;43:462-9.
2. Hasssali A, Stewaet K, Kong D. Quality use of generic medicines. Australian Prescriber. 2004;27(4):80-1.
3. APV guideline. Studies on bioavailability and bioequivalence. Drugs Made in Germany . 1987;30:161-6.
4. Schulz H-U, Steinijans VW. Striving for standards in bioquivalence assessment: a review. Int J Clin Pharmacol Ther Toxicol. 1992;3(Suppl. 1):S1-S6.
5. Estévez F. Estudios de Bioequivalencia: enfoque metodológico y aplicaciones prácticas en la evaluación de medicamentos genéricos. Rev Med Uruguay.2000;16:133-43.
6. Rana KZ, Dudley MN . Clinical Pharmacokinetics of stavudine. Clin. Pharmacokinet. 1997;33(4):276-84.
7. Schaad HJ, Petty BG, Grasela DM, Christofalo B, Raymond R, Stewart M. Pharmacokinetics and safety of a single dose of stavudine (d4T) in patients with severe hepatic impairment. Antimicrob AgentsChemother. 1997;41(12):2793-96.
8. Yeh KC, Deutsch PJ, Haddix H, Hesney M, Hoagland V, Ju WD, et al. Single dose pharmacokinetics of indinavir and the effect of food. Antimicrob Agents Chemother. 1998; 42(2):332-8
9. Klecker RW Jr, Collins JM, Yarchoan R, Thomas R, Jenkins JF, Broder S, et al. Plasma and cerebrospinal fluid pharmacokinetic of 3'-azido-3,-deoxythymidine: a novel pyrimidine analog with potential application for the treatment of patients with AIDS and related diseases. Clin Pharmacol Ther. 1987;41:407-12.
10. Foisy ML, Sommadossi JP. Rapid quantitation of indinavir in human plasma by high performance liquid chromatography with ultra violet detection. J Chromatog B Biomedical Sci Appl. 1999;721:239-47.
11. Zhou XJ, Sommadossi JP. Rapid quantitation of (-)-2'-deoxy-3'-thiacytidine in human serum by high performance liquid chromatography with ultra violet detection. J Chromatog B Biomedical Sci Appl. 1997;691:417-24.
12. Bean P, Patnaik M, Graziano FM, Aziz DC. Therapeutic drug monitoring of antiretroviral agents. Am Clin Lab. 2000; May 20.
Recibido: 5 de enero de 2006. Aprobado: 14 de febrero de 2006.
Dra. Alicia Tarinas Reyes. Pedro Kourí Institute (IPK), Havana City, Cuba.
1Investigadora Agregada.
2Doctor en Ciencias. Investigador Titular.
3Doctora en Ciencias. Investigadora Agregada.
4Master enCiencias. Investigador Agregado.
5Master en Ciencias.
6Licenciada.
7Técnica.
8Master en Ciencias. Investigador Auxiliar.

