


 Servicios personalizados
 Inglés (pdf)
 Articulo en XML
 Referencias del artículo
 Enviar articulo por email
 Citado por SciELO
  Similares en
SciELO
Similares en
SciELO 
 Permalink
INTRODUCTION
Cardiovascular diseases cause a significant mortality rate worldwide, they are the cause of 31 % of the deaths and 71 % of them occur in low to middle-income countries.1) Furthermore, 85 % of all disabilities are caused directly or secondary by cardiovascular diseases.2
Metabolic syndrome is a condition that predisposes to the development of cardiovascular and metabolic diseases, in these diseases the presence of altered blood pressure, insulin resistance, hyperglycemia, dyslipidemia and abdominal obesity are evaluated.3 The prevalence of metabolic syndrome in military personnel is 21 %.4
Worldwide, the prevalence of metabolic syndrome in military personnel in Asian countries is 11.1 % in Iran and 15 % in Taiwan.5,6 In addition, in Latin America the prevalence is 38.54 % in Brazil.7
The estimate prevalence of metabolic syndrome in Latin America and Ecuador are scarce; however, this condition has been found in 31.2 % of the general population, and in 8 % of military personnel.8,9,10
In Ecuador, to this date there is no consensus about the anthropometric cut-off value that can be used to predict the development of cardiovascular or metabolic disease.9
To know the prevalence of metabolic syndrome, as well as the anthropometric indices that predict it, in the military personnel of the "Vencedores del Cenepa" Soldier Training School, provides a guideline to understand and characterize this medical condition in the military context, both in the country and in the region, to finally correlate it with the information obtained in the general population, and thus, establish preventive measures in the short, medium and long term, in order to avoid cardiovascular and metabolic diseases in this population group in particular.
The following general objective has been proposed: To evaluate the anthropometric indices that predict the presence of developing metabolic syndrome in Ecuadorian military personnel.
METHODS
This study was quantitative, observational and longitudinal with a correlational scope. It was carried out in military personnel of the "Vencedores del Cenepa" Army Soldier Training School, during a 3-year cohort from 2019 to 2021.
The study population was 366 instructors, with a sample of 300, 301 and 263 soldiers in 2019, 2020 and 2021 respectively, which corresponds to a confidence level of 95 %, margin of error of 5 % and 50 % heterogeneity.
The pre-established inclusion criterion was being military personnel from the “Vencedores del Cenepa” Army Soldier Training School. In contrast, military personnel with incomplete annual medical records were excluded.
The development of this study was carried out in three phases, which are detailed below:
Phase I: collect the measurements of the anthropometric indices: a) abdominal perimeter, b) body mass index, c) waist height index, d) waist weight index and e) percentage of body fat, and put them in the pre-established chart. Additionally, it was collected the biochemical profile from the annual medical records corresponding to: a) triglycerides, b) blood glucose, c) blood pressure and d) proteinuria. The high density lipoprotein - cholesterol (HDL-C) test was not evaluated in this research, because it is not considered as a routine lipid test at the institution.
Phase II: perform the results analysis of the anthropometric records and annual medical records, in order to classify military personnel as a patient with metabolic syndrome or as a healthy patient, according to the ATP III and ALAD diagnostic criteria.
Phase III: to carry out a statistical analysis of the anthropometric indices that predict the metabolic syndrome in the military personnel of the “Vencedores del Cenepa” Army Soldier Training School.
The information collection instrument was the annual clinical history, carried out during the months of October 2019, November 2020 and September 2021, which is a document that collects the variables studied, detailed in phase 1 of the established methodology.
The information was obtained with the prior authorization of the Institute’s director and the informed consent of the participating military personnel.
Statistical analysis was performed with SPSS (version 28) and MedCalc. Continuous variables are expressed as mean ± SD (Tg: triglycerides, Gl: Glucose, Sp: Systolic pressure, Dp: Diastolic pressure, BMI: body mass index, WHR: waist-hip ratio, WHtR: waist to height ratio, WWR: weight-to-waist ratio). In addition, the analysis of the Receiver Operating Characteristic (ROC) curve using the Youden index was considered statistically significant (< 0.0001) to determine the optimal cut-off point for the anthropometric indices (BMI: body mass index, WHR: waist- hip ratio, WHtR: waist to height ratio, WWR: weight to waist ratio) in the diagnosis of metabolic syndrome (according to ATP III and ALAD criteria).
RESULTS
The prevalence of metabolic syndrome in military personnel, according to ALAD criteria, was 1 % (n= 3), 1.66 % (n= 5) and 0.76 % (n= 2), in the year 2019, 2020 and 2021 respectively. Likewise, according to the ATP III criteria, the prevalence of metabolic syndrome was 6.67 % (n= 20), 6.31 % (n= 19) and 5.70 % (n= 15) in 2019, 2020 and 2021 respectively (table 1, table 2 and table 3).
When analyzing the population that presented metabolic syndrome, according to ALAD criteria, during the year 2019, it was evidenced an average waist circumference of 101.33 cm, hip circumference of 101.33 cm, body mass index of 29.51 kg/m2, waist-hip ratio of 1.00, waist-height ratio of 0.62, fat percentage of 28.87 and waist-weight ratio of 0.80 (table 1).
Table 1 Characteristics of the population variables in 2019
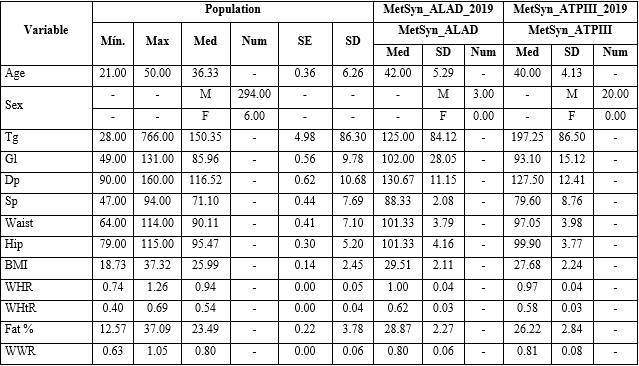
Tg: triglycerides, Gl: Glucose, Sp: Systolic pressure, Dp: Diastolic pressure, BMI: body mass index, WHR: waist-hip ratio, WHtR: waist to height ratio, WWR: weight to waist ratio, Min: minimum, Max: maximum, Med: median, Num: number, SE: standard error, SD: standard deviation, MetSyn: metabolic syndrome, No_MetSyn: No metabolic syndrome.
Table 2 Characteristics of the population variables in 2020
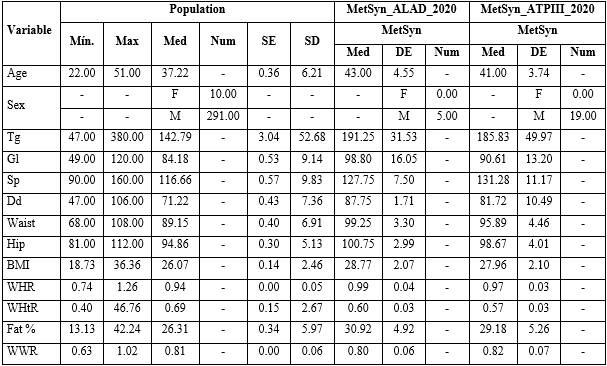
Tg: triglycerides, Gl: Glucose, Sp: Systolic pressure, Dp: Diastolic pressure, BMI: body mass index, WHR: waist-hip ratio, WHtR: waist to height ratio, WWR: weight to waist ratio, Min: minimum, Max: maximum, Med: median, Num: number, SE: standard error, SD: standard deviation, MetSyn: metabolic syndrome, No_MetSyn: No metabolic syndrome.
Table 3 Characteristics of the population variables in 2021
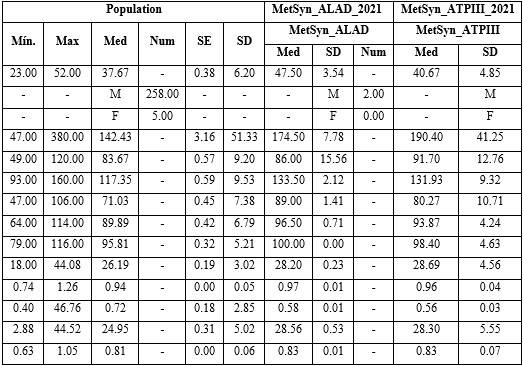
Tg: triglycerides, Gl: Glucose, Sp: Systolic pressure, Dp: Diastolic pressure, BMI: body mass index, WHR: waist-hip ratio, WHtR: waist to height ratio, WWR: weight to waist ratio, Min: minimum, Max: maximum, Med: median, Num: number, SE: standard error, SD: standard deviation, MetSyn: metabolic syndrome, No_MetSyn: No metabolic syndrome.
In addition, when analyzing the population that developed metabolic syndrome, according to ATP III criteria, during the year 2019, an average waist circumference of 97.05 cm was evidenced, as well as an average hip circumference of 99.90 cm, body mass index of 27.68 kg/m2, waist-hip ratio of 0.97, waist-height ratio of 0.58, fat percentage of 26.22 and weight-to-waist ratio of 0.81 (table 1).
In the population diagnosed with metabolic syndrome in the year 2020, according to ALAD criteria, there is evidence of an average waist circumference of 99.25 cm, as well as an average hip circumference of 100.75 cm, body mass index of 28.77 kg/m2, waist-hip ratio of 0.99, waist-height ratio of 0.60, fat percentage of 30.92 and waist-weight ratio of 0.80 (table 2).
Likewise, in the population with metabolic syndrome, according to ATP III criteria, the average waist circumference of 95.89 cm, as well as an average hip circumference of 98.67 cm, body mass index of 27.96 kg/m2, waist-hip ratio of 0.97, waist-height ratio of 0.57, fat percentage of 29.18 and weight-to-waist ratio of 0.82 (table 2).
Finally, in 2021, in the population with metabolic syndrome, according to ALAD criteria, a mean waist circumference of 96.50 cm, in addition, a mean hip circumference of 100 cm, a body mass index of 28.20 kg/m2, waist-hip ratio of 0.97, waist-height ratio of 0.58, fat percentage of 28.56 and weight-to-waist ratio of 0.83 (table 3).
Likewise, in the population with metabolic syndrome, according to ATP III criteria, there is evidence of an average waist circumference of 93.87 cm, as well as an average hip circumference of 98.40 cm, body mass index of 28.69 kg/m2, waist-hip ratio of 0.96, waist-height ratio of 0.56, fat percentage of 28.30 and weight-to-waist ratio of 0.83 (table 3).
When analyzing the results of the optimal cut-off points of anthropometric indices that predict the diagnosis of metabolic syndrome, according to the ALAD diagnostic criteria, in 2019, the waist-height ratio (> 0.57) and the waist circumference (> 96) have a bigger area under the curve (AUC: 0.937 and 0.942, respectively), presenting a p-value of < 0.0001 (table 4).
Likewise, in 2020, the waist-to-height ratio (>0,54) and the waist circumference (> 96.5) have a larger area under the curve (AUC: 0.854 and 0.901, respectively), presenting a p-value of < 0.0001 (table 4).
Table 4 Optimal cohort of the anthropometric indices for prediction of metabolic syndrome, according to ALAD criteria, in military personnel.
| Variable | Criteria | AUC | SE | Se | S | Confidence Interval | p |
|---|---|---|---|---|---|---|---|
| Waist_2019 | > 97 | 0.835 | 0.0803 | 100 | 65.99 | 0.788 - 0.875 | < 0.0001 |
| Hip_2019 | > 96 | 0.937 | 0.0391 | 100 | 84.18 | 0.903 - 0.962 | < 0,0001 |
| Fat % _2019 | > 26.81 | 0.917 | 0.04 | 100 | 84.85 | 0.880 - 0.946 | < 0.0001 |
| WHR_2019 | > 0.96 | 0.831 | 0.0826 | 100 | 67 | 0.784 - 0.872 | 0.0001 |
| WHtR_2019 | > 0.57 | 0.942 | 0.0444 | 100 | 82.15 | 0.909 - 0.966 | < 0.0001 |
| BMI_2019 | > 27.97 | 0.891 | 0.052 | 100 | 82.83 | 0.850 - 0.924 | < 0.0001 |
| WWR_2019 | > 0.81 | 0.504 | 0.203 | 66.67 | 60.27 | 0.446 - 0.562 | 0.9845 |
| Waist_2020 | > 95 | 0.823 | 0.0308 | 100 | 65.88 | 0.861 - 0.932 | < 0.0001 |
| Hip_2020 | > 96.5 | 0.901 | 0.0548 | 100 | 82.09 | 0.775 - 0.864 | < 0.0001 |
| Fat % _2020 | > 26.95 | 0.662 | 0.116 | 80 | 61.82 | 0.606 - 0.715 | 0.1631 |
| WHR_2020 | > 0.95 | 0.792 | 0.0658 | 100 | 63.51 | 0.742 - 0.836 | < 0.0001 |
| WHtR_2020 | > 0.54 | 0.854 | 0.0649 | 100 | 59.46 | 0.809 - 0.892 | < 0.0001 |
| BMI_2020 | > 26.35 | 0.774 | 0.0755 | 100 | 58.45 | 0.722 - 0.820 | 0.0003 |
| WWR_2020 | ≤ 0.86 | 0.529 | 0.139 | 100 | 19.93 | 0.471 - 0.587 | 0.8331 |
| Waist_2021 | > 99 | 0.818 | 0.0226 | 100 | 78.54 | 0.766 - 0.863 | < 0.0001 |
| Hip_2021 | > 95 | 0.841 | 0.0276 | 100 | 80.84 | 0.791 - 0.883 | < 0.0001 |
| Fat % _2021 | > 28.14 | 0.826 | 0.0286 | 100 | 80.84 | 0.774 - 0.870 | < 0.0001 |
| WHR_2021 | > 0.95 | 0.733 | 0.0437 | 100 | 65.52 | 0.675 - 0.785 | < 0.0001 |
| WHtR_2021 | > 0.56 | 0.81 | 0.038 | 100 | 74.33 | 0.758 - 0.856 | < 0.0001 |
| BMI_2021 | > 28.01 | 0.83 | 0.0248 | 100 | 81.99 | 0.778 - 0.873 | < 0.0001 |
| WWR_2021 | > 0.81 | 0.658 | 0.0576 | 100 | 57.85 | 0.597 - 0.715 | 0.0061 |
BMI: body mass index, WHR: waist-hip ratio, WHtR: waist to height ratio, WWR: weight to waist ratio, SE: standard error, Se: Sensitivity, S: Specificity, AUC: area under the curve.
Finally, in 2021, the body mass index (> 28.01) and the waist circumference (> 95) have a wider area under the curve (AUC: 0.83 and 0.841, respectively), presenting a p-value of < 0.0001 (table 4)
When analyzing the results of the optimal cut-off points of anthropometric indices that predict the diagnosis of metabolic syndrome, according to the ATP III criteria, in the year 2019, the waist-height index (> 0,55) and the waist circumference (> 93) have a larger area under the curve (AUC: 0,767 and 0,836, respectively), presenting a p-value of < 0,0001 (table 5).
Table 5 Optimal cohort of the anthropometric indices for prediction of metabolic syndrome, according to ATP III criteria, in military personnel.
| Variable | Criteria | AUC | SE | Se | S | Confidence Interval | p |
|---|---|---|---|---|---|---|---|
| Waist_2019 | > 97 | 0.78 | 0.0413 | 80 | 68.57 | 0.729 - 0.825 | < 0.0001 |
| Hip_2019 | > 93 | 0.836 | 0.0347 | 90 | 72.86 | 0.789 - 0.876 | < 0.0001 |
| Fat % 2019 | > 24.89 | 0.735 | 0.0506 | 70 | 68.21 | 0.681 - 0.784 | < 0.0001 |
| WHR_2019 | > 0.93 | 0.709 | 0.055 | 90 | 44.29 | 0.654 - 0.760 | 0.0001 |
| WHtR_2019 | > 0.55 | 0.767 | 0.0478 | 75 | 65.36 | 0.715 - 0.813 | < 0.0001 |
| BMI_2019 | > 27.66 | 0.711 | 0.0594 | 60 | 80.36 | 0.656 - 0.762 | 0.0004 |
| WWR_2019 | > 0.82 | 0.544 | 0.0683 | 50 | 67.86 | 0.485 - 0.601 | 0.5238 |
| Waist_2020 | > 95 | 0.737 | 0.0516 | 78.95 | 57.8 | 0.684 - 0.786 | < 0.0001 |
| Hip_2020 | > 92 | 0.812 | 0.0384 | 78.95 | 72.34 | 0.764 - 0.855 | < 0.0001 |
| Fat % _2020 | > 26.21 | 0.65 | 0.052 | 73.68 | 59.93 | 0.593 - 0.704 | 0.004 |
| WHR_2020 | > 0.93 | 0.752 | 0.044 | 94.74 | 52.48 | 0.699 - 0.800 | < 0.0001 |
| WHtR_2020 | > 0.56 | 0.767 | 0.0472 | 63.16 | 77.66 | 0.715 - 0.814 | < 0.0001 |
| BMI_2020 | > 26.22 | 0.729 | 0.0498 | 84.21 | 58.87 | 0.675 - 0.779 | < 0.0001 |
| WWR_2020 | > 0.82 | 0.514 | 0.066 | 47.37 | 63.48 | 0.456 - 0.572 | 0.8321 |
| Waist_2021 | > 93 | 0.657 | 0.0697 | 93.33 | 33.06 | 0.596 - 0.714 | 0.0244 |
| Hip_2021 | > 89 | 0.717 | 0.0529 | 86.67 | 50 | 0.649 - 0.762 | 0.0001 |
| Fat % 2021 | > 24.69 | 0.708 | 0.0554 | 86.67 | 54.44 | 0.658 - 0.770 | 0.0001 |
| WHR_2021 | > 0.93 | 0.633 | 0.0709 | 73.33 | 49.19 | 0.572 - 0.692 | 0.0599 |
| WHtR_2021 | > 0.54 | 0.65 | 0.0617 | 80 | 57.66 | 0.589 - 0.708 | 0.0149 |
| BMI_2021 | > 26.21 | 0.738 | 0.057 | 93.33 | 56.05 | 0.680 - 0.790 | < 0.0001 |
| WWR_2021 | > 0.81 | 0.601 | 0.0747 | 73.33 | 59.27 | 0.540 - 0.661 | 0.1741 |
BMI: body mass index, WHR: waist-hip ratio, WHtR: waist to height ratio, WWR: weight to waist ratio, SE: standard error, Se: Sensitivity, S: Specificity, AUC: area under the curve.
Likewise, it is evident, according to the 2020 sample, that the waist-height ratio (> 0,56) and the waist circumference (> 92) have a larger area under the curve (AUC: 0.767 and 0.812, respectively), with a p-value of < 0.0001 (table 5).
Finally, in the year 2021, the body mass index (> 26.21) and the waist circumference (> 89) have a wider area under the curve (AUC: 0.738 and 0.717 respectively), however, it presents a p-value of < 0.0001 only in the body mass index, (table 5).
DISCUSSION
It is necessary to mention that there is little information about metabolic syndrome in Latin America, however, in recent years there has been an effort to estimate the prevalence of this condition in Ecuador.8,9
In this study, the average prevalence of metabolic syndrome in the cohort, according to ALAD criteria, was 1.14 %, and according to ATP III criteria, 6.23 %. A similar situation was observed in military personnel from Ambato - Ecuador, where, according to ATP III criteria, 8 % presented metabolic syndrome.9 However, the prevalence is low compared to the 31.2 % observed in the general population in Ecuador.8
It is necessary to mention that according to some studies in the general population, the prevalence of metabolic syndrome in our study is low, a situation evidenced in works from countries such as the United States of America, with a 34.7 % prevalence, Mexico with 50 %, Australia 33.5 %, India 34.32 %, Japan 28.5 %, China 33.2 % and Taiwan 15 % presented this condition.8,11,12
In relation to research in foreign military populations, the prevalence of metabolic syndrome obtained in this study is similar to that evidenced in a meta-analysis carried out by Hosein et al13 ) in which the military personnel presented metabolic syndrome in 8.3 %, and according to APT III criteria in 8 %. Likewise, the prevalence of metabolic syndrome, according to ATP III criteria, in a military population of Iran was 11.1 %.6 However, in another meta-analysis, carried out by Baygi et al4 the prevalence of metabolic syndrome in military personnel is generally 21 %.
Finally, according to this study, the optimal cut-off points for anthropometric indices that predict the diagnosis of metabolic syndrome, according to the ALAD diagnostic criteria, are the waist-to-height ratio (> 0.57, AUC: 0.937) and the waist circumference (> 96, AUC: 0.942) in 2019, waist-for-height ratio (> 0.54, AUC: 0.854) and waist circumference (> 96.5, AUC: 0.901) in 2020, and body mass (> 28.01, AUC: 0.83) and waist circumference (> 95, AUC: 0.841) in the year 2021.
Likewise, the optimal cut-off points of anthropometric indices that predict the diagnosis of metabolic syndrome, according to the ATP III diagnostic criteria, the waist-to-height ratio (> 0.55, AUC: 0.767) and waist circumference (> 93, AUC: 0.836) in 2019, waist-to-height ratio (> 0.56, AUC: 0.767) and waist circumference (> 92, AUC: 0.812) in 2020, and body mass index (> 26.21, AUC: 0.738) and waist circumference (> 89, AUC: 0.717) in the year 2021.
The values of this study are very similar to those observed in a military population in Ecuador, where the optimal cut-off points for waist circumference were 92 cm and for the waist-height index 0.93.9,10
Thus, the values are very similar to those observed in the general population of Asia and Africa, where it is observed that in a population of China, the cut-off point for the waist-to-height ratio was 0.50 in men and the perimeter abdominal was 85 cm.14 Furthermore, in a Cape Town population, the optimal cut-off points for waist circumference were 83.9 cm, waist-for-length ratio 0.50, and body mass index 24.1 kg/m2.15 However, these values differ from those observed in Arab populations, where it is observed in a Saudi Arabian population, the cut-off point for abdominal perimeter was 106 cm, waist-height ratio of 0.55 and BMI of 28 kg/m2.11
The anthropometric indices in a general way significantly predict the development of metabolic syndrome in the military personnel of the “Vencedores del Cenepa” Army Soldier Training School.
The military personnel of the “Vencedores del Cenepa” Army Soldiers Training School, considering the period from 2019 to 2021, is an overweight population, according to the body mass index, however, it presents an abdominal perimeter, triglyceride levels, glucose and blood pressure controls within normal parameters, which explains the low prevalence of metabolic syndrome in this population group.
The prevalence of metabolic syndrome in the military personnel of the "Vencedores del Cenepa" Army Soldier Training School, considering the period from 2019 to 2021, according to the ALAD criteria was 1.14 % and according to the ATP III criteria of the 6.23 %, which is obviously lower compared to the ecuadorian general population.
The anthropometric indices that significantly predict the development of metabolic syndrome in the military personnel of the "Vencedores del Cenepa" Army Soldier Training School, considering the period from 2019 to 2021, according to the ALAD and ATP III criteria, are the perimeter waist, waist-to-size ratio, and body mass index.

