


My SciELO
 Custom services
Services on Demand
Journal

Article
 English (pdf)
 Article in xml format
 Article references
 Send this article by e-mail
Indicators
-
 Cited by SciELO
Related links
-
 Similars in
SciELO
Similars in
SciELO
Share

 Permalink
Revista de Salud Animal
Print version ISSN 0253-570XOn-line version ISSN 2224-4700
Rev Salud Anim. vol.37 no.3 La Habana Sept.-Dec. 2015
ORIGINAL ARTICLE
Genetic relationships between Cuban and Brazilian buffaloes (Bubalus bubalis) by microsatellite markers
Relaciones genéticas entre búfalos (Bubalus bubalis) de Cuba y de Brasil con el uso de marcadores microsatélites
Nadia Martínez MarreroI, Elizabete Cristina da SilvaII, Alina Mitat ValdésIII, Giselle PonceI, Regina C. Benício da SilvaIV, Severino Benone Paes BarbosaIV, Odalys Uffo ReinosaI*, Manoel Adrião Gomes FilhoV
ICentro Nacional de Sanidad Agropecuaria (CENSA). Laboratorio de Genética Molecular. Apartado 10, San José de las Lajas, Mayabeque, Cuba.
IIUniversidade de Brasília (UnB). Faculdade de Agronomia e Veterinária-FAV. Campus Universitário Darcy Ribeiro-CEP: 70910-900. Brasília - DF, Brazil.
IIIUniversidad Agraria de La Habana (UNAH). Facultad de Medicina Veterinaria. Carretera de Tapaste y Autopista Nacional. San José de las Lajas. Mayabeque, Cuba.
IVUniversidade Federal Rural de Pernambuco (UFRPE). Departamento de Zootecnia. Rua Dom Manoel de Medeiros, s/n, Dois Irmãos - CEP: 52171-900. Recife-PE, Brazil.
VUniversidade Federal Rural de Pernambuco (UFRPE). Departamento de Morfologia e Fisiologia Animal. Rua Dom Manoel de Medeiros, s/n, Dois Irmãos - CEP: 52171-900. Recife-PE, Brazil.
ABSTRACT
Researches on genetic relationships among water buffalo populations are useful in supporting conservation decisions and designing of breeding schemes. The aim of this study was to assess the genetic relationships among Cuban Buffalypso/Carabao hybrids and Murrah and Jaffarabadi Brazilian buffaloes using nine cattle microsatellite markers. During the analysis, four loci were excluded due to the presence of null alleles, stuttering and gametic disequilibrium. Mean numbers of alleles and the heterozygosities observed and expected in the three populations were not significantly different. Heterozygosities found were above 60%. All five loci were in Hardy-Weinberg equilibrium. Wright´s index for estimating inbreeding were negative in the three populations. A moderate population differentiation was found among Cuban and Brazilian populations. The AMOVA showed that only 8.3% of the total variation observed occurred among breeds (P<0.05). The multivariate factorial correspondence analysis showed low breed-specific clustering and most of Murrah and Jaffarabadi Brazilian animals plotted overlapping. UPGMA dendrogram obtained from Nei's DA genetic distance differentiated two clusters, one grouped Cuban buffaloes (bootstrap value 89%), and the other included the Brazilian populations (bootstrap value 100%). Bayesian clustering approach reinforced the previous results. The origin of Buffalypso breed and its genetic management in Cuba could be the reason to the moderate differentiation between Cuban and Brazilian populations. This study provided a preliminary analysis on genetic relationships between Cuban and Brazilian buffaloes. The research must be extended to include a higher number of microsatellite loci and buffalo populations from other geographical regions of each country.
Key words: Bubalus bubalis, Buffalypso, microsatellite markers, null allele, genetic relationships.
RESUMEN
Las investigaciones sobre relaciones genéticas entre poblaciones de búfalos de agua son fundamentales para las decisiones relacionadas con la conservación y el diseño de esquemas de mejora. El objetivo de este trabajo fue estimar las relaciones genéticas entre búfalos de Cuba y de Brasil a través de nueve marcadores microsatélites. Se excluyeron del análisis cuatro loci por presencia de alelos nulos, posibles errores de lectura por tartamudeo de las bandas y desequilibrio gamético. No se encontraron diferencias significativas entre las medias del número de alelos y las heterocigosidades observadas y esperadas en las tres poblaciones. Los niveles de heterocigosidad encontrados están por encima del 60%. Los cinco loci se hallaban en equilibrio de Hardy-Weinberg. El índice de Wright para estimar la endogamia de la población fue negativo en las tres. Se estimó una diferenciación moderada entre las poblaciones de búfalos de Cuba y de Brasil. El AMOVA mostró que solo el 8.3% de la variación total observada estaba entre las razas. En el análisis factorial de correspondencia se observó una baja especificidad en el agrupamiento en razas y una ubicación sobrelapada de la mayoría de los animales brasileños. El dendograma UPGMA, a partir de la distancia genética de Nei (DA), mostró dos grupos: uno agrupó a los búfalos cubanos y el otro incluyó a las poblaciones brasileñas. El agrupamiento por métodos bayesianos reforzó los resultados previos. El origen de la raza Buffalypso y su manejo genético en Cuba pueden ser las razones de la moderada diferenciación entre las poblaciones de búfalos de Cuba y de Brasil. Estos resultados constituyen un análisis preliminar de las relaciones genéticas entre búfalos de Cuba y de Brasil. La investigación debe ser ampliada para analizar un mayor número de loci microsatélite, así como para incluir más poblaciones de otras regiones geográficas en cada país.
Palabras clave: Bubalus bubalis, Buffalypso, marcadores microsatélites, alelos nulos, relaciones genéticas.
INTRODUCTION
The water buffalo (Bubalus bubalis) is a versatile species exploited from tropical to temperate regions. Since their domestication 5000 years ago (1), these animals have become important producers of milk, meat, hides and draught animal (2). Nowadays, water buffalo constitute a vital species in the lives of small farmers and the economy of many highly populated countries. According to FAO (http://faostat.fao.org/) statistics (3), there were about 199.8 million buffaloes in the world until 2013, 97.1% of which were in Asia and only 0.7% in the Americas.
Historically, water buffalo has been divided into swamp and river buffalo based on morphological, behavioral and geographical criteria (1). They are sometimes referred to as different subspecies, river as Bubalus bubalis bubalis (21 breeds) (4) and swamp as Bubalus bubalis carabenesis.
The introduction of water buffalo in Cuba was relatively recent, dating from the 80s of last century. Animals of the river breed Buffalypso were imported from Panamá and Trinidad and Tobago Islands (5). Buffalypso is the result of crossbreeding among several Indian breeds such as the Murrah, Surti, Jaffarabadi, Nelli, and Bhadawari (6). This breed was used in Cuba for upgrading the larger population composed of swamp buffaloes (Carabao) imported later from Australia (4, 5). Current herds exceed widely the number of imported animals, which is indicative of their adaptability to existing environmental conditions in the country (5).
Research on genetic diversity and relationships among water buffalo populations provides a useful tool in supporting conservation decisions and designing of breeding schemes. To date, only Acosta et al. (7) analyzed the genetic diversity in Cuban buffalo populations using molecular markers. No work has been published on genetic relationships among Cuban buffaloes and other water buffalo breeds. The aim of this study was to assess the genetic relationships among Cuban Buffalypso/Carabao hybrids and Murrah and Jaffarabadi Brazilian buffaloes using nine cattle microsatellite markers.
MATERIALS AND METHODS
Blood sampling and DNA isolation
Blood and hair samples from 64 Cuban buffaloes (uncontrolled crossbreeds of Carabao and Buffalypso) and 31 Murrah and 26 Jaffarabadi Brazilian water buffaloes were collected from unrelated animals belonging to the respective breeds in their native breeding tract. Cuban samples were collected in Mayabeque province while Brazilian Murrah and Jaffarabadi samples were collected in Alagoas and Pernambuco states, respectively.
Genomic DNA was extracted using Promega Wizard® Genomic DNA purification kit in accordance with the manufacturer's suggested protocol (Promega Corp., Madison, WI).
The quality and quantity of DNA (ng/ìL) for each sample were analyzed using a spectrophotometer (Nanodrop ND1000, Thermo Scientific).
Microsatellite genotyping
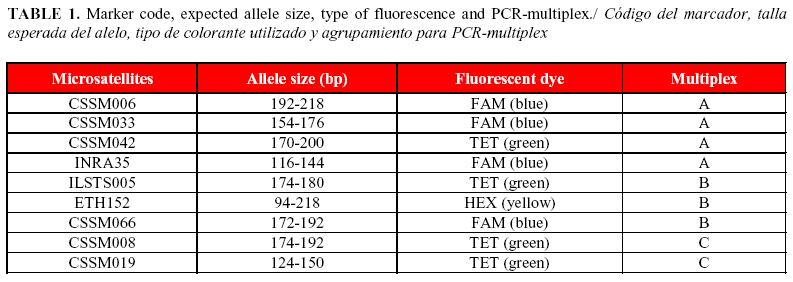
A total of nine heterologous bovine microsatellite marker loci (CSSM006, CSSM008, CSSM019, CSSM033, CSSM042, CSSM066, ETH152, ILSTS005 and INRA35), evaluated for diversity analysis in buffaloes (8, 9), were used to genotype the sampled animals. Amplification of markers was carried out at a final volume of 5 µL using the Master Mix Kit for PCR-multiplex (Qiagen), following manufacturer's instructions, 4.5 ng of genomic DNA and 0.2-0.5µM of each primer. Amplification conditions were as follow: 95°C for 15 min, 35 cycles at 95°C for 5 min, 57°C for 90 s and 72°C for 1 min, followed by a final extension step of 72°C for 30 min. Information regarding expected allele sizes for each marker, fluorescent label and multiplex are shown in Table 1.
Amplified fragments were separated in an automated sequencer (ABI Prism 3100, Applied Biosystems), and the generated data was analyzed with GeneMapper v 4.1 software (Applied Biosystems) for allele and genotype calling. Allelic class determination was carried out using FlexBin v.2.0 software (10).
Statistical analysis
Evidences of null alleles, large allele dropout and scoring errors by stuttering were estimated with MICRO-CHECKER software (11). The null allele frequency (r) was obtained by two methods: Brookfield et al. (12) included in MICRO-CHECKER, and Dempsters et al. (13) EM method implemented in GENEPOP v4.2 (14, 15).
To ensure that all loci were independently segregating within populations, tests of gametic disequilibrium (GD) were conducted for all combinations of locus pairs within populations with GENEPOP v4.2 using exact tests that employ the Markov Chain method to estimate p-values (1 000 dememorization steps, 100 batches and 1 000 iterations). Significance values for multiple tests were adjusted with a sequential Bonferroni correction (16).
Ewens-Watterson test for neutrality was performed with 1 000 simulated samples using the algorithm given in Manly (17), and implemented in POPGENE v 1.31 software package (18).
Polymorphism information content (PIC) was calculated by MICROSATELLITE TOOLKIT v3.1 (19).
Allele frequency, number of alleles (Na), observed heterozygosity (Ho), unbiased expected heterozygosity (uHe), Wright's Fixation Index (FIS, within population inbreeding estimate) and number of private alleles across populations were all obtained with Excell complement GenAlEx 6.5 (20, 21). The number of alleles per locus and observed and expected heterozygosities were compared among populations using the Kruskal-Wallis non-parametric test (22) included in SPSS (SPSS Inc., Chicago IL).
Allelic Richness (Ar) per locus and population were found using FSAT v2.9.3.2 (23).
Deviations from Hardy-Weinberg Equilibrium (HWE) were assed per locus per population also with GENEPOP v4.2 software (14, 15) and the same Markov chain settings used for GD tests. Significance values for multiple tests were adjusted with a sequential Bonferroni correction (16).
Population pairwise values of Wright's Fixation Index (FST, population differentiation), with estimation of significance values based on 1 000 permutations, and analysis of molecular variance (AMOVA) were done with ARLEQUIN v3.5.1.2 (24). Significant values for FST were corrected for multiple tests through sequential Bonferroni correction (16).
Multivariate factorial correspondence analysis (FCA) was used to condense the allelic data and identify the population structure of the three buffalo populations on a 3-D scatter diagram using GENETIX 4.05 software (25).
Nei´s (26) standard, DS, and Nei et al. (27), DA, genetic distances among populations were obtained using POPULATIONS v1.2.31 software (28). Dendrograms were constructed with the same program using Neighbor Joining (NJ) (29) and the UPGMA method (30) for comparison. Bootstrap analyses with 1 000 replicates were used to evaluate the internal consistency of the suggested groupings, as well as the magnitude of the sampling errors. Dendograms were visualized with TREEVIEW 1.6.6 (31).
Population differentiation was also investigated by a Bayesian clustering approach (BCA) using multilocus genotypes, implemented in STRUCTURE v2.3.4 program (32). It assumes Hardy-Weinberg equilibrium and linkage equilibrium between loci within each population. The most probable number of populations (K) given the observed genotypic data was estimated by performing 10 independent runs for each K (1 £ K £ 5) with burn-in length and MCMC iterations of 500 000 and 1000 000, respectively. We used the admixture model and the option of correlated allele frequencies. Sampling locations were used as informative priors for our small data set (33).
The method of Evanno et al. (34) implemented in STRUCTURE HARVESTER (35) was used to identify the most probable K by determining the modal distribution of DK. The different values of the number of clusters (K) were also evaluated using the model choice criterion Ln P (D), which is the posterior probability of the data for a given K. The true number of clusters is commonly inferred as that giving the maximal value of Ln P (D).
RESULTS
Microsatellite markers
All markers were found to be polymorphic in the three populations.
Analysis with MICRO-CHECKER evidenced null alleles at loci INRA35 in Brazilian Murrah and CSSM006 in Cuban Buffalypso/Carabao hybrids. The r obtained for INRA 35 by methods of Brookfield et al. (12) and Dempster et al. (13) were 0.1778 and 0.2058, respectively. In the case of CSSM006, the r was equal to 0.1025 and 0.0839 by the aforementioned methods. There was not evidence for large allele dropout in any locus across the three populations.
Analysis with MICRO-CHECKER also suggested, again in Brazilian Murrah (INRA 35) and Buffalypso/Carabao hybrids (CSSM006), that stuttering might have resulted in scoring errors, as is indicated by the highly significant shortage of heterozygote genotypes with alleles of one repeat unit difference at these loci.
Taking into account our limited resources to make analytical and methodological corrections, and the fact that these errors can contribute to an overestimation of observable alleles, a decrease in observed heterozygosity, an increase in the apparent level of inbreeding (36), and promote an overestimation of genetic differentiation (37), loci INRA35 and CSSM006 were dropped to downstream analysis.
After adjustment for multiple comparisons, tests of GD showed two locus pair namely CSSM008/CSSM066 and CSSM033/CSSM019 in significant GD (P<0.05), in Cuban Buffalypso/Carabao populations. In Brazilian Murrah and Jaffarabadi populations only one locus pair was in significant GD in each, CSSM019/ CSSM033 and CSSM008/CSSM066, respectively. GD creates pseudo-replication for analyses in which loci are assumed to be independent samples of the genome. To avoid increased Type I error, one locus in the pair should be discarded if significant disequilibrium is found consistently between loci (38). Thus, loci CSSM008 and CSSM019 were also excluded from the subsequent analysis.
The Ewens-Watterson neutrality test for each marker suggested that all microsatellite loci studied were neutral and unlinked to any selected trait, because the observed F values were within the upper and lower limits of 95% confidence interval of expected F value.
Marker ILSTS5 exhibited PIC values lower than 0.5 in the three populations. ETH152 and CSSM042 showed the same performance in Buffalypso/Carabao hybrids and Jaffarabadi populations, respectively (Table 2).
Diversity analysis
Across the five studied loci, a total of 88 alleles were found. The total number of alleles per population ranged from 26 in Brazilian Murrah buffaloes to 33 in Cuban Buffalypso/Carabao hybrids. Locus CSSM033 showed the highest Na per locus (12) while ILSTS5 showed the lowest (2). Mean Na values were between 5.2 in Murrah and 6.6 in Buffalypso/Carabao hybrids. Jaffarabadi population exhibited the highest mean Ar (4.880) while Cuban hybrids showed the lowest value (4.367). Mean Ho values ranged from 0.602 ± 0.063 in Cuban buffaloes to 0.684 ± 0.066 in Brazilian Murrah population while mean uHe values were between 0.599 ± 0.060 in Buffalypso/Carabao animals and 0.649 ± 0.067 in Murrah buffaloes (Table 2). The mean number of alleles and mean observed and expected heterozygosities were not significantly different among the three populations. Ten private alleles were identified in two breeds which were distributed among four of the five analyzed loci. Two alleles were unique to Jaffarabadi breed, both with low frequency (1.9%). Cuban Buffalypso/Carabao hibrids exhibited the eight remaining alleles with frequencies range from 0.8 to 10.5%.
The exact test for HWE within populations showed the five loci in equilibrium in the three populations, after a standard Bonferroni correction. The mean value of FIS was negative also in the three populations, indicating no inbreeding (Table 2).
Population differentiation and relationships
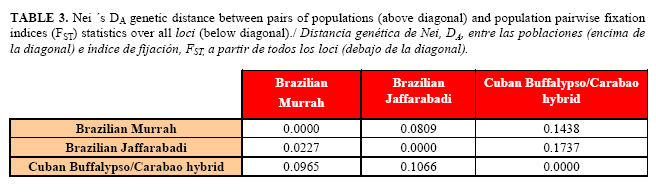
In the FCA, the first three axes together explained only the 20.93% of the overall variability existing among the buffalo individuals. Graphical presentation of FCA plotted some animals of the three populations in an overlapped state and exhibited low breed-specific clustering (Fig. 1). Although the 3D plot indicated close grouping of the three populations, most of Brazilian Murrah and Jaffarabadi buffaloes overlapped and are slightly separated from the majority of Cuban hybrids animals. In Table 3 are shown values of Nei ´s DA genetic distance between pairs of populations and FST over all loci. All pairwise population FST values were significant (p<0.05) after a standard Bonferroni correction. The smallest FST value (0.0227) was observed between Murrah and Jaffarabadi buffaloes. This FST value was below 0.05, indicating low genetic differentiation between these populations (39). The largest FST (0.1066) was obtained between Cuban hybrids and Jaffarabadi buffaloes and indicated only a moderate genetic differentiation between these breeds (39). The AMOVA showed that 92.7% of the total variation was found to be within individuals and the remaining 8.3% was among populations (p<0.05).
Comparing the results obtained using the matrix of DA distance (27) and the matrix DS (26), it can be seen that the former made possible the inference of a more representative dendogram based on UPGMA method than the Neighbor joining. The highest genetic distance, based on the DA distance, was the one found between the Cuban hybrids and Jaffarabadi buffaloes (0.1737), while the Murrah and Jaffarabadi populations were closer to each other (0.0809).The selected dendrogram indicated a separation into two distinct groups (Fig. 2). The first cluster was formed by the Cuban Buffalypso/Carabao hybrid population with bootstrap value of 89%. Another cluster, with a bootstrap value of 100%, included the two Brazilian breeds (Murrah and Jaffarabadi).
To confirm whether the two inferred clusters of buffalo breeds were genetically distinct, BCA was performed. The analysis showed division of genetic variation into two clusters. Fig. 3 shows the proportion of an individual genome from each breed that contributed to each of the two clusters under a model with the highest posterior probability and DK. The Brazilian Murrah and Jaffarabadi animals were almost equally shared in the first cluster (gray), with high membership coefficient, 0.997 and 0.987, respectively. The other cluster (black) had contribution mainly from the Cuban Buffalypso/Carabao hybrid animals, also with high membership coefficient (0.969).
DISCUSSION
Extensive conservation of cattle microsatellite loci in the buffalo genome, as shown by Navani et al. (9) and Nagarajan et al. (40), means that cattle primer pairs can be a very cost effective and time saving resource for genetic diversity studies. In the present work genetic diversity and relationships between Cuban and Brazilian water buffalo populations were estimated using a panel of five cattle microsatellite markers.
Errors in scoring microsatellite data can occur at several steps of the assay, yet standard statistical procedures to mitigate these errors are lacking (41, 42). In this study, two loci showed evidences of null alleles and scoring errors by stuttering. Most of the statistical tools to detect potential scoring errors operate by testing for heterozygote deficiencies, which can be indicative of genotyping errors (43), particularly when identified in only a few loci (44). Demographic or mating system processes such as a Wahlund effect or inbreeding are expected to result in excess homozygosity at all loci, whereas errors due to stuttering, large-allele dropout and null alleles should affect only a subset of loci (36), as occur in this case.
All markers used in this work have a dinucleotide repeat motif. Interpreting patterns at stutter-prone loci becomes particularly difficult in the case of adjacent-allele heterozygotes at loci having a dinucleotide repeat motif (36), it could be the reason for the detection of scoring errors in this study.
Two methods were used to estimate null allele frequencies. Chapuis and Estoup (37) reported the Dempster et al. (13) method provided unbiased and low variance estimates of r compared with Chakraborty et al. (45) and Brookfield (12). However, a study carried out by Kelly et al. (46) revealed that the method of Brookfield (12) produced the most accurate estimates of r compared with Dempster et al. (13), Chakraborty et al. (45) and Van Oosterhout et al. (11). Despite the differences in r values obtained in this investigation by the two methods, they are still considered as high (r > 0.20) and/or intermediate (0.05 < r < 0.20) (37). Ginja et al. (47) reported evidence of null alleles at high frequency at INRA035 among 40 markers across several Portuguese and other exotic cattle breeds. In other research, Acosta et al. (48) using 30 markers to assess genetic diversity and differentiation of five Cuban cattle breeds, also reported locus INRA35 showing an evidence for null alleles with r = 0.4 by the method of Chakraborty et al. (45). In a study using 391 cattle microsatellite markers, Nagarajan et al. (40) informed that 79% of those deviated from HWE in Murrah water buffaloes showed null allele presence.
Even if loci are not linked physically on a chromosome, as occurred in this study, they can be functionally related or under selection to be transmitted as a pair. In the present work, significant GD was detected between some markers in the three populations. Nagarajan et al. (40) studied GD between 525 cattle and buffalo microsatellite markers using a panel of 24 unrelated Murrah buffaloes. In the study, the authors found a substantial level of GD between the markers used, 12.9% of pairs of cattle markers showed significant GD (p<0.05). The authors also analyzed GD for 27 cattle microsatellite markers genotyped on eight different buffalo breeds. The investigation found that 11.4% of marker pairs were significant at p<0.05 in Murrah breed and 27.1% in Jaffarabadi.
Genetic markers showing PIC values higher than 0.5 are normally considered as highly informative in population genetic analysis (49). In this work, three of the markers (ILSTS5, ETH152, and CSSM042) showed PIC values below 0.5, which implied to be moderately informative (0.5 > PIC > 0.25) (50). Nevertheless, these markers had been evaluated for genetic diversity analysis in cattle and buffaloes and are extensively used in research throughout (8, 9, 50, 51, 52, 53, 54).
Heterozygosity value is the most accurate way to measure the genetic diversity of populations (55) and to get an overview of genetic variability (56). Heterozygosity values over 0.5 (50%) indicate a high variation for the loci studied in the populations (57). The mean heterozygosity values (over 0.6) found in this study showed the presence of similar high levels of genetic variability within the three buffalo populations. This result could be explained by the occurrence of low selection pressure due to no application of improvement programs in these three populations. The admixture of genes from various Indian buffalo breeds and Carabao present in Cuban buffaloes, and the crossbreeding between different river buffaloes imported to Brazil, could also support this finding.
Genetic diversity studies of Cuban water buffalo population have started recently in Cuba. Acosta et al. (7) reported means of Na (5.44), He (0.54) and Ho (0.46) lower than those found in this study. They also observed a positive mean FIS value (0.148), indicating inbreeding evidence. It was not found in the present work.
Comparing with some researches using microsatellite markers for Brazilian buffalo genetic diversity analysis, Albuquerque (58) reported CSSM033 and ILST005 with higher and lower Na values, respectively, in Murrah buffaloes. This is in accordance with the present study. This author found a higher mean Na value in Murrah (6.53) than the value found in this study. He value (0.616) was lower and the significant mean FIS values (0.145, p<0.05) indicates inbreeding, different from the not inbreeding evidence obtained in this work. In Jaffarabadi buffaloes, the author found a Na mean (6) almost similar to that exhibited in this study. He value was lower (0.545) and FIS mean significant values (p<0.05) (0.330) also indicates inbreeding. In another study, Marques et al. (59) found lower mean values of Na, He and Ho in Murrah (4.5, 0.593, and 0.514) and Jaffarabadi (4.54, 0.5324, and 0.4756) animals. Significant FIS mean values (p<0.001) in Murrah (0.135) and Jaffarabadi (0.108) was also observed by the authors, again showing differences with the results obtained in this work. Vieira (60) reported slightly higher He (0.709), and lower Ho (0.653) values in Murrah. In Jaffarabadi, both He and Ho were lower than the results of this study, 0.573 and 0.496, respectively.
The high heterozygosity and the absence of inbreeding observed in this Cuban buffalo population guarantee its fitness to the environment and the maintenance of its productive and reproductive levels.
The values of the genetic differentiation between water buffalo populations in the present study are similar to those reported for these (51, 58, 61) and other species (48, 62, 63), where the greatest variability is exhibited within breeds and is independent of the technique used in the analysis.
In this work, a correspondence among the different methods used to assess the genetic differentiation of the studied populations was observed. MacHugh et al. (64) referred that the concordance among different methods to study the genetic differentiation between individuals or populations highlights the robustness of the results.
The genetic relationship showed among Cuban Buffalypso/Carabao hybrid animals and Brazilian breeds could be explained taking into account the origin of Buffalypso breed and its genetic management in Cuba. Cuban animals were expected to share alleles with Murrah and Jaffarabadi buffaloes, as these two breeds contributed to the Buffalypso formation. The contribution made by other Indian riverine breeds to this composite breed, and the uncontrolled mating of Buffalypso animals with Australian Carabao buffaloes, were expected to increase the genetic distance among Cuban hybrids and Murrah and Jaffarabadi Brazilian buffaloes. However, the results showed small genetic distances and an intermediate differentiation between Cuban and Brazilian populations. Interestingly, pairwise FST values between Cuban Buffalypso/Carabao hybrids and each Brazilian buffalo breed are slightly lower than the FST value (0.109) reported by Marques et al. (59) between Murrah and Jaffarabadi Brazilian populations. Vieira (60) also reported higher value of Nei´s DA genetic distance (0.234) between Murrah and Jaffarabadi Brazilian buffaloes than those found in this study among Cuban and Brazilian animals. These results could be related to the reduced number of populations and loci microsatellite analyzed.
Genetic differentiation studies also suggest the occurrence of allele sharing between the Murrah and Jaffarabadi Brazilian buffaloes. As it was explained by Albuquerque (58), in Brazil, the different buffalo groups were subjected to reciprocal crosses, especially Murrah, Mediterranean and Jaffarabadi animals. According to Santiago (65), in 1918, 1920, and 1947, imports of animals with predominance of blood of both Jafarabadi and Murrah, and possible crosses between these breeds might occur. These data are also confirmed by Marcondes et al. (66), which reported that Marajoara breeders held crosses between Murrah and Jafarabadi, disseminating, thus, alleles in common between the breeds. That fact, together with a common Indian origin of these breeds (66, 67), could explain the observed results. However, Albuquerque et al. (68) explained that these alternate crossbreeding did not alter in a significant manner the original gene pool of the Murrah and Jaffarabadi animals which can be considered genetically distinct, despite the existence of shared genetic groups.
CONCLUSIONS
Using five cattle microsatellite markers, the present study provided a preliminary analysis on genetic relationships among Cuban hybrid animals and Murrah and Jaffarabadi Brazilian buffaloes. The obtained results increase the knowledge about the genetic composition of the Cuban buffaloes in order to a better genetic handling of the animals, not only to improve their productive and reproductive traits but also to their conservation. Moreover, to get a more accurate estimate of the genetic relationships among the considered breeds, the research must be extended to analyze a higher number of microsatellite loci as well as to increase the number of populations and their geographical localizations in each country. Besides, there is a need to include Carabao animals and other river buffalo breeds in further studies.
As all microsatellite loci analyzed in this work derivate from cattle, and cross-species amplification in buffalo could possibly lead to ascertainment bias (69), future examinations on buffalo-isolated loci and reciprocal analyses are needed.
ACKNOWLEDGEMENTS
This work was financially supported by the CAPES-MES/CUBA project 128/11 .The authors are grateful to the farmers that donated biological material for the analyses: Ligia Alexandrina Barros da Costa, FazendaRiachão, Sairé, Pernambuco-Brazil e Alberto Coto, FazendaCastanha Grande, Sao Luiz de Queiros, Alagoas-Brazil, and also to Empresa Pecuaria Genética ¨El Cangre¨, in Mayabeque, Cuba. Thanks are also due to Samuel Rezende Paiva, Alexandre Rodrigues Caetano and Maria do Socorro Maués Albuquerque for the donation of the fluorescent microsatellite primers and for allowing use of the ABI Automatic Analyzer. Besides, some researchers and colleagues were fundamental on other collaborations: Ing. Eulogio Padrón, Dr. Patricia Lima and Dr. Georgina Espinosa.
REFERENCES
1. Cockrill WR. The water buffalo: A review. Br Vet J. 1981;137:8-16.
2. Michelizzi VN, Dodson MV, Pan Z, Amaral MEJ, Michal JJ, McLean DJ, et al. Water buffalo genome science comes of age. Int J Biol Sci. 2010;6(4):333-349.
3. FAO Statistics Division (homepage on the Internet). Rome: FAO; 2015 updated 2015 Jan 15; cited 2015 Jan 26: Available from: http://faostat3.fao.org/browse/Q/QA/E.
4. Borghese A, Mazzi M. Buffalo population and strategies in the world. In: A. Borghese, editors. Buffalo Production and Research Rome: FAO 2005; p. 1-40.
5. Mitat A. Búfalos de agua en Cuba. Origen y evolución. Rev ACPA. 2009;3:45-48.
6. Bennett SP, Garcia GW, Lampkin P. The buffalypso: the water buffalo of Trinidad and Tobago. Ital J Anim Sci. 2007;6 (2):179-183.
7. Acosta AC, Uffo O, Sanz A, Obregón D, Osta R, Ronda R, et al.Genetic characterization of Cuban water buffalo population using microsatellite DNA markers. Buffalo Bull. 2014;33(1):101-106.
8. FAO. Molecular genetic characterization of animal genetic resources. In: FAO. FAO Animal Production and Health Guidelines. Rome: FAO 2011; p. 9.
9. Navani N, Jain PK, Gupta S, Sisodia BS, Kumar S. A set of cattle microsatellite DNA markers for genome analysis of riverine buffalo (Bubalus bubalis). Anim Genet. 2002;33:3149-3154.
10.Amos W, Hoffman JI, Frodsham A, Zhang L, Best S, Hill AVS. Automated binning of microsatellite alleles: Problems and solutions. Mol Ecol Notes. 2006;7:10-14.
11.Van Oosterhout C, Hutchinson WF, Wills DPM, Shipley P. MICRO-CHECKER: software for identifying and correcting genotyping errors in microsatellite data. Mol Ecol Notes. 2004;4:535-538.
12.Brookfield JFY. A simple new method for estimating null allele frequency from heterozygote deficiency. Mol Ecol. 1996;5:453-455.
13.Dempster AP, Laird NM, Rubin DB. Maximum likelihood from incomplete data via the EM algorithm. J R Stat Soc B. 1977;39:1-38.
14.Raymond M, Rousset F. GENEPOP (version 1.2): population genetics software for exact tests and ecumenicism. J Heredity. 1995;86:248-249.
15.Rousset F. Genepop'007: a complete reimplementation of the Genepop software for Windows and Linux. Mol Ecol Resources. 2008;8:103-106.
16.Rice WR. Analyzing tables of statistical tests. Evolution. 1989;43:223-225.
17.Manly BFJ, Ed. The statistics of natural selection. London: Chapman and Hall 1985.
18.Yeh FC, Boyle T, Rongcai Y, Ye Z, Xian JM. POPGENE version 1.31. 1999. Available from: http://www.ualberta.ca/-fyeh/fyeh last accessed 18.06.2014.
19.Park S. Microsatellite Toolkit version 3.1. 2001. Available from: http://oscar.gen.tcd.ie/sdepark/ms-toolkit [last accessed 18.06.2014].
20.Peakall R, Smouse PE.GENALEX 6: genetic analysis in Excel. Population genetic software for teaching and research. Mol Ecol Notes. 2006;6:288-295.
21.Peakall R, Smouse PE. GenAlEx 6.5: genetic analysis in Excel. Population genetic software for teaching and research - an update. Bioinformatics. 2012;28:2537-2539.
22.Sokal R, Rohlf FJ, Eds. Biometry. 1981. San Francisco: W.H. Freeman and Co. 1981.
23.Goudet J. FSTAT 2.9.3.2.2002. Available from: http://www.unil.ch/popgen/softwares/fstat.htm. last accessed 03.10.2014.
24.Excoffier L, Laval G, Schneider S. Arlequin version 3.0: An integrated software package for population genetics data analysis. Evol Bioinform. 2005;1:47-50.
25.Belkhir K, Borsa P, Chikhi L, Goudet J, Bonhomme F. GENETIX 4.05 WindowsTMSoftware for Sample Genetics. Laboratoire Genome, Populations, Interactions. University of Montpellier, France, Universite Montpellier II http://www.univmontp2.fr/<«genetix/genetix/genetix.htm //December, 2004.
26.Nei M. Genetic distances between populations. Amer Nat. 1972;106:283-292.
27.Nei M, Tajima F, Tateno Y. Accuracy of estimated phylogenetic trees from molecular data. J Mol Evol. 1983;19:153-170.
28.Langela O. Populations 1.2.28. 2002. Available from: http://wwwcnrsgif.fr/pge/ last accessed 14.09.2014.
29.Saitou N, Nei M. The neighbour-joining method: a new method for reconstructing phylogenetic trees. Mol Biol Evol. 1987;4:406-425.
30.Sneath PHA, Sokal RR. Eds. Numerical Taxonomy. The Principles and Practice of Numerical Classification. San Francisco, CA: W.H. Freeman, 1973.
31.Page RDM. TREEVIEW: An application to display phylogenetic trees on personal computers. Comput Appl Biosci. 1996;12:357-358.
32.Pritchard JK, Stephens M, Donnelly P. Inference of population structure using multilocus genotype data. Genetics. 2000;155:945-959.
33.Hubisz M, Falush D, Stephens M, Pritchard J. Inferring weak population structure with the assistance of sample group information. Mol Ecol Resources. 2009;9(5):1322-1332.
34.Evanno G, Regnaut S, Goudet J. Detecting the number of clusters of individuals using the software STRUCTURE: a simulation study. Mol Ecol. 2005;14:2611-2620.
35.Earl DA, vonHoldt BM. STRUCTURE HARVESTER: a website and program for visualizing STRUCTURE output and implementing the Evanno method. Conserv Genet Resour. 2012;4(2):359-361.
36.Dewoody J, Nason JD, Hipkins VD. Mitigating scoring errors in microsatellite data from wild populations. Mol Ecol Notes. 2006;6:951-957.
37.Chapuis MP, Estoup A. Microsatellite null alleles and estimation of population differentiation. Mol Biol Evol. 2007;24:621-631.
38.Selkoe KA, Toonen RJ. Microsatellites for ecologists: a practical guide to using and evaluating microsatellite markers. Ecol Lett. 2006;9:615-629.
39.Hartl D, Clark A. Principles of population genetics. Massachussets: Sinauer Associates, Inc. Publishers Sunderland. 1997.
40.Nagarajan M, Kumar N, Nishanth G, Haribaskar R, Paranthaman K, Gupta J, et al. Microsatellite markers of water buffalo, Bubalus bubalis - development, characterization and linkage disequilibrium studies. BMC Genet. 2009;10:68-75.
41.Bonin A, Bellemain E, Bronken EP, Pompanon F, Brochmann C, Taberlet P. How to track and assess genotyping errors in population genetic studies. Mol Ecol. 2004;13:3261-3273.
42.Dakin EE, Avise JC. Microsatellite null alleles in parentage analysis. Heredity. 2004;93:504-509.
43.Paetkau D. An empirical exploration of data quality in DNA-based population inventories. Mol Ecol. 2003;12:1357-1387.
44.Gomes I, Collins A, Lonjou C, Thomas NS, Wilkinson J, Watson M, et al. HardyWeinberg quality control. Ann Hum Genet. 1999;63:535-538.
45.Chakraborty R, De Andrade M, Daiger SP, Budowle B. Apparent heterozygote deficiencies observed in DNA typing data and their implications in forensic applications. Ann Hum Genet. 1992;56:45-57.
46.Kelly AC, Mateus-Pinilla NE, Douglas M, Douglas M, Shelton P, Novakofski J. Microsatellites behaving badly: empirical evaluation of genotyping errors and subsequent impacts on population studies. Genet Mol Res. 2011;10(4):2534-2553.
47.Ginja CDA, Gama LT, Penedo MCT. Analysis of STR Markers reveals high genetic structure in Portuguese native cattle. J Hered. 2010;101:201-210.
48.Acosta AC, Uffo O, Sanz A, Ronda R, Osta R, Rodellar C, et al. Genetic diversity and differentiation of five Cuban cattle breeds using 30 microsatellite loci. J Anim Breed Genet. 2013;130:79-86.
49.Botstein D, White RL, Skolnick M, Davis RW. Construction of genetic linkage maps in man using restriction fragment length polymorphisms. Am J Human Genet. 1980;32:314-331.
50.Nagamine Y, Nirasawa K, Takahashi H, Sasaki O, Ishii K, Minezawa M, et al. Estimation of the Time of Divergence between Japanese Mishima Island Cattle and Other Cattle Populations Using Microsatellite DNA Markers. J Heredity. 2008;99(2):202-207.
51.Vijh RK, Tantia MS, Mishra B, Bharni-Kumar ST. Genetic relationship and diversity analysis of Indian Buffalo. J Anim Sci. 2008;86(7):1495-1502.
52.Zhang Y, Dongxiao S, Ying Y, Zhang Y. Genetic variation and divergence among swamp buffalo, river buffalo and Cattle: A microsatellite survey on five populations in China. Asian-Aust J Anim Sci. 2008;21(9):1238-1243.
53.Thivalai C, Sophon S. The study of microsatellite DNA marker in Thai swamp buffalo (Bubalus bubalis). Proceedings of the 3rd International Conference on sustainable animal agriculture for developing countries; 2011: July 26-29; Nakhon Ratchasima, Thailand; 2011. p. 692-695.
54.Joshi J, Salar RK, Banerjee P, Sharma U, Tantia MS, Vijh KR. Comparative evaluation of Murrah breeds with buffaloes of Indo-Gangetic Plains. DHR-IJBLS. 2012;3(1):93-105.
55.Nei M, Kumar S. Oxford University Press, Molecular Evolution and Phylogenetics. New York. 2000.
56.Marson EP, Ferraz JBS, Meirelles FV, Balieiro JCDC, Eler JP, et al. Genetic characterization of European Zebu composite bovine using RFLP markers. Genet Mol Res. 2005;4:496-505.
57.Javanmard A, Asadzadeh N, Banabazi MH, Tavakolian J. The allele and genotype frequencies of bovine pituitary specific transcription factor and leptin genes in Iranian cattle and buffalo populations using PCR-RFLP. Iran J Biotechnol. 2005;3:104-108.
58.Albuquerque MSM. Molecular markers and genetic variability in buffaloes from Brazil. Tese (Doutoradoem Genética). Faculdade de Medicina de Ribeirão Preto, FMRP, São Paulo, Departamento de Genética. 2005: p. 95.
59.Marques JRF, Martínez AM, Costa MR, Albuquerque MSM, Quiroz J, Vega-Pla JL, et al. Genetic diversity of Brazilian buffaloes (Bubalus bubalis) using DNA microsatellites. Arch Zootec. 2011;60(232):1213-1221.
60.Vieira JN. Padronização de painel de microssatélites para testes de identificação genética e de paternidade e caracterização genética da estrutura populacional de búfalos criados no Brasil. Tese de doutorado. Universidade Federal De Minas Gerais. Escola de Veterinária. Departamento de Zootecnia. 2014, 72p.
61.Kumar S, Gupta J, Kumar N, Dikshit K, Navani N, Jain P, et al. Genetic variation and relationships among eight Indian riverine buffalo breeds. Mol Ecol. 2006;15:593-600.
62.Serrano GMS, Egito AA, McManus C, da S Mariante A. Genetic diversity and population structure of Brazilian native bovine breeds. Pesq Agropec Bras. 2004;39(6):543-549.
63.Sollero BP, Paiva SR, Faria DA, Guimarães SEF, Castro STR, Egito AA, et al. Genetic diversity of Brazilian pig breeds evidenced by microsatellite markers. Livest Sci. 2009;123:8-15.
64.MacHugh DE. Molecular biogeography and genetic structure of domesticated cattle, Ph.D. Theses, Dublin University, Ireland. 1996.
65.Santiago AA. Histórico: Fundação, Pioneiros, Importadores, Estudo e Fomento. monograph on the internet. São Paulo: ABCB; 1960 cited 2014 Oct 15: Available from: http//www.bufalo.com.br/info_criador.html.
66.Marcondes CR, Marques JRF, Araújo CV. Estruturação de dados para avaliação genética de bubalinosemrebanhos - Núcleo Pará: Resultados preliminares. Embrapa Amazônia Oriental, Belém, PA. 2011.
67.ABCB (homepage on the Internet). Sao Paulo: ABCB; 2010, cited 2014 Mar 8: Available from: http://www.bufalo.com.br.
68.Albuquerque MMS, Egito AA, Marques JRF, Ciampi Y, Mariante A da S, Castro STR, et al. Variabilidade genética em búfalos estimada por marcadores RAPD. Pesq Agropec Bras. 2006;41:623-628.
69.Ellegren H, Moore S, Robinson N, Byrne K, Ward W, Sheldon BC. Microsatellite evolution- a reciprocal study of repeat lengths at homologous loci in cattle and sheep. Mol Biol Evol. 1997;14:854-860.
Recibido: 10-3-2015.
Aceptado: 3-9-2015.
* Corresponding author: Odalys Uffo Reinosa. E-mail: uffo@censa.edu.cu.

