


Mi SciELO
 Servicios personalizados
Servicios Personalizados
Revista

Articulo
 texto en
  Inglés (pdf)
 Articulo en XML
 Referencias del artículo
 Enviar articulo por email
Indicadores
-
 Citado por SciELO
Links relacionados
-
 Similares en
SciELO
Similares en
SciELO
Compartir

 Permalink
Cultivos Tropicales
versión impresa ISSN 0258-5936versión On-line ISSN 1819-4087
cultrop vol.41 no.3 La Habana jul.-set. 2020 Epub 01-Sep-2020
Original article
Dose and frequency of mineral fertilizer for the establishment of pine plantations in acid soils

1Instituto de Investigaciones del Tabaco (IIT), UCTB Estación Experimental del Tabaco, Finca Vivero. Km 62½ Carretera Panamericana. San Juan y Martínez, Pinar del Río, Cuba
2Instituto de Investigaciones Agro-Forestales (INAF). Calle 174 no. 1723 el l7B y l7C, Reparto Siboney, Playa, La Habana, Cuba
3Universidad de Pinar del Río "Hermanos Saíz Montes de Oca", Avenida José Martí No. 270, Pinar del Río, Cuba, CP 20100
In Cuba there are few studies aimed at recommending doses and frequency of NPK mineral fertilizer for the establishment of forest plantations, these are used incorrectly without taking into account the negative consequences that can result from their application both in excess and in defect. Therefore, the present study studied the response of different doses and frequency of mineral fertilization applied fractionally during the first five years of establishment of a plantation of Pinus caribaea. The research was conducted at the Viñales Agroforestry Experimental Station, Pinar del Río, Cuba. Different doses and frequencies of NPK were investigated, from a randomized block design. Seven treatments were established, differentiated by NPK doses and application regimens, plus a control treatment without fertilization. Measurements of height and diameter were made at different ages with which the volume was determined and followed for 41 years, and the growth functions were estimated by means of multilevel regression. For the entire period it was determined that the applications of 600 g tree 1, 800 g tree-1 and 1000 g tree-1 in alternate or continuous regime (NPK) were superior with respect to the control; treatment of the application of a single dose of 300 g tree-1 (NPK) caused lower values with respect to the control.
Key words: mineral fertilization; quantity; frequency; yield
INTRODUCTION
The beneficial effects of fertilizers on plant biology are well known. However, its incorrect application, both in excess and in defect, can have negative consequences 1).
In Cuba, in the forestry branch and at the production level, the use of chemical fertilizers is minimal and their dosage leaves much to be desired because, at best, it is used tentatively, even before studies and research.
An indigenous conifer of Cuba is Pinus caribaea var. caribaea. Due to its high ecological plasticity and rapid growth - among Cuban pines - it has been widely used in reforestation plans throughout the Cuban archipelago. This tree grows naturally in poorly fertile soils 1.
However, the plantations established in Alitic soils of Low Red and Yellowish Clayey activity in Pinar del Río province, which originally constituted their habitat and they were subsequently marginalized by agriculture, in general, do not correspond to the productive potential of the species, due to low annual increases in timber volume 1.
One of the most critical periods for the development of forest plantations is establishment, during which there is an increasing nutritional demand. Therefore, during this period, fertilization and weed control are used as silvicultural practices 2.
Fertilization stimulates tree growth and makes them more competitive against weeds, which does not prevent adequate control of these 3. The combined action of these two practices should lead to better tree growth; however, the results differ depending on the conditions of each site, as observed in Pinus radiata D. Don, 4,5.
During the 1970s, a series of fertilization experiments were established throughout the country, at the Viñales Agroforestry Experimental Station, in an Alitic soil of Low clayey activity. In this order of ideas, a mineral fertilization experiment was established that contemplated fractional applications of NPK with the objective of determining the best doses and frequencies of NPK mineral fertilizer to obtain high volume yields of wood with bark in plantations established in these soils.
MATERIALS AND METHODS
The experiment was established at the Viñales Forest Experiment Station, which is located between 22º 37´ north longitude and 83º 41´ west longitude and at an elevation of 150 m a.s.l 6.
At the beginning of the plantation, the temperature values were taken from the closest Meteorological Station belonging to Pinar del Río city, according to which the annual average temperature is 24.7 ºC and the daily maximum is 28.7 ºC, the daily minimum of 20.4 ºC and the absolute minimum of 16.2 ºC 7.
The response to fertilization was evaluated in height, diameter and volume at 35 and 41 years 5, the different treatments were compared using ANOVA based on a randomized block design, 6) they studied the response in height and diameter during throughout the period of the experiment, the results were evaluated by determining growth curves with the use of multilevel modeling. It worked with the same data used in these articles to determine the most appropriate doses and frequencies of NPK mineral fertilizer to obtain wood volumes higher than the non-application of fertilizer, using volume growth curves through multilevel modeling.
Experimental design
The experiment gives continuity to a series of measurements made on the same trees since 1971 8, to a fertilization test designed in random blocks with four replicates and eight treatments, established by the Experimental Forestry Station of Viñales that contemplated fractional applications of NPK with formula 8-10-10 (Table 1), tested four doses of mineral fertilizer NPK 300, 600, 800 and 1 000 g tree-1, with two application frequencies in years alternate and continuous.
Table 1 Experimental design
| Treatment | Age (years ) | Total dose | |||||
|---|---|---|---|---|---|---|---|
| Code | 1 | 2 | 3 | 4 | 5 | g tree-1 | kg ha -1 |
| T1. control | 0 | 0 | 0 | 0 | 0 | 0 | 0 |
| T2. 300 | 300 | 0 | 0 | 0 | 0 | 300 | 333 |
| T3. 600 | 200 | 400 | 0 | 0 | 0 | 600 | 667 |
| T4. 600 A | 200 | 0 | 400 | 0 | 0 | 600 | 667 |
| T5. 800 | 200 | 200 | 400 | 0 | 0 | 800 | 889 |
| T6. 800 A | 200 | 0 | 200 | 0 | 400 | 800 | 889 |
| T7. 1000 | 200 | 200 | 400 | 200 | 0 | 1000 | 1111 |
| T8. 1000 A | 200 | 0 | 400 | 0 | 400 | 1000 | 1111 |
A: alternate years
The fertilizer (NPK) was applied in ridges, in the form of a crescent, around the seedlings. These were planted according to the method of hole, it was applied at the beginning of the rainy season in July during the first five years of planting. The origin of the seeds was from the Marbajitas seed mass. The plantation frame was 3 x 3 m. The size of the plots was 225 m2 with a total of 25 trees and nine in the useful plot. Trees in the useful plot were tagged and followed up throughout the trial period.
The experiment was established in 1971 by the Viñales Forestry Experiment Station and fertilizer applications began in this year until 1976.
The soil in which the plantation was established is classified as Ultisols 9) and classified as Alisol and Alitic with Low clayey activity 10,11, with slopes of 4.3 %, derived from quartzite shales and slates. The total depth of the soil is 1.15 m; but, due to the accumulation of clay on horizon B and poor internal drainage, factors that limit root penetration, the effective depth is 20 cm 1.
Dasometric measurements
To evaluate the response of the species to fertilization, the number of live trees ha-1 was calculated, the height and diameter at 1.30 cm of the soil of the trees of the useful plot were measured, with hypsometer and caliper, respectively.
There are measurements from the year 1973 at the age of two years of the trees until 2012 (41 years of age), this work studies the behavior of the main dasometric variables before the different doses and frequencies of the applied mineral fertilizer.
Live trees ha-1: were estimated from the number of live trees in the useful plot.
Height was measured and evaluated at 2, 6, 8, 15, 33, 35 and 41 years of age of the plantation, the number of live trees ha-1 and the diameter at 6, 8, 15, 33, 35 and 41.
Height (h): they were carried out with a graduated ruler up to two years after planting and with a Blume-Leiss hypsometer, when they exceeded five meters.
Diameter (d): with graduated caliper 1.30 m from the ground.
The volumes of wood corresponding to each of the plots were calculated by adding the volumes of the surviving trees, thus the valued volumes reflected the changes in the number of live trees per hectare, which were estimated from the six years of age and were calculated, taking into account the number of live trees per hectare, by Hubert's formula:
where:
Statistical analysis
To estimate the effect of the different doses and the frequency of the mineral fertilizer applied on the growth of the volume variable in individual trees, growth curves were estimated with the use of multilevel modeling 12, the MLwiN version 2.02 program was used. Two levels are defined, repeated measures constitute level 1 nested in individuals, trees, level 2. The general multilevel model is as follows:
where:
Y ij : value of the result variable for instant i in individual j
P explanatory variables X p at level 1 (p = 1 P)
Q explanatory variables Z q at level 2 (q = 1 Q)
u 0j : level 2 random effect
e ij : level 1 errors
The errors e ij are assumed to follow a normal distribution with variance σ2.
Several models are adjusted for the variable volume of wood response, selecting the best one from the deviation values as an indicator of the quality of the adjustment. It works with a significance level of 5 %.
Hierarchical growth models were adjusted where the dependent variable was volume and the independent variables were age and treatments.
Treatments are entered into the model as categorical variables with the reference category being the control (T1). The Mini 2.1 statistical package was used.
Univariate analyzes of variance and multiple comparisons tests of Duncan and Bonferroni were performed for the variable mean annual increase (IMA).
Economic analysis
For the calculation of the economic benefit, only the volume of wood in m3 ha-1 at the age of 41 years of planting was taken into account (Table 2), the cost of fertilizers in CUP ($ 2,800.00), the Fertilizer application cost of $ 81.60 (CUP) and the value of the m3 of wood in bolus ($ 73.30) data taken from 13.
Table 2 Wood volumes (m3 ha-1) by treatments and ages
| Treatments | ||||||||
|---|---|---|---|---|---|---|---|---|
| Age | T1 | T2 | T3 | T4 | T5 | T6 | T7 | T8 |
| 6 | 10.4 | 12.6 | 17.0 | 17.4 | 18.1 | 16.8 | 21.1 | 18.0 |
| 8 | 18.7 | 22.9 | 29.5 | 33.0 | 33.5 | 35.5 | 39.7 | 32.8 |
| 15 | 81.5 | 88.2 | 130.9 | 152.9 | 144.2 | 150.8 | 160.4 | 150.7 |
| 33 | 268.5 | 203.2 | 280.4 | 316.7 | 311.3 | 335 | 347.1 | 324.5 |
| 35 | 314.0 | 293.5 | 373.6 | 395.2 | 369.0 | 442.9 | 436.5 | 426.1 |
| 41 | 381.8 | 364.8 | 505.2 | 518.6 | 524.5 | 563.9 | 544.5 | 527.3 |
The economic benefit was calculated by the formula:
where:
Vn - volumes of wood for treatment n
V0 - volume of wood for the control
C - cost of bolus pine wood (CUP m3)
Cfer - cost of fertilizers (CUP t-1)
The Value/Cost relationship (V/C) was calculated by the following expression 14:
RESULTS AND DISCUSSION
To evaluate the long-term response to applied mineral fertilization according to the established test, the level of response is measured from variables and indicators that measure productive potential in each of the treatments. Then, the comparison between them is established, with emphasis on contrast with the control treatment.
Response to fertilization expressed in volume of wood with bark
All the fertilizer treatments showed significant differences with respect to the control treatment, except for the T2 treatment where a single dose of fertilizer was applied (Table 3) in coincidence with 15, which ensures that the conifers need nutrients to grow and when they do not obtain them at adequate levels, they present problems with their development and growth, due to nutritional imbalances caused by the application of doses below the required levels 8.
Table 3 Descriptive measures for volume per treatment, by age and treatments
| Treatments | ||||||||||
|---|---|---|---|---|---|---|---|---|---|---|
| Age | T1 | T2 | T3 | T4 | T5 | T6 | T7 | T8 | Total | |
| 6 | N | 1019 | 1111 | 1019 | 1080 | 1019 | 1050 | 1080 | 1080 | 1057 |
| Means | 10.78 | 12.56 | 16.98 | 17.35 | 18.11 | 16.80 | 21.13 | 18.03 | 16.47 | |
| SD'S | 4.11 | 4.80 | 3.82 | 3.56 | 4.50 | 7.18 | 5.20 | 4.23 | 5.25 | |
| 8 | N | 895 | 988 | 1019 | 1050 | 957 | 926 | 1019 | 988 | 980 |
| Means | 16.04 | 20.24 | 29.50 | 31.87 | 31.27 | 31.95 | 36.94 | 30.40 | 28.53 | |
| SD'S | 6.47 | 5.62 | 6.12 | 9.24 | 6.29 | 11.85 | 10.57 | 11.82 | 10.17 | |
| 15 | N | 895 | 988 | 1019 | 1050 | 957 | 926 | 1019 | 988 | 980 |
| Means | 81.51 | 88.23 | 130.88 | 152.91 | 144.15 | 150.83 | 160.43 | 150.70 | 132.45 | |
| SD'S | 34.65 | 14.34 | 26.76 | 37.05 | 17.99 | 31.67 | 9.16 | 40.82 | 38.51 | |
| 33 | N | 803 | 834 | 926 | 957 | 833 | 834 | 864 | 895 | 868 |
| Means | 268.50 | 203.17 | 311.29 | 316.66 | 280.45 | 334.97 | 347.10 | 324.55 | 298.33 | |
| SD'S | 34.64 | 52.56 | 27.62 | 31.08 | 50.71 | 104.40 | 2.60 | 34.04 | 62.65 | |
| 35 | N | 710 | 772 | 864 | 833 | 803 | 803 | 834 | 803 | 803 |
| Means | 314.04 | 284.98 | 373.58 | 395.20 | 368.97 | 426.09 | 436.55 | 442.95 | 380.29 | |
| SD'S | 31.66 | 78.66 | 48.76 | 82.34 | 83.46 | 115.46 | 12.36 | 58.74 | 82.88 | |
| 41 | N | 679 | 648 | 864 | 833 | 803 | 772 | 834 | 803 | 779 |
| Means | 381.84 | 364.84 | 492.58 | 555.16 | 505.22 | 527.32 | 544.50 | 563.91 | 491.92 | |
| SD'S | 26.61 | 87.11 | 45.62 | 90.13 | 112.74 | 167.82 | 23.55 | 93.07 | 109.60 | |
| N | 834 | 890 | 952 | 967 | 895 | 885 | 942 | 926 | 7291 | |
| Means | 178.79 | 162.34 | 225.80 | 244.86 | 224.69 | 247.99 | 257.77 | 255.09 | 224.67 | |
| SD'S | 31.26 | 29.29 | 37.68 | 41.93 | 38.65 | 43.99 | 41.45 | 43.77 | 189.81 | |
N: number of trees ha-1, Means: m3 ha-1, SD’S: standard deviation (m3 ha-1)
Model 1 without predictors only estimates the value of the constant. Model 2 includes the speed of growth in volume (age coefficient) and the acceleration of this growth (age coefficient squared) and the term cubed age. The inclusion of these terms significantly increases the quality of the model with a decrease in -2ll of 448.49. Model 3 includes the treatments, in addition to the effects of growth, there is a significant improvement with respect to models 1 and 2 (difference in -2ll 470.89 and 22.4, respectively), no significant differences are seen between the treatment 2 and the witness.
Model 4 was the most explanatory, only age*treatment interactions and terms associated with growth are included. Significant interactions indicate that the rate of growth in volume with age depends on the treatment that the plantation has undergone.
The statistically significant negative sign of the age coefficient*T2 is an indicator that with this treatment, over time the increase in volume is less than that of the control treatment, which is the reference category.
For treatments T3, T4, T5, T6, T7 and T8, among which there are no significant differences in the mean volume (Table 4), it was found that the speed of growth in volume with age was statistically higher than that of the witness treatment.
Table 4 Coefficients resulting from multilevel models for volume (m3 ha-1), per treatments
| Model 1 | Model 2 | Model 3 | Model 4 | |
|---|---|---|---|---|
| Constant | 224.67 | 23.43 | -22.46 | 8.79 |
| Age | 7.101** | 7.101** | 14.89** | |
| Age^2 | 0.168** | 0.168** | -0.589** | |
| Age^3 | 0.014** | |||
| T2 | -16.45NS | |||
| T3 | 47.01* | |||
| T4 | 66.07** | |||
| T5 | 45.91* | |||
| T6 | 69.21** | |||
| T7 | 78.98** | |||
| T8 | 76.30** | |||
| Age *T2 | -1.19NS | |||
| Age *T3 | 2.30** | |||
| Age *T4 | 3.38** | |||
| Age *T5 | 2.10** | |||
| Age *T6 | 3.48** | |||
| Age *T7 | 3.84** | |||
| Age *T8 | 4.074** | |||
| Error U0j | 0.00(0.00) | 1 783.00 | 662.45 | 844.56 |
| eij | 35 841.55 | 2 655.52 | 2655.52 | 1 655.70 |
| -2ll | 2 558.85 | 2 110. 36 | 2087.96 | 2 012.82 |
| R2 | 0.926 | 0.926 | 0.954 | |
| Difference in -2ll | ||||
| With model 1 | 448.49** | 470.89** | 546.03** | |
| With model 2 | 22.4** | 97.54** | ||
| With model 3 | 75.14** |
*p < 0,05 **p < 0,01 NS: Not significant
eij: variance between repeated measures of each plot
Error U0j: variance between plots
R2 Determination coefficient for the level 1 model
The graphic representation of the coefficients of the variables associated with the treatments in model 3 (Figure 1) shows that the treatments T6, T7 and T8 to which doses of 800 and 1,000 g tree-1 of NPK were applied in regime alternate or continuous had better responses in volume of wood in m3 ha-1 than the control treatment.
The T2 treatment to which a single dose of 300 g tree-1 was applied showed lower results for this variable than the control treatment.
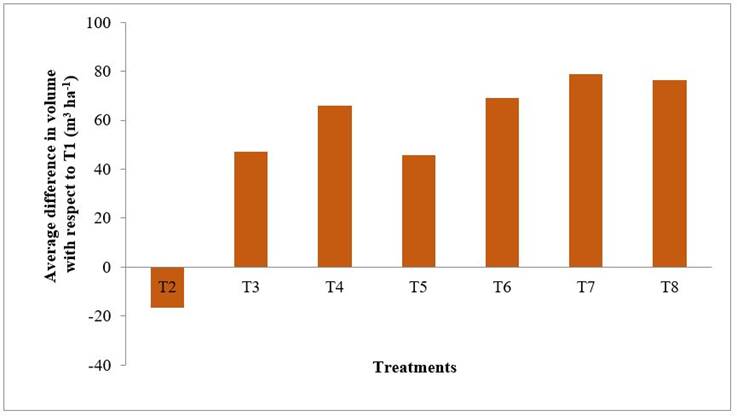
Figure 1 Coefficients of the variables associated with the treatments, for volume, in model 3 (age and treatment covariates)
In general, it is observed that the treatments T6 (800 g NPK tree-1 A), T7 (1, 000 g NPK tree-1 C) and T8 (1 000 g NPK tree-1 A) are in the group of that the greatest differences show in relation to the control, the T7 treatment where it was applied (1,000 g NPK tree-1) in successive years was the treatment where the highest values were reached.
Another author proposes 16 that the persistent effect for long periods of the fertilizers applied to trees in their early stages of development, has been demonstrated in various latitudes and is explained by the establishment of the biogeochemical cycle after canopy closure.
When analyzing the effect of mineral fertilization on the volume corresponding to the T2 treatment, the mean values were lower than the control in the last three measurements (as occurs for the height in 2004, 2006 and 2012 and for the diameter in 2004) 5,6. This shows that with the rational application of nutrients, increases in yields can be obtained.
There is little evidence of responses to nitrogen fertilization to the establishment of P. radiata17; however, it is common to observe a greater growth and homogeneity of the plantation in the first year of growth, in eroded soils of the first rotation of this pine.
Differentiated responses ranging from 2 m3 ha-1 year-1 to 14.5 m3 ha-1 year-1, to the fertilization of P. radiata plantations in different places, at five years of age, have been reported 18.
Studies carried out where they tested fertilization with N and P in Pinus taeda plantations with 240 kg ha-1 of N and 60 kg ha-1 of P in a single dose (without subdivisions), and 60 kg ha-1 of N plus 60 kg ha-1 of P, as fertilization at the time of planting and, after 2 years, 180 kg ha-1 of N (fertilization in different doses until totaling 180 kg ha-1) were added 19.
The authors verified after eight years of measurements, an increase of 93 % in basal area and 39 % in volume. Furthermore, the authors conclude that there were no significant differences between single and quota fertilizations, despite the fact that quota fertilization is more interesting so as not to overburden the initial costs of planting implantation.
Average annual increase in volume
Shapiro Wilk's tests resulted in normality for all years with probabilities greater than 0.190 (Table 5). The results of Duncan's multiple comparison tests are seen in (Figure 2) using the first letters of the alphabet next to the error bars.
Table 5 Results of normality tests for mean annual increases (IMA) in volume
| Year | Statistic | Sig |
|---|---|---|
| 1977 | 0.965 | 0.374 |
| 1979 | 0.954 | 0.191 |
| 1986 | 0.982 | 0.854 |
| 2004 | 0.981 | 0.826 |
| 2006 | 0.979 | 0.765 |
| 2012 | 0.980 | 0.786 |
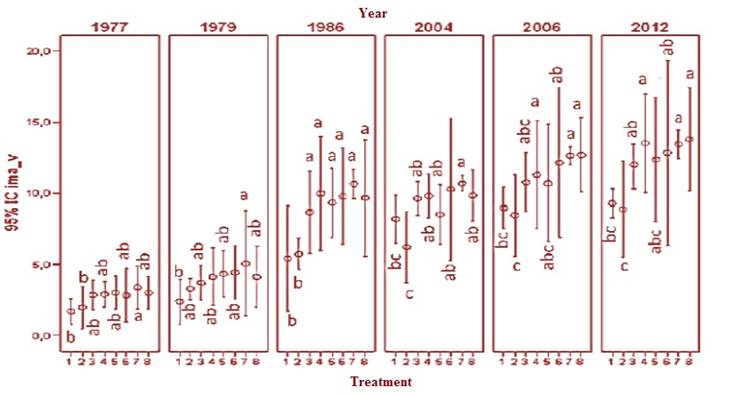
Figure 2 Error bars of the values of the annual mean increases in volume according to the different treatments and ages
When evaluating the evolution over time of the average annual increases in volume according to the different treatments (Figure 2), an increase in volume of more than 3.97 m3 ha-1 year-1 is determined in relation to treatment T1 and T2.
In the latter, where the lowest dose of fertilizer was applied, it was shown that the addition of a small amount of fertilizer only in the first year of life, is not effective for reaching optimal volumes, coinciding with the results obtained 1 who state that when a single initial fertilization is carried out in Alitic soils with low clay activity, there is no response to fertilization.
In 2004, the average annual increases in volume corresponding to the T2 treatment were lower than the control. It was observed that the highest doses of fertilizers applied in successive or alternate years allow the highest volume increases, as occurred for height and diameter 5,6. The T7 treatment (1,000 g NPK tree -1) caused the greatest effects in this growth indicator.
The application of 1,800 g NPK tree-1 (20, divided into four applications in continuous years, is recommended in an experiment established in the same study area. The results obtained in the present work indicate: i) that the fractional application of NPK (complete formulas) in alternate or continuous years allows to increase yields appreciably, and ii) the application of complete formulas is more convenient.
The annual mean increases in average volumes were significantly different in the last three years of evaluation (Figure 2). In all the years evaluated, the treatments where fertilizer doses higher than 300 g tree-1 were applied allowed to obtain increases in higher volumes with respect to T2, in the same way the control treatment behaved where, despite there being no significant differences with in T2, its mean values were 12.3 higher; 4.4 and 3.6 % in the last three years respectively.
In all the years, the T7 treatment where a dose of 1,000 g NPK tree-1 was applied in successive years was the one with the best performance, with appreciable differences in relation to the control and T2, except in 1979 where there were no differences between the treatments. T2 and T7, another author agrees and suggests that mismanagement of the correct dosage, source, timing, or location of the fertilizer (N), and lack of proper balance with other essential nutrients can increase total loss of N (21.
Economic analysis
The treatments T3, T4, T5, T6, T7 and T8 reported positive economic effects, except for treatment T2 where a minimum dose of 300 g tree-1 was applied, in Figure 3 the differences in economic benefit and the value relationship are presented/cost of the treatments with respect to the witness. The gains for the treatments from T3 to T8 are above $ 6,000 ha-1, standing out the T8 treatment with the highest gain, higher than $ 9,992 ha-1, the losses caused in the T2 treatment were less than $ 2,300 ha-1 at 41 years of age of the plantation and the V/C ratios for treatments T3, T4, T5, T6, T7 and T8 were greater than two, a value that, as recommended 14, is acceptable for an investment in fertilization.
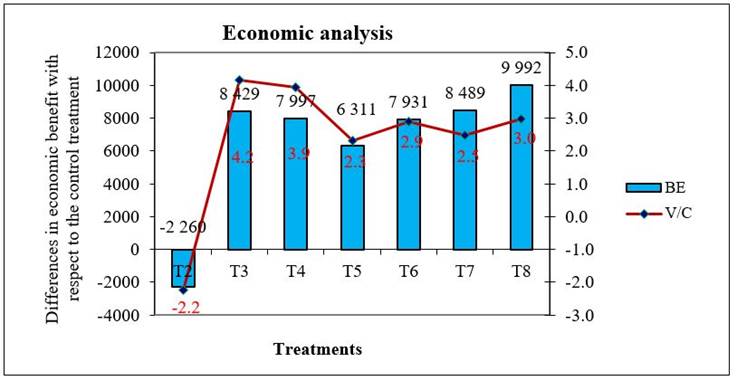
Figure 3 Economic analysis of the experiment on the application of mineral fertilizers in an Alitic soil of Low clayey activity
In general, treatments T3, T4, T6, T7 and T8 were the ones with the best results achieved, highlighting T8 with an economic benefit of more than $ 9,992 ha-1 and a value/cost ratio of more than 2.5. It is important to highlight that the T7 treatment has behaved as the most stable in all the variables evaluated throughout the development process of this work in the economic analysis, despite obtaining a value/cost ratio of 2.5 lower than other treatments. , its economic benefit is greater than $ 8,000 ha-1. Any of these last variants represents an attractive option for silvicultural management, depending on the fertilizer available and the use for which the wood is intended, in order to obtain the maximum yield in volume, as well as the highest profits and the best value / cost ratio 22.
CONCLUSIONS
The results presented have repercussions for the productive practice since they constitute an ecologically sustainable and economically viable way to obtain greater wood productions, in less time and space.
The doses of mineral fertilizer of 600 g tree-1, 800 g tree-1 and 1 000 g tree-1 allowed obtaining volumes of wood with bark superior to the control treatment, the treatment where a single dose of 300 g tree-1 was applied. The treatment resulted in lower yields lower than those achieved by the control treatment.
The treatments from T3 to T8 were those of greater economic benefit with a value/cost ratio equal to or greater than 2.5.
RECOMMENDATIONS
Apply 1,000 g tree-1 of mineral fertilizer (NPK) continuously, fractionated in doses of (200, 200, 400 and 200 g tree-1 in the first four years) for the establishment of P. caribaea plantations in the acid soils in Pinar del Río.
Apply for the establishment of forest plantations, the doses of 600 g tree-1, 800 g tree-1 or 1,000 g tree-1 of mineral fertilizer (NPK), fractionated.
Apply 1,000 g tree-1 of mineral fertilizer (NPK) alternately or continuously for the best economic benefit.
BIBLIOGRAFÍA
1. Herrero G, Muniz O. Nutrición de plantaciones de Pinas Caribaea var. Caribaea: Respuesta a la fertilización y métodos de diagnósticos. 2001. [ Links ]
2. Stevenson MA, McGowan S, Anderson NJ, Foy RH, Leavitt PR, McElarney YR, et al. Impacts of forestry planting on primary production in upland lakes from north-west Ireland. Global change biology. 2016;22(4):1490-504. [ Links ]
3. Venegas R, Palazuelos R. Control químico de malezas arbustivas y arbóreas en plantaciones de Pinus radiata D. Don. Bosque. 1999;20(1):79-88. [ Links ]
4. Reyes-Millalón J, Gerding V, Thiers-Espinoza O. Fertilizantes de liberación controlada aplicados al establecimiento de Pinus radiata D. Don en Chile. Revista Chapingo. Serie ciencias forestales y del ambiente. 2012;18(3):313-28. [ Links ]
5. Reyes Pozo JL, Herrero Echeverría G, León Sánchez MA, Miñoso Bonilla Y, Curvelo Gómez S. Respuesta a la fertilización de plantaciones de Pinus caribaea Morelet var. caribaea Barret y Golfari en su hábitat natural en diferentes edades. 2014; [ Links ]
6. León-Sánchez MA, Reyes-Pozo JL, Herrero-Echevarría G, Pérez-León VE. Efecto de la fertilización sobre el crecimiento en diámetro y altura de Pinus caribaea en plantaciones del occidente de Cuba. Madera y bosques. 2016;22(3):87-101. [ Links ]
7. Awan AB, Frías G. Los suelos de la estación experimental forestal de Viñales, Pinar del Río. Baracoa. 1970;2(1):19-30. [ Links ]
8. Herrero G, González M, Fuentes I, Herrera P, García A, Coto O. Fertilización a Pinus caribaea en su hábitat natural y diversidad vegetal asociada. In Heredia, Costa Rica: Inisefor; 2004. p. 18. [ Links ]
9. Soil Survey Staff. Claves para la Taxonomía de Suelos. 12th ed. Estados Unidos: Departamento de Agricultura de los Estados Unidos Servicio de Conservación de Recursos Naturales; 2014. [ Links ]
10. IUSS Working Group WRB. World Reference Base for Soil Resources 2014, update 2015 International soil classification system for naming soils and creating legends for soil maps. World Soil Resources 2015; Reports No. 106. FAO: Rome; 2014. [ Links ]
11. Hernández J, Pérez J, Bosch I, Castro SN. Clasificación de los suelos de Cuba. San José de las Lajas, Cuba: Ediciones INCA; 2015. [ Links ]
12. Goldstein H. Multilevel statistical models. Vol. 922. John Wiley & Sons; 2011. [ Links ]
13. Hernandez M, Gómez T, Molina J, León MA, Caballero R. Efficiency in forest management: A multiobjective harvest scheduling model. Journal of Forest Economics. 2014;20(3):236-51. [ Links ]
14. FAO. Guía de fertilizantes y nutrición vegetal. Boletín FAO No 9: Fertilizantes y nutrición vegetal. 1986. 198 p. [ Links ]
15. Reyes Pozo JL, León Sánchez MA, Herrero Echeverría G. Fertilización fraccionada en plantaciones de Pinus en suelos alíticos. Publicia; 2017. [ Links ]
16. Reyes JL. Fertilización fraccionada en plantaciones de Pinus caribaea var. caribaea y su impacto sobre algunos indicadores ambientales. Tesis de doctorado. Ciencias Forestales. Facultad de Agronomía y Forestal; 2016. [ Links ]
17. Ojeda H, Rubilar RA, Montes C, Cancino J, Espinosa M. Leaf area and growth of Chilean radiata pine plantations after thinning across a water stress gradient. New Zealand Journal of Forestry Science. 2018;48(1):10. [ Links ]
18. Rodríguez J, Álvarez J. Nutrición y fertilización de las plantaciones forestales. Santiago de Chile: Forestal Mininco SA. 2010; [ Links ]
19. Jokela EJ, Stearns-Smith SC. Fertilization of established southern pine stands: effects of single and split nitrogen treatments. Southern Journal of Applied Forestry. 1993;17(3):135-8. [ Links ]
20. Herrero G, Romeu P, Garcia A, Rivero M, Geigel FB. Efecto de niveles y portadores fosfóricos en el desarrollo de Pinus caribaea var. caribaea II. Suelo Fersialitico Rojo perdusco Ferromagnesial. Centro de Información y Documentación Agropecuario: La Habana, Cuba; 1989. [ Links ]
21. Chinchay LSL. Buenas prácticas agrícolas: uso de los fertilizantes nitrogenados en la minimización de la emisión de gases de efecto. Revista Científica Ingetecno. 2015;4(1). [ Links ]
22. Reyes Pozo JL, León Sánchez MA, Herrero Echeverría G. Influencia de la fertilización mineral sobre la retención de carbono en una plantación de pino. Revista mexicana de ciencias forestales. 2019;10(51):4-22. [ Links ]
Received: March 14, 2019; Accepted: July 30, 2020
 Este es un artículo publicado en acceso abierto bajo una licencia Creative Commons
