Mi SciELO
Servicios Personalizados
Articulo
Indicadores
-
 Citado por SciELO
Links relacionados
-
 Similares en
SciELO
Compartir
Cultivos Tropicales
versión On-line ISSN 1819-4087
cultrop vol.42 no.2 La Habana abr.-jun. 2021 Epub 30-Jun-2021
Original article
Phenotypic stability of new sugar cane cultivars in multi-environmental trials in Holguín
1Estación Provincial de Investigaciones de la Caña de Azúcar (EPICA), Holguín, Cuba
2Instituto de Investigaciones de la Caña de Azúcar (INICA), carretera CUJAE km 1½, Rancho Boyeros, La Habana, Cuba, CP 19390
3Universidad de Granma, carretera Manzanillo, km 17, Bayamo, Granma, Cuba, CP 85 100
For the realization of this work three experiments were established in the Base Bussines Units "Loynaz Hechavarría", "Fernando de Dios" and "Lopez-Peña", where 12 cultivars and two controls were evaluated under rainfed conditions, during October 2010-March 2014 period, they were evaluated the harvest variables (percentage of pol in cane, tons of cane per hectare and tons of pol per hectare), in order to identify cultivars that present general phenotypic stability in different environments in study. Multivariate analysis methods were used to evaluate genotypes, environments and genotype - environment interaction. Use of multivariate model of main effects of genotypes, plus effects of genotype-environment interaction (GEI biplot), from Site Regression Model (SREG) allowed to identify the cultivars the best yield and with general stability in all environments, which were C92-524, C97-445 and C95-416, which also presented a satisfactory phytosanitary behavior under natural conditions. Recommendation the incorporation of same to the varieties projects of Base Business Units of Holguin Sugar Company where they were evaluated.
Key words: pol in cane; yield; genotype-environment interaction
INTRODUCTION
In Cuba, numerous studies have been carried out related to genotype evaluation in different production environments and their implications in improving sugarcane and sugar yields. However, the study of this aspect in Holguín province has not been extensively addressed in recent years, despite the great changes produced in the Cuban sugar industry and the climate. The results of these studies reiterate the importance and significance of the genotype-environment interaction, which points to the necessary multi-environmental evaluation of cultivars during the selection process, mainly in the final stages, as well as after their release in commercial areas 1.
However, the sugar agribusiness reorganization in Cuba and with it the restructuring of the infrastructure for research-development in this sector, led to a reordering of research and experimental network reduction and testing sites for new cultivars which caused little correspondence between the genetic selection environments and the target environments of cultivars 2.
Insufficient knowledge of agro-sugar response of new commercial sugarcane cultivars in towns of Holguín province under rainfed conditions, limits the adequate selection, recommendation and management of these in production environments of this province, so with this study aims to evaluate the response of the cultivars under study recommended in recent years, under rainfed conditions in different locations in Holguín province, and to identify cultivars that present general phenotypic stability for the three variables using the Site Regression method evaluated in the study locations.
MATERIALS AND METHODS
The localities and soil types where the experiments were planted are presented in Table 1. The classification of soils was carried out according to the New Version of the Genetic Classification of Cuban Soils 3. In October 2010, a field experiment was established in each location and they were evaluated until March 2014.
Table 1 Locality and type of soils where the experiments were planted
| UEB | Locality | Soil type |
|---|---|---|
| “Loynaz Hechavarría” (LH) | UBPC Silva 1 | Gley vertic-chromic |
| “Fernando de Dios” (FD) | UBPC Santa Inés | Brown vertic carbonated |
| “López -Peña” (LP) | UBPC Rosell Cruz | Gleyic chromic vertisol in depth |
Basic Economic Unit (UEB)
Cooperative Production Base Unit (UBPC)
Table 2 shows the 14 sugarcane cultivars used in the study, including two controls, most of the cultivars were recommended in recent years for other geographical areas of the country.
Table 2 Sugarcane cultivars used in the study
| Nu. | Cultivar | Nu. | Cultivar | Nu. | Cultivar | Nu. | Cultivar | Nu. | Controls |
|---|---|---|---|---|---|---|---|---|---|
| 1 | C132-81 | 4 | C86-56 | 7 | C90-647 | 10 | C92-524 | 13 | C86-12 |
| 2 | C86-156 | 5 | C89-147 | 8 | C91-356 | 11 | C95-416 | 14 | C86-503 |
| 3 | C86-165 | 6 | C90-530 | 9 | C92-325 | 12 | C97-445 |
The randomized block design with three replications, with plots of 48 m2, was used to set up the experiments. The evaluations were carried out in the plant (P), first shoot (1S) and second shoot (2S) strains at 16, 13 and 12 months of age, respectively. The harvest variables evaluated were the percentage of pol in sugarcane (PPS), tons of sugarcane per hectare (TSH) and tons of pol per hectare (TPH), the phytopathological behavior was also evaluated against brown rust (Puccinia melanocephala H. and P. Sydow) and charcoal (Sporisorium scitamineum (Syd.) M. Piepenbr., M. Stoll & Oberw.), under natural conditions. All experiments were conducted and evaluated, as stipulated in Norms and Procedures of Cuban Sugarcane Breeding Program 4.
Nine environments were used, they refer to the combination of locations and years (strains), a combination commonly used by different authors 5-6 in studies of this type in sugar cane. The original data of the harvest variables were evaluated regarding their normality and variance homogeneity, using Chi-square and Bartlett-Box F tests. It was not necessary to transform the data. For data statistical processing, the Statistica v.8 software was used.
A factorial variance analysis was performed with a fixed effects model to know if there was a genotype-environment interaction and apply phenotypic stability analysis to the harvest variables where the interaction was significant. For this, genotypes, localities and strains were taken as factors, according to the model of Cochran and Cox (1965). The contribution of each of variation sources to the total phenotypic variance was calculated.
To estimate stability, the multivariate model of main effects of genotypes, plus effects of genotype-environment interaction (GEI), of the Site Regression Model (SREG) was used. To present the average behavior and genotype stability in all environments, the biplot was used that shows the average environment, which is obtained by means of coordinate environment mean (represented by a small circle). The ordinate of the average environment is the line that passes through biplot origin and it is perpendicular to the abscissa axis, this line with two arrows indicates greater variability (poor stability) in any direction 7.
The existing information on the rainfall recorded by the pluviometric networks of the Institute of Hydraulic Resources, located in each locality, during the period in which the studies were carried out, as well as the historical series of the period 1995-2013 of each one of these localities.
RESULTS AND DISCUSSION
The results of the factorial variance analysis (Table 3), showed that both the simple factors and their interactions were significant (p≤0.05) for the three harvest variables (PPS, TSH, TPH), which means that genotypes showed different behavior patterns in different strains and localities under study, confirming the genotype interaction existence with the environment and indicates, coinciding with what was proposed by another author 8, that it will be more effective to select the response genotypes specific to each production environment.
In this regard, several authors stated that when the genotype - environment interaction is present, the environment is one of the most influential factors affecting genotype selection 9.
In addition, the predominance of environmental components (percentage extracted from the squares sum of environmental factors such as, locality, strain and their interaction) over the total squares sum, 49.3 % for the percentage of pol in sugar cane, 65 was appreciated. 1 % for TSH and 68.6 % for TPH, similar results reported by other author in multi-environmental studies in Santiago de Cuba province 8.
In a study carried out in seven localities in Venezuela, they stated that the average sugarcane yield was significantly affected by environmental and genotypic effects, which explained 41.16 and 40.67 % of the total sum of squares, respectively 10.
Table 3 Results of factorial variance analysis for the three harvest variables used in the study
| PPS | TSH | TPH | ||||||||
|---|---|---|---|---|---|---|---|---|---|---|
| F.V. | gl | C.M | p | % S.C. | C.M | p | % S.C. | C.M | p | % S.C. |
| G | 13 | 5.0 | 0.000 | 10.7 | 2256.5 | 0.000 | 6.5 | 77.6 | 0.000 | 6.7 |
| L | 2 | 9.4 | 0.000 | 3.1 | 21073.4 | 0.000 | 9.3 | 651.9 | 0.000 | 8.7 |
| Strain | 2 | 52.9 | 0.000 | 17.5 | 12556.7 | 0.000 | 5.6 | 610.1 | 0.000 | 8.1 |
| B/L | 6 | 0.9 | 0.138 | 0.3 | 111.6 | 0.559 | 0.0 | 0.2 | 0.960 | 0.0 |
| GxL | 26 | 1.9 | 0.000 | 8.1 | 1170.2 | 0.000 | 6.7 | 31.4 | 0.000 | 5.4 |
| GxC | 26 | 0.8 | 0.027 | 3.3 | 452.1 | 0.000 | 2.6 | 12.2 | 0.001 | 2.1 |
| LxC | 4 | 43.3 | 0.000 | 28.7 | 56741.9 | 0.000 | 50.2 | 1949.8 | 0.000 | 51.8 |
| GxLxC | 52 | 1.0 | 0.000 | 8.8 | 729.1 | 0.000 | 8.4 | 22.8 | 0.000 | 7.9 |
| Error | 246 | 0.5 | 19.4 | 191.7 | 10.6 | 5.6 | 9.3 | |||
| Total | 377 | |||||||||
| Mean | 17.1 | 71.75 | 12.46 | |||||||
| r² | 0.8 | 0.9 | 0.9 | |||||||
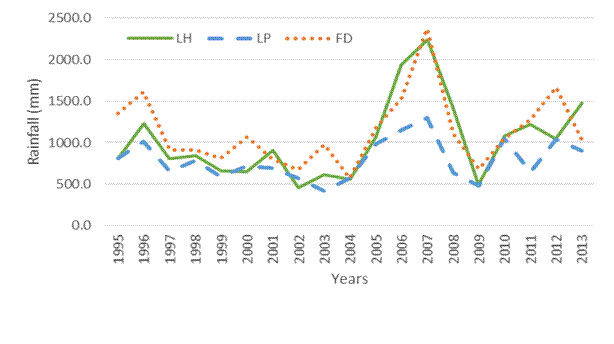
In the specific context of the localities under study, it is very important that certain cultivars behave favorably, since these geographical areas are characterized by insufficient and generally poorly distributed rainfall. When analyzing the historical rainfall behavior in the period 1995-2013 (Figure 1), it can be seen that in "López-Peña" locality throughout the period, annual rainfall was less than 1500 mm, a figure that some indicate authors 11,12, as the water requirement of sugar cane. Similar behavior reached the other locations under study, since "Loynaz Hechavarría" locality only achieved annual rainfall above the figure indicated above, in 2006 and 2007, as did "Fernando de Dios" locality, which in addition to these two years, reached a slight increase in rainfall in 1996 and 2012, however, it was observed that rainfall does not satisfy the water needs of the crop, coinciding with the results achieved by several authors 13 who stated that the highest rainfall values were reached in the region further north of Holguín province, and they demonstrated through climograms that these study locations presented a deficit of moisture in the soil throughout the year, due to high evaporation values and poor accumulated rainfall.

Figure 1 Annual behavior of rainfall for 19 years in the Loynaz Hechavarría, López - Peña and Fernando de Dios localities
Regarding the phytosanitary behavior of cultivars used in the study, it can say that they were not affected by Carbon (Sporisorium scitamineum (Syd.) M. Piepenbr., M. Stoll & Oberw) and Brown rust (Puccinia melanocephala H. and P. Sydow) under natural conditions, which corroborates the results achieved in the state test Carbon for by artificial inoculation and the state test for brown rust with an infection focus, where these cultivars presented multiple resistance to both diseases.
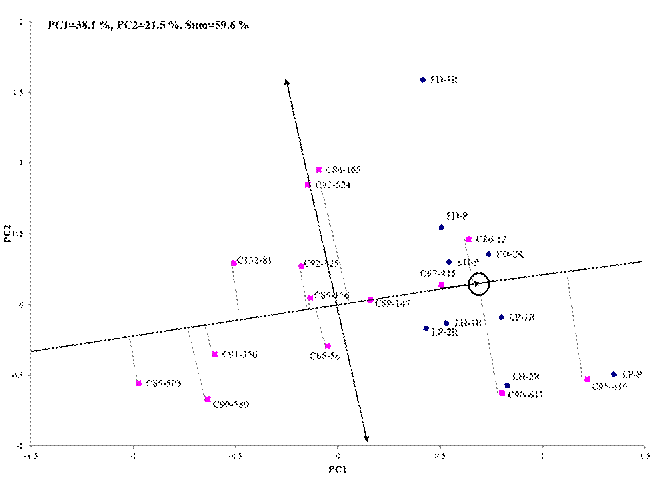
The existence of significant differences in the locality-cultivar-strain interaction justifies SREG model application. The sugar response variability of cultivars in the study environments was confirmed by analyzing the average behavior and stability (Figure 2), the pricipal component 1 (CP1) represents the average PPS of cultivars and the CP2 is related with the genotype-environment interaction, these components as a whole explain 59.6 % of the total variability contained in genotype effects plus the genotype-environment interaction. This percentage is considered adequate to represent the relationships between environments, genotypes and between them through the different two-dimensional representations (biplots) that can be obtained with the Site Regression model 14.
The projections of the genotype markers on the axis that passes through biplot origin and the average environment, obtained from coordinate environment mean, approximate the mean values of the genotypes, so that cultivars appear ordered along axis with the arrow pointing to the highest value. Therefore, when analyzing Figure 2, it is observed that cultivar C95-416 reached the highest average sugar content, followed by C90-647, C86-12 (control), C97-445 and C89-147, however, among them the most stable were the last two. In a study carried out in the southeastern region of Cuba indicated the genotypes C90-647 and C86-12 as the most stable and with a high sugar content 5.
The most unstable cultivars were C86-165, C90-647 and C95-416, since they reached high values of percentage of pol in sugarcane in some environments but were the lowest in others.
The GEI Biplot analysis has been used successfully in phenotypic stability studies in various crops such as soybeans (Glycine max L.) and cotton (Gossypium hirsutum L.). Recently, in a study developed by several authors in different locations in the Himalayan hills 15, with the use of the GEI Biplot, they identified the stable and high-yielding variety of soybean “VLS 89”. Likewise, in a study carried out in eight environments in Brazil where 16 cotton genotypes were used with the aim of determining adaptability and stability using the GEI biplot method, an author refers that two genotypes stood out as the most stable, combining broad adaptation and productivity 16. Another author used the GEI biplot methodology to evaluate the adaptability and stability of melon (Cucumis melo) genotypes in four salinity conditions (environments) 17) and it was able to identify seven salinity-tolerant accessions.
 PC1 and PC2 (Principal components 1 and 2), LH (Loynaz Hechavarría). LP (López - Peña), FD (Fernando de Dios), P (Plant strain), 1R (First shoot), 2R (Second shoot)
Figure 2 Biplot representation of the Site Regression model of the mean behavior and stability of genotypes for PPS
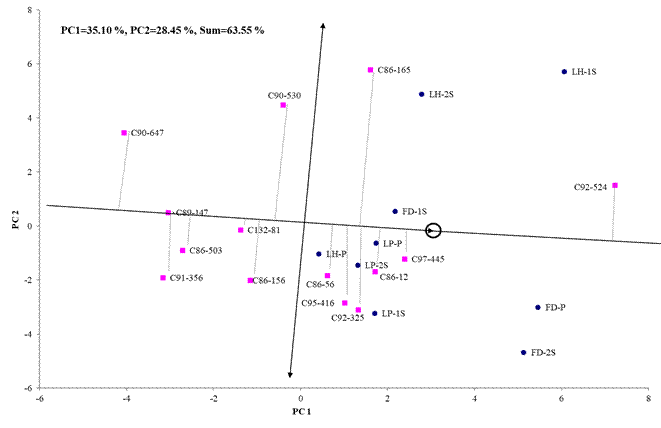
With respect to agricultural yield (TCS), the biplot analysis managed to explain 63.55 % of the total variability contained in the effects of genotypes plus the genotype-environment interaction, in the first two components of the site regression model (Figure 3). Regarding the average behavior and stability of the genotypes in all environments for agricultural performance, the C92-524 genotype stands out with a yield higher than the average of all environments, they were also stable (genotypes closer to the abscissa axis) and with yields close to the average of all environments, genotypes C97-445, C86-12 and C86-56; genotypes C95-416 and C92-325 also achieved above-average yields, but were less stable than the cultivars mentioned above. In a study carried out in different environments of the Matanzas province, some authors reported cultivating C86-56 with good general adaptation in all environments for the variables of agricultural and sugar yield 6.
 PC1 and PC2 (Principal components 1 and 2), LH (Loynaz Hechavarría). LP (López - Peña), FD (Fernando de Dios), P (Plant strain), 1S (First shoot), 2S (Second shoot)
Figure 3 Two-dimensional representation of the Site Regression model of the average behavior and stability of the genotypes for TSH
In the previous figure, it is observed that the C86-165 genotype reached yield close to the average, but was unstable, with good behavior in the sucker strains of the “Loynaz Hechavarría” locality. On the other hand, the cultivars with the highest stability were C89-147 and C132-81, but with lower agricultural yields than the average of the study environments, coinciding with another author who argue that stable genotypes are not necessarily the most productive 18.
A group of authors revealed that the GEI biplot use of the SREG model allowed them to identify the most stable and high-yield genotypes of Michelia chapensis, and confirmed the most representative and discriminative site among the three environments studied in southern China 19.
Several authors used the SREG model to evaluate the stability of eleven maize genotypes grown in six locations in Mexico 20) and concluded that the SREG model is a good tool to evaluate the stability of the yield and quality traits of the grains for nixtamalization process of corn genotypes and allowed to identify the best genotype for recommendation for several localities.
Likewise, they used the GEI biplot analysis to evaluate the wheat yield stability in Iran and identify the best genotypes in each environment 21.
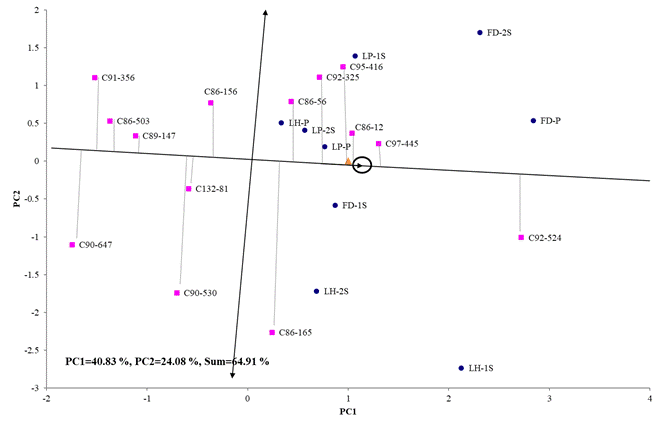
In the case of TPH variable, the genotype effect plus the genotype-environment interaction reached the order of 64.91 % of the total variability, observed in its first two components (Figure 4). The cultivars C97-445, C92-524 and the control C86-12 were the most stable among the genotypes that reached high values of TPH, a variable that represents the sugar yield per unit area, the genotypes C95-416 and C92-325 They also reached sugar yields close to the average of all localities, but their results were more unstable than those mentioned above. The most unstable genotypes were C86-165 and C90-530. In the biplot it is also observed that C91-356, C90-647 and the control C86-503 were the cultivars that presented the lowest average sugar yield.
 CP1 and CP2 (Principal components 1 and 2), LH (Loynaz Hechavarría). LP (López-Peña), FD (Fernando de Dios), P (Plant strain), 1R (First shoot), 2R (Second shoot)
Figure 4 Two-dimensional representation of the Site Regression model of the average behavior and stability of genotypes for TPH
Similar results have been obtained by other authors by using the biplot to identify stable cultivars in different environments; in a study carried out in different environments in Kenya, a group of authors determined the most stable sweet sorghum (Sorghum Moench) genotypes and the genotype that showed general adaptability to all study environments 22. Also by using the GEI biplot, several authors identified the best canola (Brassica napus) genotypes in terms of yield and oil content 23. Likewise, the authors used the GEI Biplot analysis to study the behavior of different forage genotypes in Turkey 24.
CONCLUSIONS
The use os a model SREG using the GEI biplot let to identify and recommend cultivars with stable behavior in all environment under study.
The existence of the genotype-environment interaction was verified in the studied sites and the cultivar C92-524, C97-445 y C95-416 were highlighted, being these the ones that presented phenotypic stability to all environments showing better yields.
BIBLIOGRAFÍA
1. Gilbert RA, Shine Jr JM, Miller JD, Rice RW, Rainbolt CR. The effect of genotype, environment and time of harvest on sugarcane yields in Florida, USA. Field Crops Research. 2006;95(2-3):156-70. [ Links ]
2. García H. Fitomejoramiento Participativo en caña de azúcar, complementación necesaria de la mejora convencional. Propuesta de Proyecto de Investigación. ETICA Villa Clara-Ci enfuegos. INICA. M inisterio del Azúcar. 2007;30. [ Links ]
3. Hernández A, Pérez JM, Bosch D, Rivero L. Nueva versión de clasificación genética de los suelos de Cuba. AGRINFOR, 1999;64. [ Links ]
4. Jorge H, Jorge IM, Mesa JM, Bernal NA. Normas y Procedimientos del Programa de Fitomejoramiento de la Caña de Azúcar en Cuba. Boletín Especial Cuba&Caña. 2011;346. [ Links ]
5. Rodríguez R. Perfeccionamiento del programa de mejora genética de la caña de azúcar para la obtención de nuevos genotipos tolerantes al estrés por sequía. [Tesis de Doctorado].[Cuba]: Instituto de Investigaciones de la Caña de Azúcar; 2010. 140 p. [ Links ]
6. Vidal S. Evaluación de cultivares de caña de azúcar, en su adaptabilidad en diferentes localidades de Matanzas bajo condiciones de secano. Matanzas "Camilo Cienfuegos": Matanzas; 2013. 72 p. [ Links ]
7. Yan W, Tinker NA. Biplot analysis of multi-environment trial data: Principles and applications. Canadian journal of plant science. 2006;86(3):623-45. [ Links ]
8. Abiche W. Estudio de nuevos cultivares de caña de azúcar Saccharum spp.) en tres localidades de la región sur-oriental de Cuba. Oriente. Santiago de Cuba; 2012. [ Links ]
9. Rea R, De Sousa-Vieira O, Díaz A, Ramón M, Briceño R, George J, et al. Genotype-Environment Interaction, Megaenvironments and Two-Table Coupling Methods for Sugarcane Yield Studies in Venezuela. Sugar Tech. 2016;18(4):354-64. doi:10.1007/s12355-015-0407-9 [ Links ]
10. Rea R, De Sousa-Vieira O, Díaz A, Ramón M, Briceño R, George J, et al. Interacción genotipo-ambiente en caña de azúcar mediante los modelos AMMI y regresión de sitios en Venezuela. Rev. Fac. Agron.(LUZ). 2014;31:362-76. [ Links ]
11. Barros A. Caña de Azúcar Saccharum officinarum [Internet]. 2016. Available from: http://campus.fca.uncu.edu.ar/pluginfile.php/31218/mod_resource/ content/0/CA%C3%91A%20DE%20AZUCAR%202016.pdf11. [ Links ]
12. Serrano A. Regionalización de las necesidades hídricas de la caña en áreas de la Empresa "Urbano Noris". Revista Ingeniería Agrícola. 2016;6(1):56-9. [ Links ]
13. Martín-Gutiérrez G, Villazón-Gómez MSJA, Pérez-Correa E, Cobo-Vidal Y, Rodríguez-Ortíz Y. Potencial agroproductivo de los suelos de la Empresa Azucarera de Holguín, Cuba. Hombre, Ciencia y Tecnología. 2015;19(3):32-40. [ Links ]
14. Yan W, Kang MS, Ma B, Woods S, Cornelius PL. GGE biplot vs. AMMI analysis of genotype-by-environment data. Crop science. 2007;47(2):643-53. [ Links ]
15. Bhartiya A, Aditya JP, Kumari V, Kishore N, Purwar JP, Agrawal A, et al. GGE BIPLOT & AMMI analysis of yield stability in multi-environment trial of soybean Glycine max (L.) Merrill] genotypes under rainfed condition of north western Himalayan hills. Journal of Animal and Plant Sciences. 2017;27(1):227-38. [ Links ]
16. Silva RC da. Métodos AMMI e GGE no estudo da interação genótipos x ambientes em algodão. 2016; [ Links ]
17. Ferreira AR. Adaptabilidade, estabilidade e tolerância de acessos de meloeiro à salinidade. 2016; [ Links ]
18. Bornhofen E, Benin G, Storck L, Woyann LG, Duarte T, Stoco MG, et al. Métodos estatísticos para estudo de adaptabilidade e estabilidade em trigo. Bragantia. 2017;76(1):1-10. [ Links ]
19. Wang R, Hu D, Zheng H, Yan S, Wei R. Genotype× environmental interaction by AMMI and GGE biplot analysis for the provenances of Michelia chapensis in South China. Journal of Forestry Research. 2016;27(3):659-64. [ Links ]
20. Vázquez-Carrillo MG, Rojas-Martínez I, Santiago-Ramos D, Arellano-Vázquez JL, Espinosa-Calderón A, García-Pérez M, et al. Stability analysis of yield and grain quality traits for the nixtamalization process of maize genotypes cultivated in the central high valleys of Mexico. Crop Science. 2016;56(6):3090-9. [ Links ]
21. Chinipardaz A, Karimizadeh R, Asghari A, Chinipardaz R, Sofalian O, Ghaffari A. Application of GGE biplot analysis to evaluate grain yield stability of rainfed spring durum wheat genotypes and test locations by climatic factors in Iran. Crop Breeding Journal. 2016;6(2):41-9. [ Links ]
22. Rono JK, Cheruiyot EK, Othira JO, Njuguna VW, Macharia JK, Owuoche J, et al. Adaptability and stability study of selected sweet sorghum genotypes for ethanol production under different environments using AMMI analysis and GGE biplots. The Scientific World Journal. 2016. [ Links ]
23. Ghani G, do Amaral AT, Khalil IA, Khan S, Adnan M, Ur Rahman Z, et al. Biplot analysis of seed yield and oil content combining ability in rapeseed 'Brassica napus' L.). Australian Journal of Crop Science. 2016;10(9):1238. [ Links ]
24. Sayar MS, Han Y. Forage yield performance of forage pea Pisum sativum spp. arvense L.) genotypes and assessments using GGE biplot analysis. Journal of Agricultural Science and Technology. 2016;18(6):1621-34. [ Links ]
Received: May 16, 2019; Accepted: January 26, 2021


 texto en


