


 Serviços customizados
 Inglês (pdf)
 Artigo em XML
 Referências do artigo
 Enviar este artigo por email
 Citado por SciELO
  Similares em
SciELO
Similares em
SciELO 
 Permalink
THE MULTIFACTORIAL MODELS OF VO 2max LIMITATION
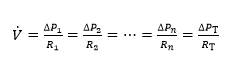
The concept of maximal O2 consumption (VO2max) was created, when it became clear that the relationship between O2 uptake and mechanical power attains a plateau that cannot be overcome despite further power increases, thus implying limitation of VO2max. The discussion on VO2max limitation focused on the identification of a single limiting step for long. Suddenly, the approach changed after Taylor and Weibel resumed the O2 cascade theory to describe O2 transfer from ambient air to mitochondria in mammals. Although they wished to analyse the structural constraints of respiratory systems under maximal stress in animals encompassing a wide range of body size, the seed leading to a new vision of VO2max limitation was implanted. The multifactorial models of VO2max limitation appeared soon afterward.1,2,3,4,5,6,7,8,9,10 di Prampero’s model is a hydraulic model of in-series resistances, relying on the principle that:2
 (1)
(1)
Where  is gas flow (at maximal exercise, VO2max),
  is the pressure gradient sustaining across the
  resistance R and
  is the overall pressure gradient, i.e. the difference between inspired and mitochondrial O2 partial pressure
  . Since
  tends to 0, was set equal to
  is the sum of the pressure gradients across each resistance:
 (2)
(2)
In this case, the fraction of the overall limitation imposed by the / resistance to / is given by:
 (3)
(3)
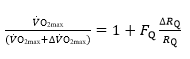
If we analyse a condition wherein only one resistance is varied by an acute manipulation, as occurs for the cardiovascular resistance to oxygen flow after acute blood reinfusion or withdrawal, we obtain a simplified model, described by:
 (4)
(4)
Where  is the fractional limitation to VO2max due to . Equation (4) tells that there is a linear relationship between the ratio of the VO2max before to the VO2max after the manoeuvre (left-hand branch of Equation 4) and the ratio between
  and
and  with y-intercept equal to 1 and slope equal to (Fig.1). A linear solution of the overall oxygen conduction equation would provide
  whereas the data showed
  . This means that i)
 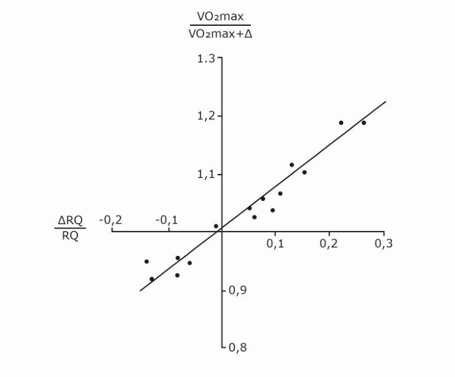 provides 70% of the fractional limitation of VO2max instead of 50 %, and ii) the system has a non-linear behaviour.2 The source of non-linearity was identified in the effects of a non-linear O2 equilibrium curve and this led to exclude that ventilation and lung diffusion limit VO2max in normoxia.3
Fig. 1. Graphical representation of di Prampero’s model. The changes in VO2max that follow an acute manoeuvre acting on the cardiovascular resistance to oxygen flow are expressed as the ratio of the VO2max before to the VO2max after the manoeuvre at stake
  . This ratio is plotted as a function of the ratio between the induced change in
  and the
  before the manoeuvre. Points are mean values from different sources in the literature. The continuous straight line is the corresponding regression Equation (y = 1.006 + 0.7 x, r = 0.97, n = 15). The slope of the line indicates that 70% of the overall limitation to VO2max is imposed by cardiovascular oxygen transport. Modified after di Prampero and Ferretti (1990).
Wagner,10 by combining the mass conservation equation for blood (Fick principle) and the diffusion-perfusion interaction equations of Piiper and Scheid constructed a three-equation system with three unknowns: alveolar arterial
 and mixed venous
 O2 partial pressure.3 At steady state, these equations must provide equal VO2max values. On this basis, he obtained an algebraic solution for and
 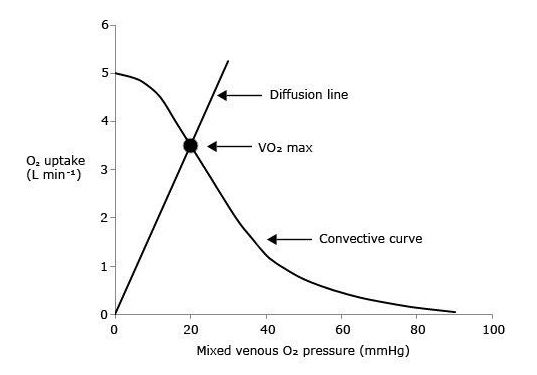 10Wagner’s vision of the O2 cascade implied two mass balance equations responsible for convective O2 transfer, associated with two conductive components, described by the diffusion-perfusion interaction equations. Proximally, the interaction of a convective component with a diffusive component sets the maximal flow of O2 in arterial blood
 . Distally, the interaction of a convective component with a diffusive component (the diffusion-perfusion interaction equation setting O2 flow from peripheral capillaries to the muscle fibres,8 sets VO2max, as reported graphically in figure 2. So, also Wagner focused on what happens distally in the respiratory system.
Fig. 2. Graphical representation of Wagner’s model. O2 uptake (VO2) is plotted as a function of mixed venous O2 pressure ( ). The curve with negative slope is Wagner’s convective curve. The straight line with positive slope is Wagner’s diffusion line, whose slope is equal to Wagner’s constant K
W. The convective curve intercepts the y-axis at a VO2 equal to arterial O2 flow
). The curve with negative slope is Wagner’s convective curve. The straight line with positive slope is Wagner’s diffusion line, whose slope is equal to Wagner’s constant K
W. The convective curve intercepts the y-axis at a VO2 equal to arterial O2 flow  , which is the case when
  . The same curve intercepts the x-axis when
 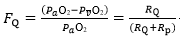 is equal to arterial O2 pressure, which is the case when
  . The VO2max value is found on the crossing of the convective curve with the diffusion line (full dot). After Ferretti (2014).
Although Wagner and di Prampero have different visions of the O2 cascade, their models share a multifactorial vision of VO2max limitation. Both exclude that VO2max may be limited by ventilation and O2 diffusing capacity in healthy humans in normoxia, and focus on what goes on distally to  . If we accept this as an axiom, the simplified version of di Prampero’s model, represented by Equation 4, can be further developed to obtain:
(5) (4.20)
Whence
(6) (4.21)
Where G is conductance. Moreover, using Fick principle, we can demonstrate that:
(7) (4.23)
Whence, because of Equation (5):
 (9) (4.24)
This means that in normoxia is equal to the O2 extraction coefficient!
It follows from what precedes that, if  (y-axis intercept of the convective curve in Figure 2),
  = 1 and
  = 0: all oxygen delivered to peripheral capillaries is consumed by mitochondria. At the other extreme, when VO2max= 0 (x-axis intercept of the convective curve in figure 2, where
  =
=  ,
,  = 0,
= 0,  = 1, and
  = ∞: the diffusive line of figure 2, the slope of which defines Wagner’s constant
  , coincides with the x-axis and no O2 flows from capillaries to mitochondria. All intermediate
  values fall between these two extremes on the convective curve, where it intersects the diffusion line. The lower is , the higher is and the lower is So, these two models agree on the conclusion that both and are necessary determinants of VO2max, the latter being responsible for the larger fraction of the overall VO2max limitation.
VO2max LIMITATION IN BED REST AND SPACE FLIGHT
Nobody doubts that VO2max in upright posture is lower after than before bed rest.(3) The size of the VO2max fall, which is larger the longer is bed rest duration, is fast in the first days, and progressively slower as bed rest proceeds. Thus, the VO2max decline in upright posture after bed rest, as a function of bed rest duration, is non-linear, tending to an asymptote.(4) This is not so during bed rest (or space flight), or in supine posture after bed rest, since very small changes, if any, in VO2max were found in these conditions.(1,6,9)
Ferretti and Capelli assumed an exponential VO2max decay upright as a function of bed rest duration.(4) They clearly identified two components in the VO2max decline, characterised by time constants of 8.4 and 70.7 days, respectively. This means that the distal part of the respiratory system, from arterial blood to mitochondria, includes two capacitances of different size, connected in-series. When an adaptive change affects the overall system, the effects on the smaller capacitance initially prevail, imposing fast changes in VO2max since the first days, leading to an asymptote for the fast component within perhaps three weeks. Thereafter, the effects on the second, larger capacitance prevail, whence a further, albeit slower, VO2max decline. The fast component of the VO2max decrease after bed rest was attributed to (cardiovascular adaptation), whereas the slow component reflects changes in and thus to muscle atrophy.
The fall of VO2max reported by Levine et al in upright posture after a 17-day space flight was not accompanied by changes in VO2max on the same subjects in space.6 They attributed the VO2max decline upon return to the effects of sudden blood volume redistribution toward the lower limbs after gravity resumption, which are stronger after cardiovascular adaptation to microgravity than before. Due to the short duration of the flight, they were unable to highlight the effects of related to muscle atrophy. Yet Trappe et al did, over similar space flight duration:9 we are playing at the boundary of muscle atrophy identification. Moore et al reported a 17% decrease in VO2max after only 15 days in space, which is in contrast not only with theory but also with previous experimental results.7 Hughson et al pointed to cardiac atrophy as source of the VO2max decrease inflight in Moore’s study,5 yet cardiac atrophy is a slow phenomenon, which should not generate a VO2max fall in such a short time. I would suggest that the anti-ergonomic posture in which Astronauts exercise in the International Space Station might artificially reduce VO2max.
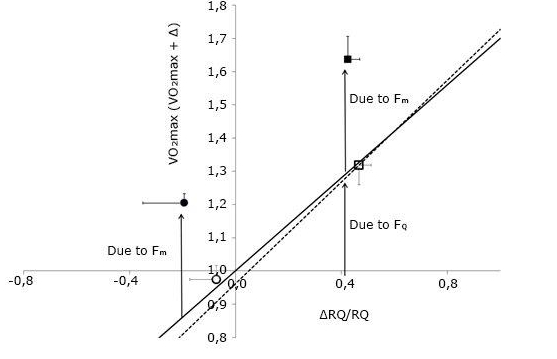
Figure 3 describes the effects of prolonged bed rest in the context of di Prampero’s model, using the data of Bringard.1 The continuous line reports the theoretical value of the model (0.7). The open symbols lying on it refer to the acute manoeuvre of moving from supine to upright, before and after 35-day bed rest. The full dots refer to the overall effect of bed rest, in supine - lower left point - and upright - upper right point - posture. The vertical distance between open symbols and full dots is the same for both postures, indicating that the factor that caused the VO2max decrease supine after bed rest acted by the same extent also in upright posture, resulting independent of posture. Bringard concluded that the upward data shift after bed rest reflects the effects of the change in.(1) According to Wagner’s model, the increase implies a decrease in whereas the increase causes the downward shift of the point, and the consequent slope change of the convective curve.
Fig. 3. The ratio between maximal oxygen consumption (VO2max) before and after a given manoeuvre is plotted as a function of the relative change in the cardiovascular resistance to oxygen flow . The continuous line, with a slope of 0.7, is the theoretical line obtained by di Prampero and Ferretti (1990) after an analysis of the literature. The open symbols concern the effects of postural changes from supine to upright before (open dot) and after (open square) bed rest. The dashed line is experimental and represents the regression equation calculated on the data of Bringard after bed rest (y = 0.76x + 0.96). The slope of the experimental line did not differ significantly from that of the theoretical line. The y-intercept of the experimental line was not significantly different from 1. The filled symbols, located above the experimental line, refer to the effects of bed rest in supine (filled dot) and upright (filled square). Error bars indicate standard error. The arrows highlight the effect on VO2max due to cardiovascular/ and peripheral
limitation. Modified after Bringard(2010).
In conclusion, when an overall adaptive phenomenon modifies the size of the resistances along the entire O2 cascade, the time course of the ensuing VO2max changes is characterised by more than one exponential. If changes are in opposite directions, they may compensate each other: if compensation were complete, no effect on VO2max would be visible. If changes are homodirectional, they are additive and the final effect on VO2max would depend on the ensuing fractional limitation of VO2max imposed by each resistance, or on the intersection of the modified convective curve and diffusion line.

