


 Serviços customizados
 Inglês (pdf)
 Artigo em XML
 Referências do artigo
 Enviar este artigo por email
 Citado por SciELO
  Similares em
SciELO
Similares em
SciELO 
 Permalink
Introduction
The importance of qualified CSF diagnostics has been described many times for the differential diagnosis of neurological diseases of the individual patient.1,2,3,4,5 For this purpose, there is also good laboratory software that combines on-line and off-line data into an integrated report of the patient's findings.3,6,7,8. The graphical representation of the immune response in quotient diagrams (Reibergram) as part of this report5 allows the rapid recognition of typical patterns of disease. The theoretical principles for numerical and graphical evaluation with nonlinear reference range were also reported in detail.9,10,11,12
However, what has hardly been described since then is the statistical evaluation of groups of diseases on this theoretically sound basis for CSF analysis. However, free software programs have been available for some time13 which have recently been expanded. Without such a statistical treatment of patient cohorts, an important research tool would not be available. A knowledge-based quantification of the intrathecal synthesis can be helpful for the comparison of the immune response of different disease groups with controls, but also in clinical studies where the effectiveness of therapeutic measures is important. To improve diagnosis, it may be important to compare the diagnostic sensitivity by the relative intrathecal fractions of different parameters, such as IgG and free light chains.12 As an application in psychiatry,14 it was helpful to exclude an inflammatory cause, e.g., in schizophrenia or bipolar disorders.14
The still frequently used diagnostic interpretation aid, the linear IgG index,15 does not allow to make a trustworthy statistic, this is only possible on the basis of a non-linear, hyperbolic reference range.10,12 For the evaluation with nonlinear reference range, two free software packages for immunoglobulins and for the free light chains Kappa are described in this review.16 The application will be demonstrated by means of two current problems of multiple sclerosis research: The diagnosis of definite MS and clinically isolated syndrome (CIS)17 as well as the analytical sensitivity of free light chain kappa (FLC-K) with that of IgG to detect an intrathecal immune response.12
The numerical and graphical programs for statistics have recently been supplemented by a so-called CSF app, an interpretation software for smartphones.16
Methods
CSF statistics
The intrathecal synthesis in disease groups can be quantitatively characterized and compared by two different methods.
The number of patients with intrathecal synthesis per group
In Fig. 1 the limits of the reference range for IgG are shown in a linear quotient diagram. For the diagnosis the upper limit Qlim of the reference range with Qmean +3SD (s = standard deviation) is used. For statistical purposes, however, it is advisable to refer to an upper limit of the reference range with Qmean +2 SD. The reference range with this upper limit (dashed line in Fig.1) covers only 96% of the controls but results in a higher sensitivity. An example from the software-based calculation for a group of MS patients18 is shown in Table 1 to illustrate the difference in sensitivity and specificity between the two limits. The unit of measurement is either a dimensionless fraction in n/N or in percent n/N x100 [%].
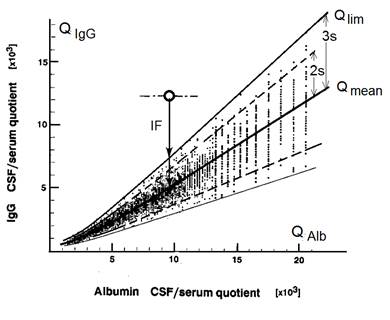
Fig. 1 Hyperbolic reference range of blood-derived proteins in CSF. The linear diagram shows the upper diagnostic limit (Qlim) and the mean function Qmean of the hyperbolic reference range.10 Qlim is defined by QLim (3s) = Qmean + 3 SD. The statistically relevant upper border line (dashed line) is defined by Qlim(2s) = Qmean + 2SD. Differences in the diagnostic sensitivity of the different Qlim lines are shown in Table 1.
Table 1 Reference range related frequency of intrathecal IgG, IgA and IgM synthesis in a group of MS patients
| Reference | IgG | IgA | IgM |
|---|---|---|---|
| Qlim (3s) | 23 | 2 | 6 |
| Qlim (2s) | 28 | 5 | 8 |
| N | 29 | 29 | 29 |
Note: The data originate from an earlier study.18 The cohort of patients with definite MS had an age of 28-29 years at first diagnostic puncture. According to Fig 1 either the diagnostic reference limit QLim = Qmean + 3 s or the statistics reference with Qlim (2s) = Qmean + 2s was used. s = Standard deviation, SD. Calculated with the software, CSF research Tool (http://www.albaum.it).
The mean intrathecal synthesized amount of protein.
For the statistically usable quantification of the mean quantity, the mean value of the reference range Qmean must be referred to. Qmean has the formula in (Eq. 1).
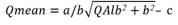 (Eq. 1)
The values for a, b, c depend on the molecule size with examples in Table 2.10,11,12
Table 2 Parameters of the mean hyperbolic reference function for IgG , IgA , IgM10 and free light chain kappa, FLC-K.12
| Parameters | a/b | b2 (x 106) | c (x 103) |
|---|---|---|---|
| QIgG (mean) | 0,65 | 8 | 1,4 |
| QIgA (mean) | 0,47 | 27 | 2,1 |
| QIgM (mean) | 0,33 | 306 | 5,7 |
| QKappa (mean) | 1.95 | 33 | 4,85 |
Note: The parameters chararacterize with s = a/b the slope and the ordinate interval (c) of the asymptote of the hyperbolic functions with the parameters a/b , b2, c.
The interpretation of the intrathecal quantity can refer either to the absolute intrathecal quantity or to the relative fraction of the total concentration in CSF.
Absolute amount synthesized
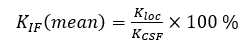
The Qmean related local (intrathecal) synthesis as absolute concentration, e.g. IgGloc (mean) or Kloc (mean) for the Free Light Chain Kappa, is calculated with equation (Eq 2) for each individual patient and then the statistical mean is calculated for the whole collective.
 (Eq. 2)
Relative amount synthesized
For the diagnostic sensitivity of a parameter, the relative proportion of its total cerebrospinal fluid concentration (KCSF), the intrathecal fraction, e.g. IgGIF or KIF, calculated with Eq 3, may be of interest. Here, too, the statistical averaging in the collective for IgGIF(mean) or KIF(mean) is found from the calculated individual values.
Other
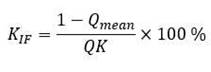 (Eq.3)
Software
The software “CSF research Tool/Reibergrams”13,16 for immunoglobulins calculates the IgGloc (mean) and IgGIF (mean) values for the data transferred from Excel tables and offers their statistical evaluation to a selected group with mean values and coefficients of variation directly (Table 3). This is linked to a number of other statistical evaluations, such as the frequency of a barrier disturbance, etc. With this software, the data are also displayed graphically in rubbing programs (Fig. 2).

Fig. 2 Quantitation of protein data in Quotient diagrams (Reibergrams) for IgG (left) and freelight chains Kappa (right). Filled circles represent patients diagnosed with definite MS. Open circles represent patients initially diagnosed as clinically isolated syndrome (CIS), later diagnosed as definite MS. The data for IgG and FLC-K are from the same kohorts of CIS or MS patients. Corresponding statistics data are shown in Table 3. The graphs are developed with the software “CSF research tool” and “FLC-K statistics and graphic program” (http://www.albaum.it).
Table 3 Statistics data of cohorts of MS and CIS patients. Definite MS is diagnosed according to the Mc Donald criteria
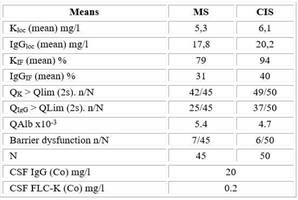
Note: CIS patients have been diagnosed later in the Course of disease as a definite MS. Data were calculated with the free software “CSF research tool” and “FLC-K statistics and graphic program” from http://www.albaum.it
The software “FLC-K statistics and graphic program”16 for Free Light Chains Kappa, which is intended as an extension, calculates the Kloc (mean) and KIF (mean) values for the data taken from Excel tables. After export to Excel tables, the mean values can be calculated. The graphical results are shown in Fig. 2 as a friction program for FLCK.
The “CSF- App”16 was developed for Android-based smartphones. It offers calculation of albumin, IgG, IgA, IgM and FLC-K quotients for a complete CSF data report with graphical results in Reibergrams.5 The Antibody Index calculation for the MRZ -Antibody reaction19 are provided as well. As a tutorial this program offers examples for the possible data interpretations and an archive of immunoglobulin patterns from 15 different neurological diseases with comments for differential diagnosis.
Results
Multiple sclerosis and clinically isolated syndrome
Patients with clinically based suspicion of multiple sclerosis who do not meet the McDonald criteria20 are diagnosed as clinically isolated syndrome (CIS).17 For various authors, the difference between CIS and multiple sclerosis (MS) is associated with the idea of immunological conversion.21 This can be investigated by quantifying the intrathecal immune response in both groups. In addition to the detection of intrathecal IgG, the more sensitive FLC-K analysis in CSF is increasingly used.12,17 However, quantification can also provide the specific information why the quantitative detection of FLCK is more sensitive than that of IgG. The CIS group investigated here represents patients who later became definite MS after initial CIS diagnosis.
By comparing the mean quantitative intrathecal synthesis amount (IgGloc mean and K loc mean in mg/l) between MS and CIS (Table 3) it becomes clear that no significant quantitative differences in the sense of an immunological conversion from CIS to MS can be detected. It rather gives the impression that the CIS group has slightly higher values on average.
With the analysis of the mean intrathecal synthesized fraction (IgGIF(mean) and KIF (mean) in %) we gain a further insight. The mean intrathecal fraction of FLC-K is almost three times larger than for IgGIF (Table 3 and Fig 2). This means that the relative fraction synthesized in the brain has a higher percentage of the total amount in cerebrospinal fluid for FLC-K than for IgG. The use of FLC-K instead of IgG makes a significant difference in diagnostic sensitivity. However, an important prerequisite is to refer to the nonlinear reference range.12
However, we have another analytical criterion, which is the frequency of synthesis in the two groups with reference to the statistical upper limit, Qlim (2s) (Table 3 and Fig 2). For IgG, only 25/45 patients (MS) or 37/50 (CIS) are above the statistically relevant limit ( QIgG > Qlim(2)), whereas for the free light chains 42/45 (MS) or 49/50 (CIS) are above the limit (QK > Qlim (2)). This confirms the theoretically superior sensitivity of FLC-K to IgG for the diagnosis of an inflammatory process. These ratios are documented numerically in Table 3 and graphically in the rubbing programs of Fig. 2.
Conclusion: The quantification of intrathecal protein synthesis provides important information for diagnosis and pathophysiology.
Discussion
Numerical and graphical CSF data presentation
The graphical representation of the immunoglobulin response as part of an integrating CSF data report was introduced to identify at a glance possible disease-typical immunoglobulin patterns.1,5 The “CSF-App”16 offers a collection of such disease-typical patterns with differential diagnostic comments.
The reference range for serum proteins in CSF in the quotient diagrams (Reibergram) is non-linear,10,11,12 i.e. it is characterized by empirically and theoretically based hyperbolic functions (Fig 2). Unless these diagrams are automatically produced with the laboratory software,6,7,8 it is difficult for many users to create such a diagram with a reference range. This has led to the fact that many authors still prefer the evaluation with linear index, although false positive and false negative interpretations are unavoidable.1 In order to remedy this, the stand-alone solutions of the described software programs were developed.16) Data for individual patients as well as for groups of patients can be created in a publication-ready form. The software programs also offer data processing to obtain all diagnostically relevant values (e.g., intrathecal synthesis quantity) numerically. This also raises the question of the statistical use of these data of disease groups. Since not every parameter that can be obtained is suitable for statistical treatment (see Methods), all statistically relevant data are additionally calculated and can be exported as Excel tables for extended statistics.
Reference range for statistics
The limit used in the rubbing programs, Qlim (Fig 1 and 2), provides the highest specificity to diagnose an inflammatory process (smallest number of false positive interpretations). At this limit 99% of the negative controls are integrated in the reference range, but a correspondingly lower sensitivity for inflammatory processes is accepted. In statistics, a variance of only mean ± 1 SD is usually used for group comparisons. A comparison of mean ± 2 SD increases the accuracy for smaller groups or groups with a high analytical imprecision (error propagation in quotients). The reference range for this statistical reference curve selected here (dashed line in Fig 1) still covers 96% of the controls (i.e. only max 2% false positive controls).
Intrathecal fraction
The intrathecal fraction, IF, was introduced to compare the intrathecal synthesis in the quotient diagram of different proteins with different total amounts in serum.10,11 This value was related to Qlim (Fig. 1). These calculations in the Reibergrams represent the theoretical minimum of the intrathecal synthesis of the different immunoglobulin classes. For the statistical comparison of groups, the calculation of mean synthesis quantities must of course be related to Qmean, the group mean value (Fig. 1). From the IF data (Table 3) it is clear that the smaller the normal serum concentration and accordingly the normal CSF concentration is (100-fold difference between IgG and FLC-K), the larger the relative concentration of the intrathecal fraction (Eq.3). This also means that the detection sensitivity for intrathecal synthesis increases (e.g. by almost 3 times the difference between IgG and FLCK in Table 3).
Extended statistics
The individual data for Igloc(mean) or Kloc(mean) calculated in the software can be exported into an Excel table and are thus available for any desired form of statistics with appropriate significance analysis. The “CSF research tool”16 also provides the data for testing the null hypothesis.
It should be noted that only Igloc(mean) and Kloc(mean) values are suitable as absolute concentrations for group comparisons. The IgIF (mean) and KIF (mean) values as relative values are only suitable for parameter comparisons.
Immune response in MS and CIS
The Gold Standard for the detection of an intrathecal IgG synthesis is the qualitative analysis of oligoclonal IgG bands. But this method does not allow a quantitative discrimination between different disease groups like CIS and MS. The quantitative analysis in Quotient diagrams allows to characterize at least the extent of intrathecal synthesis (intrathecal fraction in %) for the individual patient (like dominance of immunoglobulin glasses or difference in IgG, IgA, IgM patterns 1,5). To compare reliably differences or similarities between groups we need statistics. For the chosen example of CIS and MS we get results from which we can conclude that the integration of the intrathecal fractions of FLC-K in the Mc Donald criteria could lead to an earlier more sensitive diagnosis of MS albeit the most specific parameter for detection of an intrathecal immune response, the MRZ antibody synthesis19 is increasingly investigated for MS diagnosis.22

