


Meu SciELO
 Serviços customizados
Serviços Personalizados
Journal

Artigo
 Inglês (pdf)
 Artigo em XML
 Referências do artigo
 Enviar este artigo por email
Indicadores
-
 Citado por SciELO
Links relacionados
-
 Similares em
SciELO
Similares em
SciELO
Compartilhar

 Permalink
Nucleus
versão impressa ISSN 0864-084X
Nucleus no.53 Ciudad de La Habana ene.-jun. 2013
CIENCIAS NUCLEARES
Raman D-band in the irradiated graphene: Origin of the non-monotonous dependence of its intensity with defect concentration
La banda D de Raman del grafeno irradiado: Origen de la dependencia no monótona de su intensidad con la concentración de defectos
Daniel Codorniu Pujals
Instituto Superior de Tecnolog ías y Ciencias Aplicadas (INSTEC)
Avenida Salvador Allende esquinaa Luaces, Plaza de la Revolución, La Habana, Cuba
dcodorniu@instec.cu
ABSTRACT
Raman spectroscopy is one of the experimental techniques more used in studying irradiated carbon nanostructures, in particular graphene, due to its high sensibility to the presence of defects in the crystalline lattice. Special attention has received the variation of the intensity of the Raman D-band of graphene with the concentration of defects produced by irradiation. Nowadays, there are enough experimental evidences about the non-monotonous character of that dependence, but the explanation of this behavior is still controversial. In the present work we developed a simplified mathematical model to obtain a functional relationship between these two magnitudes and showed that the non-monotonous dependence is intrinsic to the nature of the D-band and that it is not necessarily linked to amorphization processes. The obtained functional dependence was used to fit experimental data taken from other authors. The determination coefficient of the fitting was .
Key words: graphene, irradiation, Raman spectroscopy, nanostructures, mathematical models.
RESUMEN
La espectroscopía Raman es una de las técnicas experimentales más usadas en el estudio de las nano-estructuras de carbono irradiadas, en particular del grafeno, debido a su alta sensibilidad a la presencia de defectos en la red cristalina. Una atención especial ha recibido la variación de la intensidad de la banda D de los espectros Raman del grafeno con la concentración de defectos producida por la irradiación. Hoy día hay suficientes evidencias experimentales sobre el carácter no monótono de esa dependencia, pero la explicación de ese comportamiento todavía es polémica. En el presente trabajo se desarrolló un modelo matemático simplificado para obtener una relación funcional entre estas dos magnitudes y se demostró que la dependencia no-monótona es intrínseca a la naturaleza de la banda D y que no está ligada necesariamente a procesos de amorfización. La dependencia funcional obtenida fue utilizada para ajustar datos experimentales obtenidos por otros autores. Se obtuvo un ajuste con un coeficiente de determinación.
Palabras claves: grafeno, irradiación, espectroscopía Raman, nanoestructuras, modelos matemáticos.
INTRODUCTION
Graphene is a very interesting and promising material. Since its obtainment in 2004, a lot of attention has been devoted to the study of the exceptional electronic and physical properties of this two-dimensional nanostructure [1,2] and to the analysis of potential practical applications that cover many different fields from electronics to environmental protection and health [3]. Particularly interesting are the possible applications in biosciences , where there are a lot of ongoing research projects devoted to the use of graphene as the basis for develop DNA sequencing devices, biosensors, etc.[4].In many of the mentioned applications it is necessary or desirable to control the electronic structure and, in particular, the band gap. For this purpose it is possible to follow several approaches. One of them is the chemical functionalization of graphene, but another very important way is the controlled introduction of defects through its irradiation with different kind of particles. This alternative is being explored experimentally, as well as theoretically, by several groups around the world [5-8]. In the efforts devoted to understand the behavior of graphene under particle bombardment, an special role is played by Raman spectroscopy, a powerful technique that have been applied for several decades to the characterize of carbon bulk structures and nanostructures. The special usefulness of Raman spectroscopy in the study of irradiated graphene, graphite and carbon nanotubes is related with the so-called D-band, that only exists in the Raman spectra of these materials in case lattice defects or other kind of disorder [9]. The sensibility of this technique to the modifications to and defects in the lattice of carbon structures have been used to studied amorphization processes in graphite and other carbonaceous materials [10].An important experimental parameter in the study of the irradiated samples of graphite and carbon nanostructures is the ratio of the intensities of D-band and the G-band . The G-band is the main first order line in graphene spectra and it is not linked to the existence of defects [11]. Already in the seventies of the last century, it was clear that the ratio is strongly dependent of the concentration of defects in the crystal lattice. In 1970, Tuinstra and Konig [12] proposed for graphite ![]() the relationship
the relationship ![]() where
where ![]() is the defect concentration 1. Nevertheless, the experimental studies of irradiated graphene performed in the last years have shown that the Tuinstra-Konig relation is not applicable in those cases, and that the
is the defect concentration 1. Nevertheless, the experimental studies of irradiated graphene performed in the last years have shown that the Tuinstra-Konig relation is not applicable in those cases, and that the ![]() ratio exhibits a non-monotonous behavior, i.e. for small concentration of defects the ratio increases with the concentration of defects, but after a critical concentration it begins to decrease [7,13,14]. The authors of those papers explained the decreasing of the ratio by the existence at high defect concentrations of very distorted zones in the lattice, where the material is no more crystalline but amorphous. They followed a theory developed in 2000 by Ferrari and Robertson [10] for the evolution of Raman spectra of graphite from pristine to amorphous samples, not directly related to irradiation processes. In that paper was reported by the first time the non-monotonous variation of
ratio exhibits a non-monotonous behavior, i.e. for small concentration of defects the ratio increases with the concentration of defects, but after a critical concentration it begins to decrease [7,13,14]. The authors of those papers explained the decreasing of the ratio by the existence at high defect concentrations of very distorted zones in the lattice, where the material is no more crystalline but amorphous. They followed a theory developed in 2000 by Ferrari and Robertson [10] for the evolution of Raman spectra of graphite from pristine to amorphous samples, not directly related to irradiation processes. In that paper was reported by the first time the non-monotonous variation of ![]() with the concentration.In spite of the fact that in many irradiation processes the sample gets some kind of amorphization, this is not always true, especially when the bombarding particles are electrons or protons with energies of several keV [15]. Besides that, in the zone of medium concentration of defects, when the ratio
with the concentration.In spite of the fact that in many irradiation processes the sample gets some kind of amorphization, this is not always true, especially when the bombarding particles are electrons or protons with energies of several keV [15]. Besides that, in the zone of medium concentration of defects, when the ratio ![]() begins to decrease with
begins to decrease with ![]() the cited papers do not give enough evidence of the existence of amophization.Therefore, it is worth to obtain the theoretical dependence of the ratio
the cited papers do not give enough evidence of the existence of amophization.Therefore, it is worth to obtain the theoretical dependence of the ratio ![]() with
with ![]() in order to elucidate whether the observed behavior is present there or it requires additional mechanisms as ,for example, amorphization, for its explanation. This was the main goal of the research reported in this paper.Development of the modelIn order to obtain a mathematical expression for the ratio,
in order to elucidate whether the observed behavior is present there or it requires additional mechanisms as ,for example, amorphization, for its explanation. This was the main goal of the research reported in this paper.Development of the modelIn order to obtain a mathematical expression for the ratio, ![]() it is necessary to consider the differences in the mechanisms that produce each band. As it was mentioned above, the G-band is the only first order Raman process allowed by the selection rule
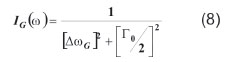
it is necessary to consider the differences in the mechanisms that produce each band. As it was mentioned above, the G-band is the only first order Raman process allowed by the selection rule ![]() =0 [9, 11]. On the other side, due to the conical form of the energy bands in the graphene (Dirac cones) and to the absence of gap, all the Raman lines in graphene are resonant. It is well established in the literature [9,11] that the G band is a typical Raman resonant line described by a Lorentzian function, as follows:
=0 [9, 11]. On the other side, due to the conical form of the energy bands in the graphene (Dirac cones) and to the absence of gap, all the Raman lines in graphene are resonant. It is well established in the literature [9,11] that the G band is a typical Raman resonant line described by a Lorentzian function, as follows:
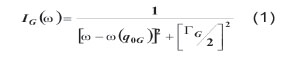
where ![]() is the frequency at the center of the G-band and
is the frequency at the center of the G-band and ![]() is the G-line width.The nature of the D-band is totally different. In fact, it is linked with phonons whose wavevectors are far from the center of the Brillouin zone and, consequently, they are forbidden by the selection rule . Thomsen and Reich [16] explained the existence of this band in the Raman spectra of graphite by a double resonance process, in which the excited electron is scattered first by a phonon and then by a lattice defect.The double resonance process is represented in the figure 1a. First , an electron with wavevector k in the valence band (p), near of the Dirac point K, is excited by the laser to the conduction band , i.e. an electron-hole pair is created (step 1); then the excited electron is scattered by a phonon, acquiring a wavevector k+q and passing to the Dirac cone near to the point
is the G-line width.The nature of the D-band is totally different. In fact, it is linked with phonons whose wavevectors are far from the center of the Brillouin zone and, consequently, they are forbidden by the selection rule . Thomsen and Reich [16] explained the existence of this band in the Raman spectra of graphite by a double resonance process, in which the excited electron is scattered first by a phonon and then by a lattice defect.The double resonance process is represented in the figure 1a. First , an electron with wavevector k in the valence band (p), near of the Dirac point K, is excited by the laser to the conduction band , i.e. an electron-hole pair is created (step 1); then the excited electron is scattered by a phonon, acquiring a wavevector k+q and passing to the Dirac cone near to the point ![]() (step 2). After that, the electron is scattered by a lattice defect, that absorbs the wavevector q (step 3). Finally the electron goes back to the valence band and recombines with the hole (step 4). The Feynman diagram corresponding to that process is represented in figure 1b.
(step 2). After that, the electron is scattered by a lattice defect, that absorbs the wavevector q (step 3). Finally the electron goes back to the valence band and recombines with the hole (step 4). The Feynman diagram corresponding to that process is represented in figure 1b.

Due to the double resonance process, the mathematical expression that describes the intensity of the D band in graphene is rather complicated [17]. For the purposes of this work we can use a simplified expression taken from [11].
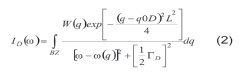
where W (![]() ) is a factor that contains the matrix elements of the transitions ocurring during the double resonance processes, L is the average distance between defects,
) is a factor that contains the matrix elements of the transitions ocurring during the double resonance processes, L is the average distance between defects, ![]() is the wave vector corresponding to the maximum of the D-line and
is the wave vector corresponding to the maximum of the D-line and ![]() the line width. The integration is performed on the phonon wavevectors in the first Brillouin Zone (BZ).As well as our interest is in the main dependence of
the line width. The integration is performed on the phonon wavevectors in the first Brillouin Zone (BZ).As well as our interest is in the main dependence of ![]() with
with ![]() , it is enough to consider the central part of the band, then we can substitute the gaussian function by a Dirac delta 2 in the integrand of (2) , i.e
, it is enough to consider the central part of the band, then we can substitute the gaussian function by a Dirac delta 2 in the integrand of (2) , i.e
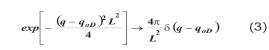
Making this change in (2), using the properties of the Dirac delta and changing ![]() by , we obtain:
by , we obtain:

where ![]() .
.
Besides the explicit dependence of ![]() with
with ![]() that is showed in (4), there is also an implicit dependence because the line width also depends of the concentration of defects. In fact, for the excited electronic states, those that participates in the processes originating the D-band, there are two basic mechanisms of relaxation: scattering by phonons and scattering by defects. We can then write the following:
that is showed in (4), there is also an implicit dependence because the line width also depends of the concentration of defects. In fact, for the excited electronic states, those that participates in the processes originating the D-band, there are two basic mechanisms of relaxation: scattering by phonons and scattering by defects. We can then write the following:
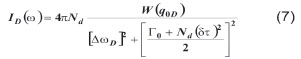
The first term in the right side of (5) is the contribution to the line width of the electron-phonon interaction and the second one is the contribution of the electron-defect scattering. It is obvious that the last term should depend of the concentration of defects 3. In the case of irradiated graphene the main kind of defects are single vacancies [18]. For this kind of defects, the expression:
Is frequently used [17] , where ![]() is the square mean deviation of the nearest neighbor hopping energy calculated by the tight binding model. This variation is produced by the presence of defects, which change the positions of the atomic orbitals. Using (6) we can rewrite (4) as follows:
is the square mean deviation of the nearest neighbor hopping energy calculated by the tight binding model. This variation is produced by the presence of defects, which change the positions of the atomic orbitals. Using (6) we can rewrite (4) as follows:
In the case of the G-band, the relaxation of the electronic states that participates in the Raman process is produced mainly through the scattering of electrons by phonons. Then, in this case, the contribution to the line width of the interaction electron-defects can be neglected and we can consider ![]() Then, the expression for the intensity of line G can be approximated to:
Then, the expression for the intensity of line G can be approximated to:
RESULTS AND DISCUSSION
Using (7) and (8) we can obtain the dependence of ![]() with
with ![]() as follows:
as follows:

Expression (9) shows clearly the non-monotonous dependence of ![]() with the concentration of defects in irradiated graphene. In obtaining it ,we have not used any kind of consideration about amorphization of another mechanism, additional to the basic Raman processes. Then, the experimentally obtained dependence of
with the concentration of defects in irradiated graphene. In obtaining it ,we have not used any kind of consideration about amorphization of another mechanism, additional to the basic Raman processes. Then, the experimentally obtained dependence of ![]() with the defect concentration is intrinsic to the nature of the processes that produces the D-band in the Raman spectra of graphene.
with the defect concentration is intrinsic to the nature of the processes that produces the D-band in the Raman spectra of graphene.
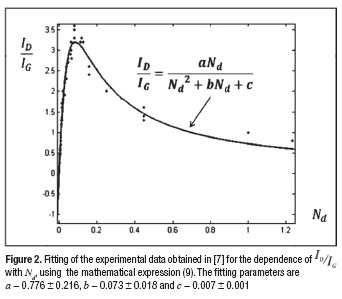
Besides its theoretical value, expression (9) can be used as a function for fitting experimental data, using a, b, c as fitting parameters.
The fitting of the experimental data obtained by Luchesse et al 4. [7 ] using the expression (9), is showed in Figure 2. It was carried out with the fitting tools of MATLAB that use the determination coefficient, ![]() for evaluating the quality of the approximation. This coefficient is defined by:
for evaluating the quality of the approximation. This coefficient is defined by:
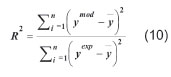
where ![]() and
and ![]() are the values of the independent variable (
are the values of the independent variable (![]() in this work ) obtained from the model and from the experimental data, respectively; and y is the mean value of the experimental values. In our case
in this work ) obtained from the model and from the experimental data, respectively; and y is the mean value of the experimental values. In our case ![]() = 0,96. Furthermore, the relative error in the determination of the parameters a, b, c is less than 30%. This indicates that, although we have introduced several approximations in the model, formula (9) is an acceptable representation of the function
= 0,96. Furthermore, the relative error in the determination of the parameters a, b, c is less than 30%. This indicates that, although we have introduced several approximations in the model, formula (9) is an acceptable representation of the function ![]() =
=![]() .
.
CONCLUSIONS
It has been demonstrated that the non-monotonous dependence of ![]() with the defect concentration (
with the defect concentration (![]() ) is an intrinsic feature of the Raman spectra of irradiated graphene and it is not necessarily related to the amorphization of the samples. A simple mathematical relationship between these magnitudes was obtained. This expression can be used to fit experimental data of the Raman spectra of irradiated graphene in relation with the concentration of defects.
) is an intrinsic feature of the Raman spectra of irradiated graphene and it is not necessarily related to the amorphization of the samples. A simple mathematical relationship between these magnitudes was obtained. This expression can be used to fit experimental data of the Raman spectra of irradiated graphene in relation with the concentration of defects.
REFERENCES
1. GEIM AK. Graphene: Status and prospects. Science. 2009; 324(5934): 1531-1534.
2. CASTRO NETO AH, GUINEA F, PERES NMR, et. al. The electronic properties of grapheme. Rev. Mod. Physi. 2009; 81(1): 109-162.
3. COOPER DR, D'ANJOU B, GHATTAMANENI N, et. al. Experimental review of graphene. ISRN Condensed Matter Physics. 2012; 2012(article ID 501686): 1-56.
4. YAO J, SUN Y, YANG M, DUAN Y. Chemistry, physics and biology of graphene-based nanomaterials: new horizons for sensing, imaging and medicine. J. Mater. Chem. 2012; 22(29): 14313-14329.
5. TAPASZTO L, DOBRIK G, NEMES-INCZE P, et. al. Tuning the electronic structure of graphene by ion irradiation. Phys.Rev. B. 2008; 78(1-4): 233407.
6. LETHINEN O, KOTAKOSKI J, KRASHENINNIKOV AV, et. al. Effect of ion bombardment on a two-dimensional target. Phys. Rev. B. 2010; 81(1-4): 153401.
7. LUCCHESE MM, STAVALE F, MARTINS FERREIRA EH, et. al. Quantifying ion-induced defects and Raman relaxation length in grapheme. Carbon. 2010; 48(5): 1592-1597.
8. CODORNIU PUJALS D, AGUILERA CORRALES Y, BALDASARRE F. Calculation of the number of atoms displaced during the irradiation of monolayer grapheme. J. Radioanal. Nucl. Chem, 2011; 289(1): 167-172.
9. MALARDAL M, PIMENTAM A, DRESSELHAUS G, DRESSELHAUS MS. Raman spectroscopy in grapheme. Physics Reports. 2009; 473(5-6): 51-87.
10. FERRARI C. AND ROBERTSON J. Interpretation of Raman spectra of disordered and amorphous carbon. Physical Review B. 2000; 61(20): 14095-14101.
11. SAITO R, HOFMANN M, DRESSELHAUS G, et. al. Raman spectroscopy of graphene and carbon nanotubes. Advances in Physics. 2011; 60(3): 413-550.
12. TUINSTRA F, KOENIG JL. Raman spectrum of graphite. J Chem. Phys. 1970; 53(3): 1126–30.
13. TEWELDEBRHAN D, BALANDIN A A. Modification of graphene properties due to electron-beam irradiation. Appl. Phys. Lett. 2009; 94(1): 013101-013103.
14. BUCHOWICZ G, STONE P, ROBINSON JT, et. al. Correlation between structure and electrical transport in ion-irradiated graphene grown on Cu foils. [artículo en línea]. Appl. Phys. Letters. 2011; 98 (3): 032102. <http: arxiv.org/pdf/1012.4060> [consulta: feb 2013]
15. KRASHENNINIKOV AV, NORDLUND K. Ion and electron irradiation-induced effects in nanostructured materials. J.Appl. Phys. 2010; 107(7): 071301.
16. THOMSEN C, REICH S. Double Resonant Raman Scattering in Graphite. Phys. Rev. Lett. 2000; 85(24): 5214-5217.
17. VENEZUELA P, LAZZERI M, MAURI F. Theory of double-resonant Raman spectra in graphene: intensity and line shape of defect-induced and two-phonon bands [artículo en línea]. Phys Rev B. 2011; 84(3): 035433. <http: arXiv: 1103.4582> [consulta: feb 2013]
18. LETHINEN O, KOTAKOSKI J, KRASHENNINIKOV AV, et. al. Effects of ion bombardenment in a two-dimensional target. Physical Review B. 2010; 81(15): 153401.
Recibido: 15 de noviembre de 2012
Aceptado: 25 de abril de 2013
1 The so-called Tuinstra-Konig relationship was formulated as![]() ,where
,where ![]() is a factor that depends of the wave length of the exciting laser and L is the distance between the crystallites, that is approximately the same as the average distance between defects. Then,
is a factor that depends of the wave length of the exciting laser and L is the distance between the crystallites, that is approximately the same as the average distance between defects. Then, ![]()
2 The factor ![]() is introduced to assure that the integral of both functions is the same
is introduced to assure that the integral of both functions is the same
3 The anharmonic effects give an additional contribution to the line-width. As this contribution is not related to defects, we will include it in ![]() .
.
4 The experimental results reported in [7 ] constitute one of the most complete set of data Raman intensities in irradiated graphene published so far.

