


 Custom services
 English (pdf)
 Article in xml format
 Article references
 Send this article by e-mail
 Cited by SciELO
  Similars in
SciELO
Similars in
SciELO 
 Permalink
Introduction
Carbon nanostructures, such as graphene, nano-tubes, nano-onions, nano-diamonds, and other, are being studied intensely by the scientific community, due to their current and potential applications in Electronics, Healthcare, Environmental Protection, Industry and many other fields. Their peculiar physical properties are also of special interest [1, 2].
One of the most popular and simple method for obtaining carbon nanostructures, especially nano-onions and nano-tubes, is the synthesis by underwater arc discharge of graphite electrodes, described by Sano in 2002 [3]. Since then, several authors have been using this technique to synthetize carbon nano-onions [4].
Due to the fact that the morphology and some physical properties of the nanostructures depend of the synthesis method used, it is very important to study in detail the characteristics of the nanomaterials obtained by underwater arc discharge. For example, recent studies by Transmission Electron Microscopy (TEM) and Raman Spectroscopy shown that an important fraction of the nano-onions obtained by this technique has polyhedral structure [5,6], instead of the common spherical one obtained by other methods of synthesis [7, 8].
In order to obtain further information about the nanostructures obtained by the synthesis of arc discharge in water, in the present work several samples resulting of the synthesis have been studied using X-Ray Photoelectron Spectroscopy (XPS).This powerful technique has resulted very useful for the study of carbon nanostructures produced by other methods [9,10], but so far with a very little application to those obtained with this particular synthesis procedure.
This research emphasize on the difference in the spectra obtained from the floating part of the synthesis products, very rich in nano-onions , with respect to those from the precipitated, which contains an important fraction of MWCNT. The presence of oxygen in the products and its chemical form is also investigated.
Materials and methods
The nanostructures were obtained in a home-made workstation consisting of two graphite electrodes submerged in distilled water with resistivity of 1.2 M(. The arc discharge starts by contacting the 99.9% pure graphite anode (6 mm diameter) with a graphite cathode (10 mm tip diameter) of similar purity submerged to a depth of 5 cm. The discharge voltage and current were 16-17 V and 30 A , respectively. This set up is described in more detail in reference [6].
After the discharge, part of the products of the synthesis are floating at surface of water and the rest of the products precipitate. Samples were obtained from both fractions and studied separately.
The XPS spectra were obtained in a spectrometer Alpha 110 from Thermo Fisher Scientific. The equipment has a hemispherical electron analyzer with seven channels. The X-rays were obtained from a monochromatic source of Aluminum (
The high resolution spectra were deconvoluted with combinations of Gaussian and Lorentzian curve profiles, using the fitting tool kit of MATLAB. Different combinations were tested and those with better determination coefficient1
Results and discussion
The XPS survey spectrum taken from one of the samples of the floating part is displayed in figure 1. The most prominent features of this spectrum are the very sharp peaks located at binding energies near 284 and 531 eV. According to the literature [11], these peaks correspond to the levels 1s of carbon (C1s) and oxygen (O1s), respectively. The last one is an evidence of the presence of oxygen in the products of the synthesis, which is a consequence of the synthesis in water. The other important feature is the band present around 1000 eV, which corresponds to KLL Auger electrons from oxygen, and corroborates the presence of this element in the samples. This survey spectrum is very similar to those taken from the rest of the samples of the floating fraction as well as those taken from the precipitate. Then, in order to detect differences between the samples from the floating part and the precipitate it was necessary to analyze the high resolution spectra. One of such spectra for the line C1s of the samples obtained from the floating part is presented in figure 2. There is also displayed the result of the deconvolution of the spectrum.
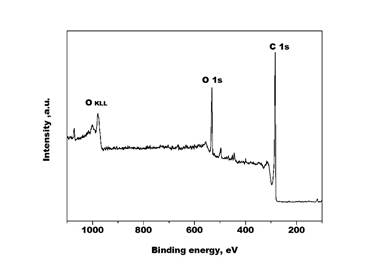
Figure 1 XPS survey spectrum of one of the samples taken from the floating part of the synthesis products.
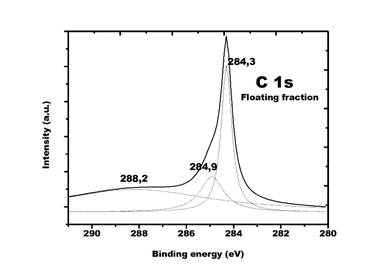
In order to understand these spectra it is important to bear in mind that the floating fraction is composed mainly from nano-onions, mostly with polyhedral morphology [6]. These polyhedral nano-onions have plane regions very similar to graphite and regions where the carbon lattice is curved, in order to close the polyhedron. The main component of the spectrum is the peak located at 284,3 eV, which corresponds to the position of the core level 1s of the carbon with hybridization sp2. Consequently, this peak can be associated with the plane faces of carbon in the polyhedral nano-onions.
Although the core levels do not participate directly in the bonds of the atoms, it is well known that the kind of hybridization of the external orbital has influence in the position of the core levels, and then in the XPS spectra. Consequently , the other peak, shifted to the right in the binding energy axis, at 285 eV, can be identified with the curved zones of the nano-onions, where the orbitals are a mixture of sp2 and sp3 hybridizations [5]. Finally, there is a broad band with a center in 287,9 eV. Some compounds of carbon with oxygen can give peaks in this zone. The specific compound will be analyzed later on, using the high resolution spectra from O 1s.
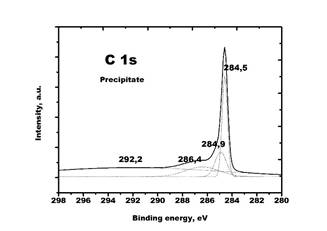
Figure 3 corresponds to the high resolution XPS spectra of the band C 1s of the samples taken from the precipitate. These samples contain an important quantity of MWCNT besides nano-onions. In this spectrum there are also two peaks similar to those found in the spectrum of the floating part, but in this case located at 284,4 and 284,6 eV respectively. These peaks can be assigned to the plane and curved parts of the nano-onions, respectively. Nevertheless there are differences between the two spectra. In the spectrum of the precipitate, the peak at 287,9 eV is missing and there are two new bands, one at 285,9 and other very broad at 291,3 eV. Due to the fact that these samples contain nanotubes, the first of these peak can be associated to the curved planes of the MWCNT, which present orbitals with mixed hybridization sp2-sp3. The position of the peak is different to that of the curved part of the nano-onions because, in general, the ratio sp2/sp3 is different in the nano-tubes and in the nano-onions. Different ratios sp2/sp3 can also be related with the presence of nano-onions of different diameters.
The band at 291,3 eV have been found in several carbonaceous materials [9] and it is identified as a plasmonic band. This kind of band is the result of the interaction of the photoelectrons emitted from the core levels with the near-free electrons in the valance band. The lack of this band in the spectra of the samples from the floating part is not clear and will be the object of further researches.
In order to obtain more information about the presence of oxygen in the products of the synthesis, high resolution spectra were measured in the neighborhood of the O 1s peak. The spectrum corresponding to one sample taken from the floating part is shown in figure 4. After the deconvolution, two peaks can be clearly identified: one at 532,2 eV and other at 534,4eV. The comparison of these values with those reported in the literature [11] allows to associate the first peak with the carbonyl group,
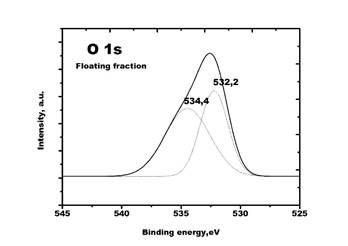
The corresponding peak of
The formation of oxygen-containing groups indicates the presence of edges in graphitic layers of these samples. These edges can be found in carbon nanotubes with open ends, which could exist in the samples of the precipitate, but in low quantities. The most feasible explanation for the existence of these groups is the presence of incomplete graphitic layers in the nano-onions. The formation of defective nano-onions have been reported by other authors [3].
Conclusions
Carbon nanostructures synthesized by the method of underwater arc discharge of graphite electrodes are studied using X-Ray photoelectron spectroscopy (XPS). The high resolution spectra of C1s taken from the floating part are different from those of the precipitate. The main difference is related with the presence of peaks that correspond to C atoms in orbitals with mixed hybridization sp2 and sp3, but with different ratio sp2/sp3, due to the presence of nanotubes in the precipitate whose C planes have different curvature relative to the nano-onions. Different ratios sp2/sp3 can also be related with the presence of nano-onions of different diameters. On the other hand, the high resolution spectra of O1s show the presence of oxygen-containing groups in the samples that can be formed mainly in defective zones of the graphitic planes of the nano-onions.
The results of this work demonstrate that XPS can be a useful tool for the characterization of the products synthesized by arc discharge in water, in conjunction with the traditional methods like Transmission Electron Microscopy and Raman spectroscopy.

