


My SciELO
 Custom services
Services on Demand
Journal

Article
 English (pdf)
 Article in xml format
 Article references
 Send this article by e-mail
Indicators
-
 Cited by SciELO
Related links
-
 Similars in
SciELO
Similars in
SciELO
Share

 Permalink
Biotecnología Aplicada
On-line version ISSN 1027-2852
Biotecnol Apl vol.26 no.3 La Habana July-Sept. 2009
RESEARCH
Stability of standard curves of hepatitis C virus transcripts used for viral quantification
Estabilidad de curvas estándar de transcritos del virus de la hepatitis C empleadas para la cuantificación viral
Yenitse Perea1, Anny Armas1, Yaimé J González1, Celia M Laza2
1Laboratorio de Biología Molecular, Subdirección de Inmunoquímica
2Departamento Central de Matemática y Programación, Centro de Inmunoensayo, CIE Calle 134 y Ave. 25, AP 6653, Cubanacán, Playa, Ciudad de La Habana, Cuba
ABSTRACT
The World Health Organization currently estimates the prevalence of hepatitis C virus (HCV) infections to be around 3%, representing approximately 170 million of infected people worldwide. An important step in the confirmatory diagnosis of HCV is the detection of its ribonucleic acid (RNA) in human serum or plasma, using nucleic acid amplification methods. Likewise, the measurement of HCV RNA viral loads by these methodologies is important for monitoring the therapeutic efficacy of antiviral drugs and monitor disease progression in HCV-infected individuals. The aim of this work was to study the stability of external curves built with different concentrations of an HCV transcript, which are used as components of a competitive Reverse Transcriptase-Polymerase Chain Reaction (RT-PCR) assay for the quantification of HCV RNA in human serum or plasma samples. The curves were studied for a period of 18 months by quantification at each time point against a fresh external curve, using an internal standard diluted in lysis buffer. RNA was extracted from each point of the curve and amplified by competitive RT-PCR, using a fluorimetric detection scheme based on the use of separate, specific probes for the HCV amplicons or the internal quantification standard. The results obtained in this work demonstrated that the RNA from each point of the quantification curve remained stable for all studied time points, allowing the use of ready-to-use curves, prepared in lysis buffer containing the internal quantification standard, for HCV viral load assays.
Keywords: RNA, HCV, quantification.
RESUMEN
La Organización Mundial de la Salud estima que la prevalencia del virus de la hepatitis C (VHC) es del 3%, lo que representa aproximadamente 170 millones de personas infectadas en el mundo. Para la confirmación del diagnóstico del VHC, es importante la detección del ácido ribonucleico (ARN) del virus en el suero o plasma humano, por métodos de amplificación de ácidos nucleicos. La determinación cuantitativa del ARN viral circulante permite predecir la respuesta al tratamiento y monitorear la terapia antiviral. El objetivo de este trabajo fue estudiar la estabilidad de curvas de cuantificación construidas a partir de un transcripto de VHC, como componentes de un ensayo de Reacción en cadena de la polimerasa con transcripción reversa (RT-PCR) competitivo utilizado para la cuantificación del ARN del VHC en muestras de suero o plasma humano. Se estudiaron las curvas hasta los 18 meses, y en cada tiempo se cuantificaron contra una curva preparada en el momento, utilizando un estándar de cuantificación interno diluido en un tampón de lisis. A partir de cada punto de la curva se extrajo el ARN y se amplificó mediante RT-PCR competitiva y detección fluorimétrica, con el empleo de sondas específicas para los amplicones del VHC y del estándar de cuantificación interno. Los resultados de este análisis mostraron que en cada punto de la curva, el ARN fue estable en todos los tiempos estudiados. Ello posibilita preparar curvas en el tampón de lisis que contiene el estándar de cuantificación interno, de manera que se puedan usar en ensayos de determinación de la carga viral del VHC.
Palabras clave: ARN, VHC, cuantificación.
INTRODUCTION
The World Health Organization currently estimates the prevalence of hepatitis C virus (HCV) infections to be around 3%, representing approximately 170 million infected people worldwide (1, 2). HCV infection usually leads to an acute hepatitis which is often asymptomatic, progressing into chronicity in 70% of the cases. Although most chronic patients remain asymptomatic for prolonged periods, approximately 20% of these patients will evolve towards liver cirrhosis after 20 years (3), which in this specific case not only places the patient at risk of hepatic insufficiency and transplants, but can also develop into a hepatocellular carcinoma. HCV infections currently constitute the main cause of hepatic transplant and hepatocarcinoma in the Western world (4, 5), and have become a major cause of hepatic morbility and mortality.
The preferred assay for the diagnosis of HCV infections is the detection of anti-HCV antibodies. However, although serological assays are highly sensitive, they must always be confirmed through the direct detection of circulating viral RNA, which is most commonly performed by reverse transcription coupled to the polymerase chain reaction (RT-PCR). RT-PCR can also be used for the quantification of viral load, which allows the evaluation of the therapeutic efficacy of antiviral drugs and is essential for monitoring disease progression in HCV-infected individuals (6).
An important part of every RT-PCR assay is a set of synthetic or viral RNA controls and standards. Since ribonucleic acids in general are highly sensitive to degradation by trace amounts of contaminating ribonucleases, these standards are often stored in a nuclease-inhibiting stabilizer solution (usually a lysis buffer) that is intended to extend their shelf life. Nonetheless, it is still necessary to measure the stability of such standards in order to derive estimations about their useful life without compromising experimental accuracy.
The present work examined the stability of standard curves prepared from an HCV transcript, which are part of a competitive RT-PCR assay for the quantification of HCV RNA in samples of human serum or plasma.
MATERIALS AND METHODS
Preparation of standard curves
The RNA molecules used for the preparation of the standard curves were obtained by in vitro transcription from plasmids containing either the HCV sequence or the internal quantification standard. They were stored as concentrated stocks in a stabilizing solution (lysis buffer) (7) until being used for preparing the curves.
The composition of the lysis buffer was: 0.3-0.6 M ammonium thiocyanate; 0.4-0.8 M guanidine thiocyanate; 35-40% (v/v) phenol; 5-8% (v/v) glycerol; 0.1-0.3 M sodium acetate, pH 4-6 and 0.05-0.1 mg/mL of heterologous RNA. This solution is equally protective throughout the complete range of concentrations used in the assay, and is stable for to 2 years when stored at 4 ºC and protected from light. The lysis buffer disrupts the virions during the process of purification of their ribonucleic acid, and stabilizes nucleic acids by denaturing any contaminating nucleases.
Three different formats or presentations of standard curves were examined in the stability study in order to select the most stable variant for inclusion into a competitive RT-PCR assay kit. The three studied formats were ready-to-use curves, a single, re-used curve, and fresh curves prepared before use from a concentrated HCV transcript at 850 000 IU/mL (identified here as concentrated curve). Transcript concentration was measured by spectrophotometry, determining optical density at a wavelength of 260 nm.
The curves were prepared from an HCV transcript stored in lysis buffer at a concentration of 1.43 x 10¹⁴ IU/mL, and contained three points (2410 IU/mL, 11 300 IU/mL and 66 400 IU/mL). Each point of the curve was analyzed per triplicate at every time point of the study.
Taking into account the volumes required for the ready-to-use and re-used curves, a single batch of lysis buffer was used to prepare 3 different master dilutions of HCV transcripts (2410 IU/mL, 11 300 IU/mL and 66 400 IU/mL). Likewise, the quality control sample (containing an intermediate concentration sample used to check for the accuracy of the quantification) was prepared as a single batch of an HCV transcript at 6880 IU/mL. The lysis buffer used for this preparation also contained an internal quantification standard as competitor, consisting of a transcript at a specific competing concentration.
The three curve point batches (2410 IU/mL, 11 300 IU/mL and 66 400 IU/mL) were aliquoted into thread-capped polyprpylene vials (Greiner, Germany) with aliquot sizes depending on the specific curve (600 μL for the ready-to-use curve, 1.2 mL for the reused curve, and 700 μL for the concentrated stock of the fresh curves at 850 000 IU/mL). The curves were stored at 2 to 8 °C during the study.
Design of the stability study for each curve presentation
The time points chosen for examining the stability of the three curve presentations (ready-to-use, re-used and fresh before use) differed in each case, due to the interest of the manufacturer in factors such as the stability of the component needed for the curve, throughput of the assay, and the specific objective fulfilled by each format. The time points of the study were, therefore, 0, 4, 7, 8, 10, 12, 15 and 18 months for the ready-to-use presentation; 0, 4, 6, 7 and 8 months for the re-used curve, and 0, 7 and 12 months for the concentrated stock at 850 000 IU/mL to be used for the preparation of the fresh curves.
Similarly, the procedure to be followed at each time point differed according to the presentation. For the ready-to-use format, the aliquots from each point and from the quality control sample were homogenized, and 500 μL were withdrawn from each one for RNA extraction. In the case of the reused curve, 600 μL were withdrawn from each of the 1200 μL aliquots to simulate a single use, and the remainder was stored at 2 to 8 °C to be analyzed at the corresponding time points. For the case of the freshly prepared curve, fresh dilutions were made at each time point from the concentrated aliquot (at 850 000 IU/mL) in order to obtain dilutions at 2410 IU/mL, 11 300 IU/mL and 66 400 IU/mL.
A control curve was prepared for each time point, starting from a dilution of the HCV transcript at 1.43 x 10⁷ IU/mL in lysis buffer, and consisted of three points at known concentrations.
RNA extraction
HCV RNA was purified from 500 μL samples withrawn from each point of the standard curves under study and the quality control sample, to which 150 μL of human cryosupernatant negative for HIV, HBV and HCV were added. The process employed an optimized modification of the phenol-chloroform method of Chomczynski (8). The RNA was precipitated with 500 μL of isopropanol (Merck, Germany), followed by washes with 75% ethanol (Merck, Germany) and acetone (Merck, Germany), and resuspension into ribonuclease-free water.
Reverse transcription-competitive RT-PCR amplification
Competitive RT-PCR assay used primers specific for the 5 untranslated region of the HCV genome. The internal quantification standard included in the lysis buffer was designed to be co-amplify with the HCV sequence; and yields an an amplicon of 168 bp (The use of an internal standard to compensate for varia tions between different tubes during RNA extraction and purification also allows the detection of possible inhibitors of the amplification reaction in the sample).
The amplification used a thermal profile consisting of an initial step at 45 °C for 30 min, followed by a denaturation step at 95 °C for 3 min and 50 thermal cycles (95 °C for 30 s; 67 °C for 30 s; 72 °C for 30 s), ending with an extension step at 72 °C for 7 min in a Mastercycler Gradient cycler (Eppendorf).
Detection of the amplified products
The amplicons were denatured and hybridized to polystyrene plates coated with specific probes for the HCV and internal standard amplicons, detecting the fluorometric signal with a SUMA 521 plate reader (SUMA, Cuba) interfaced to a personal computer. The results were analyzed with the Strips Reader Software application. Version 9 (TecnoSuma S.A., Cuba).
Quantification method
An external calibration curve was built using linear regression between the common logarithm of the expected viral load and the common logarithm of the fluorescence ratio between the HCV- and the internal standard-specific signals at each point of the curve, the viral load of test samples (was estimated) by interpolation on this curve.
Statistical analysis
The statistical analysis of the results used the method of linear correlation among variables, as implemented in the Statistica 6 software application. A correlation coefficient for the log10 for time 0 concentrations against the log10 of the concentrations at each studied time point was calculated. In this method, a correlation coefficient of 0.9 or higher indicates a high linear correlation between variables.
RESULTS AND DISCUSSION
Stability of the curve in ready-to-use format
The stability of the standards in the ready-to-use presentation as well as its quality control was studied by quantification at the specified time points against a freshly prepared curve, calculating the logarithm of the obtained concentrations for the three concentrations of the curve and the quality control sample and finding the logarithmic difference against the concentrations determined at time 0. These differences were then used to measure the stability of the samples (Table 1).
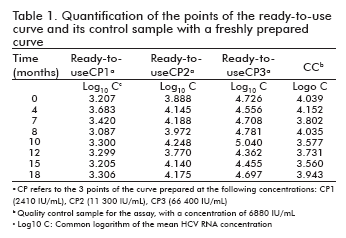
In all studied time points, the logarithmic differences of the three points and the quality control sample stayed within ± 0.5 units. This variability falls between the accepted limits for similar viral load assays, and is not considered significant (9, 10).
Similarly, the correlation coefficients between the log10 of the concentration at time 0 at that of the different time points ranged from 0.900 to 0.996, demonstrating a high correlation between the observed values.
Stability of the reused and freshly prepared curve formats
The stability of the curve and its quality control sample in the re-used curve format, as well as that of the curves freshly prepared from a stored stock together with their quality control sample, was measured following the same procedure adopted for the ready-to-use format: their points were quantified at different time points against a freshly prepared curve, determining the logarithm of the concentrations and calculating their difference to the logarithm of the concentration at time 0 (Table 2 and Table 3). The results were also similar to those of the ready-to-use format: the logarithmic difference between the concentrations at the specific time point and time 0 was never higher than ± 0.5 units, which constitutes an accepted degree of variation in similar viral load assays and is not considered significant (9, 10).
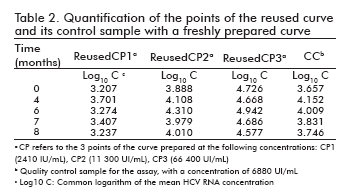
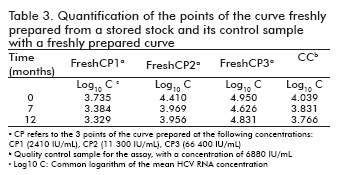
Likewise, the correlation coefficients between the log10 of concentration at time 0 and the log10 of the concentration of their corresponding time points ranged from 0.976 to 0.999 for the re-used format, and was 0.983 for the curves freshly prepared from a stored stock.
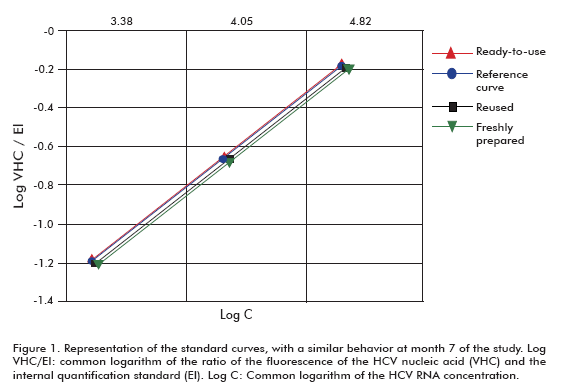
The figure 1 shows that the behavior of the three curves at 7 months was similar in all cases to the curve used for quantification at that time point: the regression coefficients and the slopes were R2 = 0.980 and b = 0.669 for the ready-to-use format, R2 = 0.966 and b = 0.699 for the reused format, R2 = 0.959 and b = 0.688 for the fresh curve prepared from a stored stock, and R2 = 0.959 and b = 0.688 for the fresh standard curve prepared as reference.
These results show that a ready-to-use presentation for the standard curve is a viable solution to be included in different diagnostic kits for the quantification of HCV viral RNA, since it is stable for at least 18 months and can be re-used for 8 months since the date of first utilization.
It is known that RNA samples can be stored in gua-nidinium isothiocyanate solutions at temperatures of -20 °C to -80 °C (11). Guanidinium thiocyanate is another chaotropic agent often used to inhibit ribonuclease activity during nucleic acid purification procedures (12) that is usually combined with beta-mercaptoethanol for the isolation of RNA from ribonuclease-rich environments (13). Some authors describe the use of guanidinium thiocyanate for the dilution or storage of RNA.
Several investigators have described guanidinium isothyocyanate as a stabilizer agent at sub-zero temperatures. When used for this purpose, chaotropic agents are dissolved at high concentrations (4 to 6 M), and are those most commonly employed in nucleic acid isolation methods. According to recent studies, RNA degrades almost totally after 12 hours of storage at 4 °C in 4 M guanidinium thiocyanate (14).
The storage of RNA in lysis buffer is advantageous, since it is easily prepared and does not affect its composition, which has allowed its use in most of the applications of molecular biology such as RTPCR, hybridization, sequencing and other enzymatic reactions requiring a high degree of RNA integrity. The method is versatile and compatible with most protocols for RNA isolation (phenol extraction (12), binding to silica (15, 16) and single step isolation of RNA/DNA (8)).
RNA is highly sensitive to ribonucleolytic degradation. Several alternatives have been proposed to curb RNA degradation in ribonuclease-rich environment at temperatures above zero, but none has been effective. The present work shows that RNA is stable when stored in our lysis buffer at 4 °C for a period of at least 18 months.
Kessler et al. (17) concluded that HCV RNA is stable in NATs (tubes containing a nucleic acid stabilizing liquid) at room temperature for at least 96 hours. Our results differ from those listed above, since the curves of RNA transcripts used in this work were stable for 18 months. This disparity is due to the storage of RNA, in our case, in a lysis buffer that doubled as a nucleic acid stabilizing solution (7), avoiding a significant decrease in the concentration of RNA in solution and increasing the flexibility in storage in transportation parameters.
Uylen (18) reached similar results to those described here, since freeze-dried RNA was stable for at least 1 year when stored at 2 to 8 °C.
The results in this work allow the utilization of ready-to-use curves diluted in lysis buffer containing an internal quantification standard for HCV viral load assays.
REFERENCES
1. Soza RA, López-Lastra M. Hepatitis C en Chile: Magnitud del problema. Rev Méd Chile 2006;134:777-88.
2. Shepard CW, Finelli L, Alter MJ. Global epidemiology of hepatitis C virus infection. Lancet Infect Dis 2005;5:558-67.
3. Seeff LB. Natural history of chronic hepatitis C. Hepatology 2002;36:35-46.
4. García M, Bárcena R. Hepatocarcinoma y trasplante hepático. Rev Esp Enferm Dig 2006;98(12).
5. Herrero JI, Pardo F, Quiroga J, Rotellar F. Trasplante hepático. Anales 2006;29: Suppl 2.
6. Schutten M, Peters D, Back NKT, Beld M, et al. Multicenter Evaluation of the new Abott realtime assays for quantitative detection of human immunodeficiency virus type 1 and hepatitis C virus RNA. J Clin Microbiol 2007;45:1712-7.
7. González I, García I, Armas A, Perea Y, González YJ et al. Scaling up in vitro transcription synthesis of RNA standards for competitive quantitative RT-PCR: Looking for bigger yields. Anal Biochem 2009;385:179-81.
8. Chomczynski P. A reagent for the single-step simultaneous isolation for RNA, DNA, and proteins from cell and tissue samples. BioTechniques 1993;15:532-5.
9. Holodniy M, Rainen L, Herman S. Stability of plasma human immunodeficiency virus load in VACUTAINER PPT plasma preparation tubes during overnight shipment. J Clin Microbiol 2000;38:323-6.
10. Schirm J, Van Loon AM, Valentine-Thon E, Klapper PE, Reid J, Cleator GM. External quality assessment program for qualitative and quantitative detection of hepatitis C virus RNA in diagnostic virology. J Clin Microbiol 2002;40:2973-80.
11. Gilleland RC, Hockett RD. Stability of RNA molecules stored in GITC. Biotechniques 1998;25:944-8.
12. Sambrook J, Fritsch EF, Maniatis T. Molecular Cloning. A Laboratory Manual 1989; .16-7.52.
13. Chirgwin JJ, Przybyla AE, MacDonald RJ, Rutter WJ. Isolation of biologically active ribonucleic acid from sources enriched in ribonuclease. Biochemistry 1979;18:5294-9.
14. Lader ES. Methods and reagents for preserving RNA in cell and tissue samples. US Patent 6,204,375; 2001.
15. Boom R, Sol CJ, Salimans MM. Rapid and simple method for purification of nucleic acids. J Clin Microbiol 1990;28:495-503.
16. González-Pérez I, Armas A, García I, González YJ. Home-made RNA isolation protocol using silica columns. Comparison vs. silica based commercial kit and single-step isolation. Anal Biochem 2007;360:148-50.
17. Kessler HH, Stelzl E, Raggan RB, et al. Effects of storage and type of blood collection tubes on Hepatitis C virus level in whole blood samples. J Clin Microbiol 2001;39:1788-90.
18. Uylen MHF, Van Dinther FHM, Kievits T. Freeze-dried compositions comprising RNA. European Patent 027721. 1995 Oct 19.
Received in June, 2009.
Accepted for publication in September, 2009.
Yenitse Perea. Laboratorio de Biología Molecular, Subdirección de Inmunoquímica. Centro de Inmunoensayo, CIE. Calle 134 y Ave. 25, AP 6653, Cubanacán, Playa, Ciudad de La Habana, Cuba. E-mail: iqbmolecular4@cie.sld.cu
