


Mi SciELO
 Servicios personalizados
Servicios Personalizados
Articulo
 Inglés (pdf)
 Articulo en XML
 Referencias del artículo
 Enviar articulo por email
Indicadores
-
 Citado por SciELO
Links relacionados
-
 Similares en
SciELO
Similares en
SciELO
Compartir

 Permalink
Biotecnología Aplicada
versión On-line ISSN 1027-2852
Biotecnol Apl vol.29 no.4 La Habana oct.-dic. 2012
RESEARCH
Improvements to the evaluation process for diagnostic quality in laboratories using the SUMA technology
Mejoras en el proceso evaluativo de la calidad del diagnóstico en los laboratorios con tecnología SUMA
Alfredo Rego-Díaz1, Héctor Pérez-Molina2, Liliena López-Brauet2, Niurka Carlos-Pías1
1 Departamento de Matemática y Programación Aplicada, Centro de Inmunoensayo, CIE. Calle 134 y Ave. 25, Cubanacán, Playa, La Habana, Cuba.
2 Departamento de Control de la Calidad, CIE.
ABSTRACT
The Immunoassay Center (CIE) is a Cuban institution dedicated to develop the SUMA (Ultra Micro Analytical System), a diagnostic system currently applied in programs of prenatal and neonatal screening, epidemiological surveillance, and certification of donated blood, organs and placentas. In order to guarantee the quality of diagnosis with this technology, CIE has implemented a system of quality assessment for SUMA laboratories that is continuously improved and refined. The present work describes the currently implemented quality assessment system and how it solves the limitations of conventional quality control schemes in immunoassay laboratories. This objective was met by incorporating the reliability index and index of coefficients of variation, in an effort to provide a more rounded analysis that combines the examination of different types of quality controls (internal and external). These analyses were incorporated into the automated quality evaluation software currently employed by SUMA technology laboratories (Quality Assurance System; SAC 2.0), yielding measurable improvements to the quality evaluation process.
Keywords: Quality control, immunoassay, SUMA technology.
RESUMEN
El Centro de Inmunoensayo es una institución cubana que desde hace varios años se dedica al desarrollo de la tecnología SUMA (Sistema Ultra Micro Analítico), que se emplea en programas de pesquisa prenatal y neonatal, vigilancia epidemiológica, certificación de sangre, órganos y placenta. Con el objetivo de garantizar la calidad del diagnóstico con esta tecnología, el Centro de Inmunoensayo ha desarrollado y perfeccionado su sistema de evaluación de la calidad. Este artículo describe el sistema que permitió solucionar las limitaciones de los esquemas convencionales para el control de la calidad en los laboratorios de inmunoensayos. Para ello se incorporaron dos estadígrafos: índice de fiabilidad e índice de coeficientes de variación, con el objetivo de combinar el análisis de dos tipos de control de la calidad (el control interno y el control externo), y lograr un análisis integral. La variante descrita se ha añadido al sistema automatizado que evalúa la calidad de los laboratorios con tecnología SUMA (Sistema para el Aseguramiento de la Calidad, SAC 2.0), y mejora la eficacia y eficiencia del proceso evaluativo.
Palabras clave: control de calidad, inmunoensayo, tecnología SUMA.
INTRODUCTION
The Immunoassay Center (CIE) [1] is a research-production complex for the development and production of reagents and instrumentation for medical diagnosis. Its flagship product line is the Ultra Micro Analytical System (SUMA) [2], a technology including both equipment and reagents for performing enzyme immunoassays. It has very low production costs and is, therefore, particularly well suited for health program requiring the analysis of large numbers of samples.
There are over 750 laboratories in different countries currently employing SUMA technology, of which approximately one third is located in Cuba.
Due to the significant social and economic impact of its diagnostic technologies, CIE has prioritized and implemented, for over a decade, quality control programs to assess diagnostic quality and reliability among the network of laboratories based on its technological platform.
These programs have been designed following schemes described in the specialized literature [3-5], and are constantly improved based on the experience gained as clients of quality control programs sponsored by leading international institutions of the field [6, 7]. However, they are not perfect, as evidenced by the occasional detection of laboratories where, despite satisfactory quality assessment scores, deficiencies can still be detected.
Implementing an effective quality management system is an involved endeavor requiring technical skill and experience. Nevertheless, it must be remembered that for many diseases, the financial costs of deploying such a system are substantially offset by the potential economic and social costs of diagnostic errors.
Measurement errors (differences between the value yielded by a determination and the actual value) are an inevitable part of the daily work in diagnostic laboratories. These errors are classified in random errors (varying unpredictably in both magnitude and sign), systematic errors (whose value remains constant when the determination is repeated under the same conditions) and gross, or avoidable errors [4, 5, 8, 9]. Implementing a quality control system capable of detecting the appearance of experimental errors is a necessary step for taking corrective steps in a timely manner.
Most laboratory control systems use conventional ISO 15189-compliant quality control schemes (based on the analysis of internal and external quality control) [4]. But the experience provided by more than a decade using and analyzing this type of control scheme has highlighted as limitations: i) impossible to compare the imprecision of a specific laboratory with that of other laboratories analyzing the same control; ii) Insufficient sampling frequency; and iii) limitations of control charts.
In a conventional quality control scheme, the results of internal laboratory controls are analyzed in the target laboratory itself. Since this information is not available externally, it is impossible to compare the imprecision of a specific laboratory with that of a group of laboratories analyzing the same internal control.
This limitation becomes especially intractable whenever the instrumentation at the laboratories under comparison has been provided by different manufacturers, as in this case the information is often stored in different or incompatible formats. One possible solution for this problem is the application of Laboratory Information Management Systems –LIMS– [10], which provide a unified mechanism for data storage.
In an effort to devise procedures enabling the analysis of imprecision at one laboratory against that of a group of laboratories participating in a control scheme, as well as to bring quality control systems to the market, some companies have increased the number of reference controls and provided software applications that facilitate data storage and standardize its storage formats. In this arrangement, quality control data are eventually sent to a centralized data reception and processing point [11].
In the case of insufficient sampling frequency, the number of external controls sent by the evaluator to each laboratory in the context of an external control quality program has to be equal to or larger than the number of internal control batches processed by each laboratory on a monthly basis, to estimate accuracy using different batches of an internal quality control. Such a requirement stems from the fact that the inaccuracy and imprecision of the results vary with each different reagent batch. If this condition is not met, it would then be impossible to detect systematic errors in each batch.
External quality control programs [6, 7] use a constant number of external controls per assay per month, even though the number of reagent batches the laboratory will use during this period is not always predictable.
Regarding limitations of control charts, one of its fundamental requirements is the use of a sample size larger enough to be representative of the population, so as to calculate the necessary parameters (mean, standard deviation, upper and lower bounds) to be represented. Nevertheless, whenever analytical runs are performed in a laboratory, the number of internal control results stored per assay in each batch will increase from zero to value n, and in some laboratories the number of internal controls may be small (less than 20 measurements, for example). In this case, sample averages may be different from population averages (calculated by processing a representative number of controls), meaning that there is no guarantee that the data will follow a normal distribution.
Currently, SUMA Technology is in the process of decentralizing its laboratories, creating Integrated Active Screening Centers (CEPAI) in each municipality of the country and, therefore, decreasing the number of samples processed per laboratory. This compounds the sample size problem even further, as it leads to the situation described above in a high number of cases.
In a previous publication on the topic [12] we illustrated the advantages of a combined analysis of both controls, showing how the application of Westgard rules has improved the evaluation system [13, 14]. Taking into account the limitations of conventional quality control schemes, we propose below an algorithm for their solution.
MATERIALS AND METHODS
Materials
Internal controls
This work used the internal controls normally included with each quantitative immunoassay kit (the variant described here is not applied to qualitative assays).
One control is included per plate to be read [1], with an eight-digit identification code (XXYYKKZZ) with XX standing for manufacturing month, YY the manufacturing year, KK the expiry month and ZZ the expiry year.
Instruments
Readings were made by using a fluorimeter plate reader for ultramicro ELISA plates, PR model [1] with the aid of a plate washer model MW [1], (both from Tecnosuma S.A., Cuba).
Information technology support
This work used a database server installed at the Quality Control and Assurance Unit of the Immunoassay Center (CIE) [1] to store the results of quality controls to laboratories using SUMA technology.
Software applications
The selected statistical parameters were incorporated into the Quality Assurance System package (SAC, version 2.0).
Methods
Determination of analyte concentrations
The plate fluorimeter uses an electronic control system, an optical system, high precision positioning systems, a data acquisition system and an application called SRS v1.9 StripsReaders Software [1]. It obtains a quantitative value proportional to the fluorescent signal emitted by each well of the assay plate, which consists of 96 circularly shaped reaction wells [1] arranged into rows (A..H) and columns (1..12).
The columns are actually strips of wells placed on a rectangular supporting frame, so that unused strips can be removed if necessary. In a full plate, the first 12 positions are used for a standard curve (6 duplicated points), position G1 is used for an internal quality control, and the remaining wells are used for patient samples. Two or three times per month, an external quality control sample is placed in one of the positions habitually used for patient samples.
The software controlling the plate reader [1] measures the fluorescence of each reaction well and calculates analyte concentrations by interpolation into a standard curve of six points of known concentrations, included in the plate. The concentration of each point of the standard curve is entered into the control software for every reagent batch.
A graphical representation of the standard curve is obtained by plotting its six points in a fluorescence vs. concentration chart (the fluorescence of each point is defined as the mean of its duplicates). The software selects the function best fitting the points of the chart (cubic spline, line segments or an exponential function), which it then uses to calculate, from the measured sample fluorescence values (Fi), the concentration of the analyte (Ci).
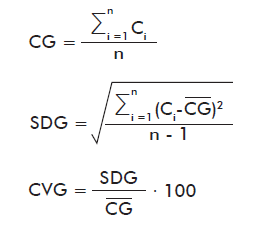
The analysis of internal controls uses their mean, standard deviation, coefficient of variation and reliability index, calculated for each batch (one batch of internal control contains a set of reagent kit [1]):
where:
CG: Average of the concentrations from the group of laboratories (calculated from the controls processed by all the laboratories).
Ci: Concentration of each internal control (obtained by processing a single plate).
n: Number of controls reported by all the laboratories
SDG: Standard deviation of the group of laboratories
CVG: Coefficient of variation of the group of laboratories
Inaccuracy is measured with the reliability index (RI) [15], which represents the number of standard deviations spanned by the difference between the control and the group average:
where:
RI: Reliability index of the Ci internal control.
Imprecision is measured with the Index of Coefficients of Variation (CVI) [16, 17], which relates the imprecision of the laboratory under analysis to that of the remaining laboratories processing the same control.
where:
CVL: Coefficient of Variation for the laboratory under analysis.
Evaluation of inaccuracy for a specific time period
An RI value is computed for each internal control processed in the laboratory using the expression above, obtaining the following set of data:
![]()
where:
Lab[i]: Laboratory i identification.
Ens[j]: Assay j identification (alpha-fetoprotein in the present study).
RI[L]: reliability index for the control tested.
Lab[i].Ens[j].RI[L]: Data subset formed by the values of the reliability index (RI) for each internal quality control processed in the laboratory.
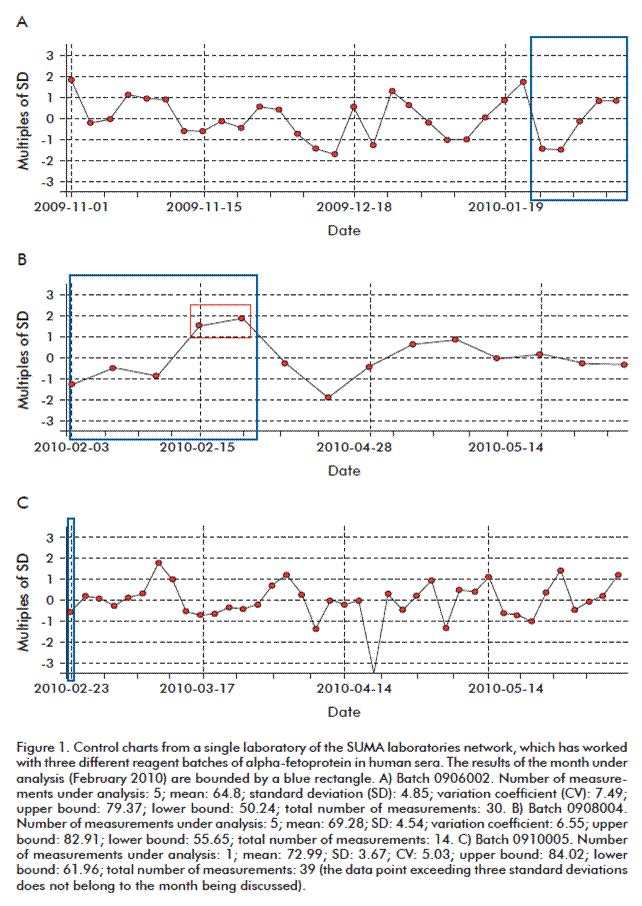
The results of calculations can be plotted in a chart of RI vs. sequential measurement number, as shown in figure 1.
RESULTS AND DISCUSSION
Introducing the reliability index (RI) and the Index of Coefficients of Variation (CVI) in the analysis of internal controls bypasses the limitations outlined in the introductory section.
Mean for quantifying relative imprecision
Previous quality control systems developed by CIE [1] analyzed the behavior of internal quality controls through Westgard rules [13, 15], which can be individually applied by each laboratory. The ability to use the information from all internal controls analyzed by every laboratory under study enabled the calculation of CVI during the evaluation system.
Solution to sample size limitations
Taking into account that each reaction plate [1] processed in a specific laboratory includes an internal control, whose measured value is stored in a centralized database at CIE [1], it is straightforward to calculate the reliability index (RI) in order to represent graphically the inaccuracy of all measurements performed by every laboratory in the network.
Solution to control charts limitations
The limitation of control charts regarding the requirement of a minimum number of measurements in order to present results accurately and reliably is bypassed by using reliability index (RI) charts.
The current version of the Quality Assurance System software used in the network of SUMA laboratories (SAC 2.0) makes use of these statistical parameters to improve the efficacy of the quality assessment process, solving the limitations of conventional quality control schemes.
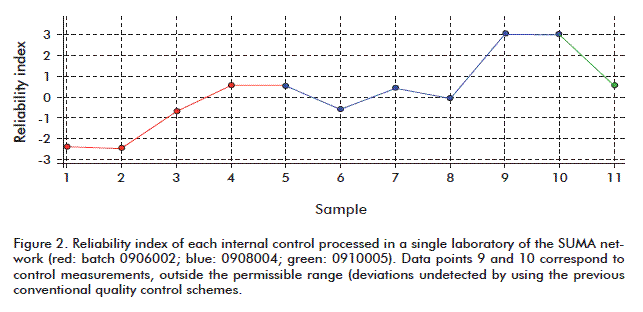
Figure 1 contains three conventional control charts corresponding to a laboratory that has gone through 3 different reagent batches (0906002, 0908004 and 0910005) in the course of a single month, processing a total of 11 plates (equivalent to 11 internal controls). As it can be observed in the figure 1, none of the measurements deviates above three standard deviations (for the month 02-2010), calculated from laboratory results.
Figure 2, produced from the same data set, reveals however that when RI per analytical run is charted, measurements 9 and 10 of the internal control yield concentration values larger than 3 units; that is, exceeding three standard deviations (but calculated with data from all laboratories processing this same control).
The contradicting results obtained when using control charts or, alternatively, RI charts, stem from the fact that the former analyze data variability by comparison with the standard deviation generated with its own data, whereas the RI chart analyzes data variability in the context of the data generated by all network laboratories processing the same control.
Whenever the variability of the data generated by a specific laboratory is higher than that of the network of laboratories processing the same control, or the mean calculated in the laboratory is significantly different from the mean calculated with data from all laboratories, the possibility arises that some data points may well fall within a range of 3 laboratory standard deviations (and therefore, meet the assay’s acceptance criteria) but outside the permissible range of 3 standard deviations in the RI chart, thereby illustrating the usefulness of this statistic tool (Figure 2).
The limitations described above have been previously pointed out by other authors [11], who have demonstrated that the combination of an External Quality Control Program with control charts and Westgard rules [13, 14] does not always guarantee the efficacy of the quality evaluation process.
CONCLUSIONS
The improvements to the quality evaluation process described above were introduced during 2011 into the system for the automated quality evaluation of SUMA laboratories (SAC 2.0), producing an increase of over 1% in the number of deficient laboratories per month (this process is run on a monthly basis) and demonstrating their effectiveness for the detection of deviations that would otherwise remain undetected under conventional control quality schemes.
Thanks to the presence of internal controls into the diagnostic kits, this alternative has been implemented without incurring additional expenses; an important advantage for CIE in its dual role as manufacturer and supervisor.
Based on the above, we affirm that the implementation of this new evaluation methodology will have a positive impact on the quality of the results obtained in SUMA laboratories, which are involved in the programs of prenatal screening, neonatal screening, epidemiological surveillance and blood certification in Cuba, as well as in different health programs in the countries where this technology is sold (Mexico, Venezuela, Argentina and Brazil).
REFERENCES
1. Centro de Inmunoensayo. Tecnología SUMA, aplicaciones y uso. La Habana: Editorial Ciencias Médicas; 2007.
2. Tecnosuma Internacional S.A. [Internet]. La Habana: Tecnosuma Internacional S.A.; c2012 [cited 2012 Mar 20]. Available from: http://www.tecnosuma.com
3. Whitehead TP. Advances in quality control. Adv Clin Chem. 1977;19:175-205.
4. Oficina Nacional de Normalización. NC ISO 15189. Laboratorios clínicos - Requisitos particulares para la calidad y la competencia (ISO 15189:2007, IDT). La Habana: Oficina Nacional de Normalización; 2008.
5. Oficina Nacional de Normalización. NC ISO 9000. Sistemas de gestión de la calidad_Fundamentos y vocabulario [ISO 9000:2005, (Traducción certificada), IDT]. La Habana: Oficina Nacional de Normalización; 2005.
6. Centers for Disease Control and Prevention (CDC) [Internet]. Atlanta: CDC; c2012 [cited 2011 Sep 1]. Available from: http://wwwn.cdc.gov/nsqap/public/default.aspx
7. Fundación Bioquímica Argentina (FBA) [Internet]. Buenos Aires: FBA; c2003 [cited 2011 Jun 1]. Available from: http://www.fba.org.ar/default.asp?
8. Glossary of QC terms - Westgard QC [Internet]. Madison: Westgard QC; c2009 [updated 2012 Mar 20; cited 2012 Mar 20]. Available from: http://www.westgard.com/glossary.htm
9. Oficina Nacional de Normalización. NC ISO 5725-1. Exactitud (veracidad y precision) de métodos de medición y resultados - Parte 1: Principios generales y definiciones (ISO 5725-1:1994, IDT). La Habana: Oficina Nacional de Normalización; 2005.
10. Laboratory Informatics Institute. LIMSbook and Buyers Guide. 2nd Edition. Atlanta: Laboratory Informatics Institute, Inc.; 2012.
11. QCNet [Internet]. Irvine: Bio-Rad Laboratories, Inc.; c2012 [updated 2012 Mar 20; cited 2012 Mar 20]. Available from: http://www.qcnet.com
12. Rego A, Pérez H, López L, Carlos N. Integral evaluation of quality in diagnostic laboratory networks. Biotecnol Apl. 2009; 26(2):151-5.
13. Westgard JO, Barry PL, Hunt MR, Groth T. A multi-rule Shewhart chart for quality control in clinical chemistry. Clin Chem.1981; 27(3):493-501.
14. Westgard JO, Barry PL. Improving Quality Control by use of Multirule Control Procedures. In: Westgard JO, Barry PL. Cost-Effective Quality Control: Managing the quality and productivity of analytical processes. Washington, DC: AACC Press; 1986. p. 92-117.
15. Gozzo ML, Barbaresi G, Giocoli G, Zappacosta B, Zuppi C. Long-term retrospective control procedures for monitoring analytical performance of laboratory instruments. Clin Chem. 1984;30(1):145-9.
16. Randox Laboratories Ltd. [Internet]. Antrim: Randox Laboratories Ltd.; c2012 [updated 2012 Mar 20; cited 2012 Mar 20]. Available from: http://www.randox.com/qc%20software.php
17. NIST/SEMATECH e-Handbook of Statistical Methods [Internet]. New York: The National Institute of Standards and Technology (NIST); 2012. Available from: http://www.itl.nist.gov/div898/handbook/apr/section4/apr47.htm.
Received in July, 2011.
Accepted in July, 2012.
Alfredo Rego-Díaz. Departamento de Matemática y Programación Aplicada, Centro de Inmunoensayo, CIE. Calle 134 y Ave. 25, Cubanacán, Playa, La Habana, Cuba. E-mail: inprogram2@cie.sld.cu.
