


Meu SciELO
 Serviços customizados
Serviços Personalizados
Artigo
 Inglês (pdf)
 Artigo em XML
 Referências do artigo
 Enviar este artigo por email
Indicadores
-
 Citado por SciELO
Links relacionados
-
 Similares em
SciELO
Similares em
SciELO
Compartilhar

 Permalink
Biotecnología Aplicada
versão On-line ISSN 1027-2852
Biotecnol Apl vol.31 no.2 La Habana abr.-jun. 2014
TECHNIQUE
Determination of HIV-1 viral load on dried blood spot specimens
Determinación de la carga viral del VIH-1 en muestras de sangre seca en papel de filtro
Nancy M Ruiz1, María T Pérez2, Héctor M Díaz3, Maricela Izquierdo4, Madeline Blanco1, Liuber Y Machado1, Eladio Silva4
1 Laboratorio de Biología Molecular, Laboratorio de Investigaciones del Sida, Lisida. Carretera de Jamaica y Autopista Nacional, San José de las Lajas, CP 32700, Mayabeque, Cuba.
2 Subdirección Gestión de la Calidad. Lisida, Cuba.
3 Laboratorio de Diagnóstico. Lisida, Cuba.
4 Subdirección General. Lisida, Cuba.
ABSTRACT
Dried blood spot specimens on filter paper were evaluated to determine the viral load of the human immunodeficiency virus type 1 (HIV-1), through the Cobas®Ampliprep/Cobas®Taqman® HIV-1 test. RNA levels were quantified in pairs of plasma and dry blood spot specimens on filter paper from persons infected with HIV-1. The Pearson linear correlation coefficient was calculated as well as the agreement by the Bland-Altman method. Studies on precision, linearity and analytical sensitivity of the assay were also carried out. The linear regression model was used to predict the value of the viral load in the plasma. There was a high correlation in viral load measurements in the plasma and dried blood spot specimens, in 39 out of the 43 sample pairs studied (r = 0.964, p < 0.0001). Detection rate was 90.7 % and the test behaved linearly between 134 and 420 000 copies/mL of viral RNA, showing good precision. No statistically significant differences were observed between the means of the true and predicted values of viral load in the plasma, with a 95 % confidence level. These results support the use of dried blood spots on filter paper for viral load determination with the Cobas®Ampliprep/Cobas®Taqman® HIV-1 Test. Authors recommend the validation of the model proposed with a larger number of samples.
Keywords: HIV-1, RNA, viral load, dried blood spots, CAP/CTM HIV-1 Test.
RESUMEN
Para la determinación de la carga viral del virus de la inmunodeficiencia humana tipo 1 (HIV-1), se evaluaron muestras de sangre seca en papel de filtro, mediante la prueba Cobas®Ampliprep/Cobas®Taqman® HIV-1. Se cuantificó el ARN en pares de muestras plasma-sangre seca en papel de filtro, provenientes de personas infectadas con el HIV-1. Se calculó el coeficiente de correlación lineal de Pearson y la concordancia mediante el método de Bland y Altman. Se estudiaron la precisión y la linealidad, y se determinó la sensibilidad analítica del ensayo. El modelo producto de la regresión lineal se utilizó para pronosticar el valor de la carga viral en el plasma. Hubo una elevada correlación entre las mediciones de la carga viral en el plasma y la sangre seca en papel de filtro, en 39 de los 43 pares de muestras estudiados (r = 0.964, p < 0.0001). La tasa de detección fue del 90.7 %. Se apreció un comportamiento lineal entre 134 y 420 000 copies/mL de ARN viral, con precisión satisfactoria. Se demostró que no existen diferencias estadísticamente significativas entre las medias de los valores de carga viral pronosticados y reales en el plasma, mediante un nivel de confianza del 95 %. Tales resultados apoyan el empleo de muestras de sangre seca en papel de filtro, para la determinación de la carga viral del HIV, mediante la prueba Cobas®Ampliprep/Cobas® Taqman® HIV-1. Se recomienda validar el modelo propuesto con un número más amplio de muestras.
Palabras clave: VIH-1, ARN, carga viral, sangre seca en papel de filtro, CAP/CTM HIV-1 Test.
INTRODUCTION
The quantitative determination of RNA or viral load (VL) of human immunodeficiency virus type 1 (HIV-1) in the plasma, is an essential tool to assess the risk of the progress of the infection toward the acquired immunodeficiency syndrome (AIDS), and the effectiveness of the anti-retroviral therapy in patients [1].
Commercial assays available today to determine VL are the outcome of advances in research, mainly focused on increasing the sensitivity, precision, dynamic ranges and identification of the genetic variants of a virus characterized by its high mutation rate [2, 3]. These trials operate on technologies such as real time polymerase chain reaction (RT-PCR), which has enabled the automation of the systems, reducing human error and increasing working efficiency [4].
Although the ideal specimen for VL quantification of HIV-1 is the plasma, certain researchers have tested dried blood spots specimens (DBS) on filter paper using different commercial kits or standardized laboratory methods, because of its economic and technical advantages. DBS has shown its usefulness, above all in locations lacking the costly infrastructure used for regular trials [5-9].
In Cuba, as part of the decentralized medical care medical care of people living with HIV/AIDS, several laboratories have been set up to facilitate the patients’ access to VL determinations. A test from Roche Molecular Systems, which has been validated for human plasma specimens, is used for this purpose. However, specimen processing and transportation for the assay is hindered in rural and mountainous areas.
This test has not been well assessed with DBS, but this sample type has advantages that makes it attractive. They include its stability, in spite of high temperature, and ease of transportation, by which specimens can even be sent through the postal system. Therefore, we decided to evaluate DBS with the Cobas® Ampliprep/Cobas® Taqman® HIV-1 test, version 2.0 (Roche Molecular Systems, Inc., New Jersey, USA), as an alternative to simplify specimen processing and transfer for VL determination in specialized laboratories.
MATERIALS AND METHODS
Ethics
Procedures followed the ethical standards of the Ministry of Public Health (MINSAP), and of the Ministry of Science, Technology and Environment (CITMA), of the Republic of Cuba, which take into account the principles of the Helsinki Declaration for medical research in humans [10]. An informed consent was obtained from each patient participating in the study before taking the blood sample, and their identity remained confidential.
Patients and specimens, blood processing, HIV-1 RNA quantification
Forty-three specimens of total blood were obtained from persons infected with HIV-1, using ethylene-diamine-tetra acetic acid (EDTA) as the anticoagulant, to study the correlation between VL in the plasma and in the DBS. The samples were taken regardless of the infective genetic variant of the subjects in the study and whether or not they were under anti-retroviral treatment. Drops of 50 µL of blood were applied on cards of filter paper 903 (Whatman, Madstone, United Kingdom), which had been labeled to identify each patient. The remaining blood plasma was separated by centrifugation at 1600 × g for 20 min, in a centrifuge model 3K15 (Sigma, USA); it was dispensed in aliquots of 1.5 mL in sterile polypropylene test tubes and frozen at -15 ºC. The cards with the blood spots were left to dry at room temperature (approximately 24 ºC) for 16 to 18 h. They were later placed in individual plastic bags containing desiccants and stored at 2-8 ºC until their analysis. Both the plasma and the DBS cards were preserved until they were used.
To evaluate linearity, precision and the sensitivity of the trial with DBS we also obtained total blood, using EDTA as the anti-coagulant, from a patient with a plasma VL of 4.2 × 10⁵ copies/mL. Serial dilutions were prepared on a basis of 5, from 1:5 to 1:15 625, for which O negative blood (O-) from a donor who was seronegative to HIV, as well as to the Hepatitis C and Hepatitis B viruses, was used as a diluent. The product of each dilution was applied in drops of 50 µL on filter paper cards, and the same procedure described above was used for drying and preservation. Linearity was assessed by three trials. The VL was quantified in the pure DBS specimen and in the six serial dilutions prepared from it. Three replicates of all concentrations used were tested, and the trials were performed on different days, so that the results could be used to analyze precision and determine sensitivity.
For DBS specimen processing two spots were cut (equivalent to 100 µL), from the filter paper card, and they were then cut again into smaller fragments and placed in a sterile polypropylene test tube. A total of 1.2 mL of the regulating solution Tris-EDTA (Tris-HCl 1.0 mol/L, pH 8.0; EDTA 0.1 mol/L) were added for blood elution for 2 h, at 2-8 ºC. Later, 1 mL was recovered from the content of the test tube, for its analysis.
The Cobas®Ampliprep/Cobas®Taqman® HIV-1 Test, version 2.0 (Roche Molecular Systems, Inc., New Jersey, USA) was used according to the manufacturer’s indications. The only change was the use of a sample of DBS by the described procedure. This test, targeted on the gag and LTR regions of the genome of the HIV-1, for its amplification and detection, and having a sensitivity of 20 copies/mL, was carried out on the platform for the real time PCR Cobas®Ampliprep/Cobas®Taqman® 48 (CAP/CTM 48) (Roche Molecular Systems, Inc., New Jersey, USA), and all operations were performed from the data station of the device, using the Amplilink, version 3.2 program.
Statistical processing and interpretation of results
The values of VL are transformed to log10 for the calculations. With the values of VL, we analyzed the regression in the plasma-DBS pairs using the InfoStat, version 1.1 statistical program (Córdoba, Argentina). The model from the regression analysis obtained was used to predict the VL in the plasma through the result given by the DBS. The values of the VL of the DBS specimens were thereby interpolated in the x axis, and the resulting values from the y axis were the values predicted from the VL of the plasma in these same samples. The means of the true and predicted values of VL were compared by a Student's t test for independent samples, with the Statgraphics Plus software for Windows, version 5.1 (Maryland, USA).
The correlation between the results of both types of samples was evaluated through the Pearson linear coefficient of correlation, and for their agreement the Bland-Altman method was used [11]. Before this, the Shapiro-Wilk test was carried out, with the statistical package R, version 3.0.1 (Statistics Department of the University of Kentucky, USA) to know if the differences between the values of the VL in the plasma-DBS pairs followed a normal distribution.
Finally, the regression in the linearity study was analyzed, and the coefficients of variation were calculated to evaluate the intra- and inter-assay precision.
RESULTS AND DISCUSSION
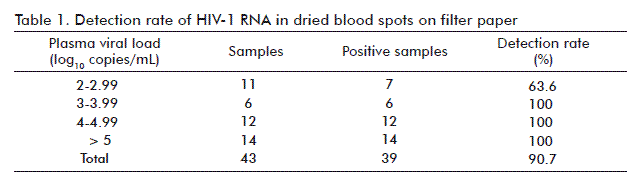
The values of RNA in the plasma of the 43 specimens studied were in the range of 40 to 2 450 000 copies/mL, with a mean of 10 000 copies/mL. No RNA was detected in four specimens of DBS, for a total detection rate of 90.7 % (Table 1). The VL in the 39 samples of DBS with detected RNA averaged 2250 copies/mL and ranged from 40 to 155 000 copies/mL. The VL in the plasma of four samples, where the RNA was not detected in the DBS, was in the range of 40 to 216 copies/mL. The viral RNA was quantified in 63.6 % of the spe-cimens showing levels of VL in the plasma lower than 1000 copies/mL, when using DBS. This effect on the sensitivity of the DBS specimen when viral levels are low has also been found in other VL quantification tests [12-14]. Nonetheless, although the virologic success of the antiretroviral therapy is measured by the VL reach-ing undetectable levels, in clinical practice it is normal to make decisions when the levels of viral RNA surpass 1000 copies/mL. Therefore, under our conditions, the ineffectiveness of RNA quantification in 36.4 % of the DBS specimens with less than 1000 copies/mL is irrelevant for the follow-up of these patients.
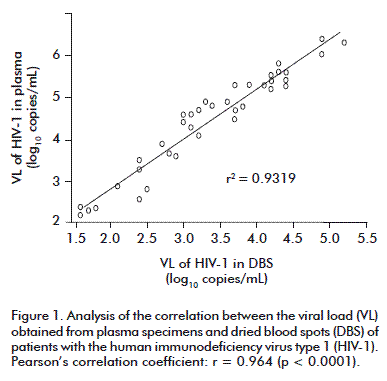
In the 39 pairs of samples where RNA was detected, we obtained a high correlation of the VL (r = 0.964, p < 0.0001) (Figure 1), as reported by other groups [15-18].
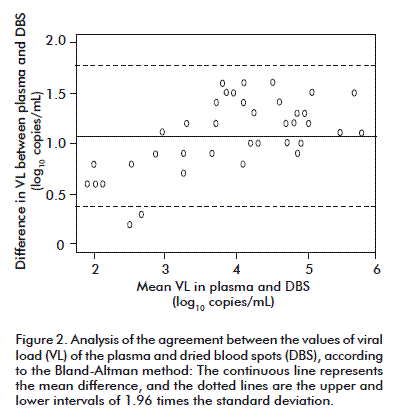
The average difference between the values of the VL obtained for both types of samples was of 1.07 log10 copies/mL. Differences of 0.53 log10 have been reported between the results of the researchers using platforms and assays that are similar to this study [17]. In another study there was an average difference of 1.0 log10, by using the Cobas® TaqMan® instrument and with an extraction procedure that differed from ours [14]. According to the Bland-Altman model, the agreement limits were 0.378 (0.178-0.577) and 1.771 (1.571-1.969) log10 copies/mL (mean ± 1.96 times the standard deviation), respectively, and 94.8 % of the values were in that range. This showed a high agreement between the values of the VL for both types of samples (Figure 2).
The regression analysis in the linearity evaluation with the sample of DBS, in the three assays, showed regression values that were very close to 1, with an average of 0.98. This value is very similar to that reported by the manufacturer of the test for the plasma specimen (0.989). The detection of RNA in DBS was linear within a wide dynamic range of 134-420 000 (2.1-5.6 log10) copies/mL. The lower limit of detection (LLD) in this study was less than the LLD found by other researchers in similar studies [19-21].
Since the input volume and the type of sample influence the sensitivity of these tests, and in this study we are testing a different type of sample and a volume lower than that recommended by the manufacturer, the challenge is to know when a result with DBS should be considered cautiously. This depends on a possible contradiction with other factors and parameters analyzed in the patient in this study. Probably, in specific cases, it may be necessary and advisable to analyze the VL in the plasma.
At the same time, the levels of VL that would indicate when important therapeutic decisions must be made, such as the start of the treatment and a change in the therapeutic regime, the latter being generally necessary because of the virological failure, are quantified here using DBS, since the dynamic range shown by the test with this type of sample is able to cover it. The levels of VL leading to these decisions are when viral load is higher than 40 000 or 50 000 copies/mL, or when the CD4 count is less than 350 cells/mm3, according to the Cuban standards for comprehensive medical care for persons living with HIV/AIDS. Several studies have demonstrated that the use of DBS is reliable for quantifying levels of viremia that characterize these infection stages [12, 14, 19]. Moreover, it is known that the VL is not the only parameter evaluated by specialized clinical physicians when designing therapeutic strategies.
The volume of DBS used to quantify the VL has been variable [22]. Some authors using a volume similar to that of this study obtained results showing less sensitivity [20, 21]. One explanation for this could be that the tests used (Abbott Real Time, NucliSENSEasy Q HIV-1 and CAP/CTM HIV-1 Test; from several companies) do not focus on the same region of the genome for the analysis; they differ in the amplification principle, in the lower detection limit, and in the reagents and methodologies used for the lysis [2].
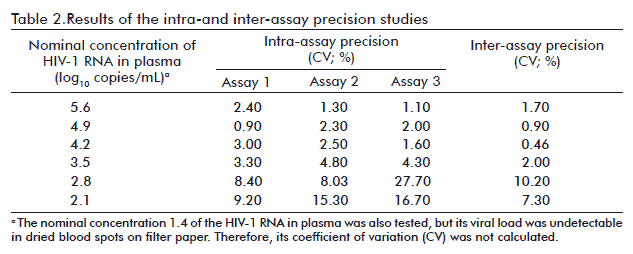
Table 2 shows the results of the intra- and inter-assay precision tests. The coefficients of variation obtained, which were less than 10 %, indicate that the precision of the test with the DBS sample was satisfactory. However, in the concentrations of 2.8 log10 and 2.1 log10 some of the values are higher than 10 %; and although it has been stated that high coefficients of variation, of over 20-30 %, are considered acceptable for crude data [23], the effect may be largely due to incorrect handling, rather than the type of specimen.
The linear regression analysis in the correlation study resulted in the following equation: y = 1.18 x + 0.47. This was used as described in the Materials and Methods section. The results of the comparison between the true and predicted values of the VL, in the plasma of the samples studied, are shown in figure 3. It was demonstrated that there is no significant statistical difference between the means of both values, for a confidence level of 95 %. Therefore, this way of calculating the value of the viral load of HIV-1 in the plasma of infected persons, could be effective if we consider that the model should be validated with a larger number of samples.

CONCLUSIONS
Satisfactory results were obtained in this studyafter quantifying the RNA from the HIV-1 through DBS specimens with the Cobas® Ampliprep/Cobas® Taqman® HIV-1 test, version 2.0 (Roche Molecular Systems, Inc., New Jersey, USA), endorsing its use. Although the universe of the study was not sufficiently large, these results are encouraging, due to the possibilities of the use of this type of specimen as a valid alternative. This may be beneficial for persons living with HIV/AIDS who have to come from Cuban areas located far from the laboratories for the analyses of their viral load. It is also useful for those people living in areas where the conditions are inappropriate for blood processing, plasma storage and its refrigerated transportation. After validating the model for the prediction of the VL in the plasma through the use of DBS, it may be possible to recommend the utilization of this type of sample in a reliable manner.
ACKNOWLEDGEMENTS
We would like to thank Eng. Josefina de Calzadilla, MSc., from the Agrarian University of Havana; Dr. Ileana Miranda, from the National Agricultural Health Center (CENSA by its Spanish acronym) and Orlando Martínez, MSc. from the University of Information Technology Sciences, for their valuable contribution to the statistical analyses.
REFERENCES
1. Mellors JW, Munoz A, Giorgi JV, Margolick JB, Tassoni CJ, Gupta P, et al. Plasma viral load and CD4+ lymphocytes as prognostic markers of HIV-1 infection. Ann Intern Med. 1997;126(12):946-54.
2. Luft LM, Gill MJ, Church DL. HIV-1 viral diversity and its implications for viral load testing: review of current platforms. Int J Infect Dis. 2011;15(10):e661-70.
3. Cobb BR, Vaks JE, Do T, Vilchez RA. Evolution in the sensitivity of quantitative HIV-1 viral load tests. J Clin Virol. 2011;52 Suppl 1:S77-82.
4. Espy MJ, Uhl JR, Sloan LM, Buckwalter SP, Jones MF, Vetter EA, et al. Real-time PCR in clinical microbiology: applications for routine laboratory testing. Clin Microbiol Rev. 2006;19(1):165-256.
5. Fiscus SA, Brambilla D, Grosso L, Schock J, Cronin M. Quantitation of human immunodeficiency virus type 1 RNA in plasma by using blood dried on filter paper. J Clin Microbiol. 1998;36(1):258-60.
6. O'Shea S, Mullen J, Corbett K, Chrystie I, Newell ML, Banatvala JE. Use of dried whole blood spots for quantification of HIV-1 RNA. Aids. 1999;13(5):630-1.
7. Mwaba P, Cassol S, Nunn A, Pilon R, Chintu C, Janes M, et al. Whole blood versus plasma spots for measurement of HIV-1 viral load in HIV-infected African patients. Lancet. 2003;362(9401):2067-8.
8. Ikomey GM, Atashili J, Okomo-Assoumou MC, Mesembe M, Ndumbe PM. Dried blood spots versus plasma for the quantification of HIV-1 RNA using the manual (PCR-ELISA) amplicor monitor HIV-1 version 1.5 assay in Yaounde, Cameroon. J Int Assoc Physicians AIDS Care (Chic). 2009;8(3):181-4.
9. Mehta N, Trzmielina S, Nonyane BA, Eliot MN, Lin R, Foulkes AS, et al. Low-cost HIV-1 diagnosis and quantification in dried blood spots by real time PCR. PloS One. 2009;4(6):e5819.
10. WMA Declaration of Helsinki - Ethical Principles for Medical Research Involving Human Subjects [Internet]. Ferney-Voltaire: World Medical Association, Inc.; 2013 [cited 2013 Oct 10]. Available from: http://www.wma.net/en/30publications/10policies/b3/.
11. Bland JM, Altman DG. Statistical methods for assessing agreement between two methods of clinical measurement. Lancet. 1986;1(8476):307-10.
12. Johannessen A, Garrido C, Zahonero N, Sandvik L, Naman E, Kivuyo SL, et al. Dried blood spots perform well in viral load monitoring of patients who receive antiretroviral treatment in rural Tanzania. Clin Infect Dis. 2009;49(6):976-81.
13. Marconi A, Balestrieri M, Comastri G, Pulvirenti FR, Gennari W, Tagliazucchi S, et al. Evaluation of the Abbott Real-Time HIV-1 quantitative assay with dried blood spot specimens. Clin Microbiol Infect. 2009;15(1):93-7.
14. Andreotti M, Pirillo M, Guidotti G, Ceffa S, Paturzo G, Germano P, et al. Correlation between HIV-1 viral load quantification in plasma, dried blood spots, and dried plasma spots using the Roche COBAS Taqman assay. J Clin Virol. 2010;47(1):4-7.
15. Alvarez-Munoz MT, Zaragoza-Rodriguez S, Rojas-Montes O, Palacios-Saucedo G, Vazquez-Rosales G, Gomez-Delgado A, et al. High correlation of human immunodeficiency virus type-1 viral load measured in dried-blood spot samples and in plasma under different storage conditions. Arch Med Res. 2005;36(4):382-6.
16. Reigadas S, Schrive MH, Aurillac-Lavignolle V, Fleury HJ. Quantitation of HIV-1 RNA in dried blood and plasma spots. J Virol Methods. 2009;161(1):177-80.
17. Carmona S, Seiverth B, Horsfield P, eSa B, Goerdes M, Stevens W. Evaluation of COBAS® AmpliPrep/ COBAS® TaqMan® HIV-1 v2.0 test on dried blood spots (DBS). Abstract No. TULBPE031. 6th IAS Conference on HIV pathogenesis and treatment; 2011; Rome, Italy. Geneva: International AIDS Society; c2013 [cited 2013 Oct 10]. Available from: http://www.iasociety.org/Default.aspx?pageId=12&abstractId=200743912.
18. Ouma KN, Basavaraju SV, Okonji JA, Williamson J, Thomas TK, Mills LA, et al. Evaluation of quantification of HIV-1 RNA viral load in plasma and dried blood spots by use of the semiautomated Cobas Amplicor assay and the fully automated Cobas Ampliprep/TaqMan assay, version 2.0, in Kisumu, Kenya. J Clin Microbiol. 2013;51(4):1208-18.
19. Brambilla D, Jennings C, Aldrovandi G, Bremer J, Comeau AM, Cassol SA, et al. Multicenter evaluation of use of dried blood and plasma spot specimens in quantitative assays for human immunodeficiency virus RNA: measurement, precision, and RNA stability. J Clin Microbiol. 2003;41(5):1888-93.
20. Abravaya K, Huang S, Erickson B, Mak W-B. The use of dried blood spots with the Abbott RealTime HIV-1 viral load assay. Abstract No. CDB0034. AIDS 2008 - XVII International AIDS Conference. 3-8 August 2008, Mexico City, Mexico. Geneva: International AIDS Society; c2013 [cited 2013 Oct 10]. Available from: http://ias2007.org/Abstracts/A200718278.aspx.
21. Kane CT, Ndiaye HD, Diallo S, Ndiaye I, Wade AS, Diaw PA, et al. Quantitation of HIV-1 RNA in dried blood spots by the real-time NucliSENS EasyQ HIV-1 assay in Senegal. J Virol Methods. 2008;148(1-2):291-5.
22. Hamers RL, Smit PW, Stevens W, Schuurman R, Rinke de Wit TF. Dried fluid spots for HIV type-1 viral load and resistance genotyping: a systematic review. Antivir Ther. 2009;14(5):619-29.
23. Jacobson RH. Validation of serological assays for diagnosis of infectious diseases. Rev Sci Tech. 1998;17(2):469-526.
Received in November, 2013.
Accepted in May, 2014.
Nancy M Ruiz. Laboratorio de Biología Molecular, Laboratorio de Investigaciones del Sida, Lisida. Carretera de Jamaica y Autopista Nacional, San José de las Lajas, CP 32700, Mayabeque, Cuba. E-mail: nruizg@infomed.sld.cu
