


 Servicios personalizados
 Español (pdf)
 Articulo en XML
 Referencias del artículo
 Enviar articulo por email
 Citado por SciELO
  Similares en
SciELO
Similares en
SciELO 
 Permalink
Introduction
The impacts caused by phenomena of natural origin have increased due largely to the lack of good territorial planning policies, which has led to the development of human activities in inadequate and insecure geographical areas, reducing productive efficiency, endangering lives and assets and limiting resilience to the onslaught of climate change.
Floods in Peru are a recurring problem every year, it is the most recurring event with the greatest impact in the country. Due to the seasonality of rainfall in the Andean region, which has a dry season and a well differentiated rain (the latter from December to March), added to the years of presence of the phenomenon of El Niño, make the river flows that descend from the Andean region to the coast increase their magnitude several times, overflowing and causing damage in cities and populated centers that are in their area of influence, until they reach the coast, specifically, in the northern region of the country, like: Tumbes, Piura, and Lambayeque.
Sometimes, these floods have reached the city of Lima with the overflows of the Chillón and Rímac rivers. Similarly, there have been large floods on the south coast of the country, in cities such as Ica and Pisco, which have left considerable material damage.
The Junin region, like many others, also suffers the impact of these floods and especially the city of Huancayo, with recurring floods over time. The rivers that cross this city, together with the deficient or non- existent drainage system make the occurrence of severe rains of very short impact generate real disasters in this city and in the same way in the urbanizations of its periphery.
The overflow of the Mantaro River, the main stream that crosses the city, is usually the most responsible for flooding in Hunacayo and its surroundings, and in this it has a lot to do with the contribution of the Cunas River, whose waters flow to the Mantaro affects Housing in the riverside sectors of Pilcomayo, mainly and could eventually generate landslides and / or waterways that obstruct access roads.
In the Cunas river sub-basin, in the presence of the rainy period, a series of floods that affect populated nuclei, infrastructure and agricultural areas are verified, before converging with the Mantaro and enhancing its destructive action.
Floods are potentially destructive recurring hydrological phenomena, which are part of the dynamics of the evolution of a current. They can be produced by intense rains or not so intense, but of very long duration, that progressively increase the flows of the currents and with it the height of the waters until they exceed the limits imposed by the banks of the canal. Depending on many factors, but mainly on the size, shape and relief of the river basin, these floods will have a greater or lesser time since the beginning of rainfall. Circular watersheds (almost unitary form factor), with a very large area and a medium high slope, will develop very fast and extensive floods and floods.
Therefore, in rivers that run in flat areas, flooding will be slow, with daily increases in water levels of the order of centimeters and generally affecting large areas, but should not cause large human losses. Everything that happens in the foothills of mountains or mountains, where due to its temporal dynamics, the current speed is high and causes numerous human losses, although its area of involvement may be less, as well as the time of permanence of the flooded areas, something that the authors share as Goerl and Kobiyama (2005), when it is considered that the higher the speed of the current, although it is not very high, the greater the damage.
According to Londe et al. (2014), the relationship between floods and the occurrence of disasters does not occur equally in all places, in some floods only a physical process that is not considered a disaster is performed, since it does not affect people, however in other floods impact vulnerable communities, overcoming their potential for recovery, becoming true human tragedies.
Other authors such as Myronidis et al. (2009) have developed different models to assess the danger and risk of flooding from the application of hydrological and hydraulic models, which in large some of the cases lack data available on a large scale.
For this reason, this study had as its main objective the determination of the scenarios susceptible to flooding in the Cunas river basin, based on a geoprocessing methodology in a GIS environment and validation in field trips, which have already been successfully applied in other territories (García-Rivero et al. 2017).
Methodology proposal
There is an abundance of methods that allow modeling a large number of hydrological and hydraulic processes that are related to river floods. These have been the product of a process that began with the Standford Watershed Model (SWM) of Crawford and Linsley in 1966 and is consolidated with the emergence and development of the first Geographic Information Systems (GIS) in the late 1990s. (Stehli et al. 2014).
Depending on their type, the models can be deterministic, probabilistic, conceptual and black box physical or mathematical (numerical). In the case of GIS implementations, of the wide range of existing software SAGA-GIS, with a large arsenal of tools for hydrological modeling is very suitable for the determination of areas susceptible to flooding.
The methodology and materials used in the present study respond to the undoubted advantages of the incorporation of Geographic Information Systems (GIS), remote sensing and digital image processing in hydrological models. The vast majority of the authors agree that these tools provide a more accurate calculation of the physical parameters necessary to operate with hydrological models, there is an increase in the resolution of spatial work at all levels, making it possible to analyze the spatial variation of factors such as runoff coefficients or similar, which until now were considered as constant parameters of single value (Olaya 2004).
This methodology has been applied successfully in the region of Madre de Dios, Peru and different basins in western Cuba, in which the high resolution of the method has been corroborated in the field verification work when discriminating and rank the susceptibility of the areas to floods (García-Rivero et al. 2017).
A characterization of the scenarios susceptible to flooding in the event of intense and/or prolonged rains for the Cunas river basin, represents valuable information, which will allow the competent authorities, a better estimate and management of disaster risk due to flooding in the territory studied, with the implication that it can have in the reduction of potential material, infrastructure and human losses.
The methodological variant applied is based on the fundamental assumption that the relief is the most responsible for the distribution of water on the earth's surface and that, based on geomorphological and hydrological criteria highly dependent on the relief, a series of factors or parameters that are calculated under the options of version 2.2.5 of SAGA-GIS.
The variables used and that are calculated in the SAGA-GIS from the ALOS PALSAR (Advanced Land Observing Satellite) DTM, and that allow determining the areas with the greatest susceptibility to floods are: Closed depressions (CD), Vertical distance to the drainage network (VD), Collection area modified (MCA), surface runoff - Runoff-overland flow D8, and the topographic moisture index (TW1). The flood susceptibility value is obtained as the weighted sum of these five variables according to the equation (1). A detailed description of this methodology is given in García-Rivero et al. (2017).
In the field validation work, unstructured interviews will be conducted with residents, to know the extent of the floods that have taken place in the territory previously, which will be crossed with the information obtained in the initial bibliographic-documentary search.
Study site
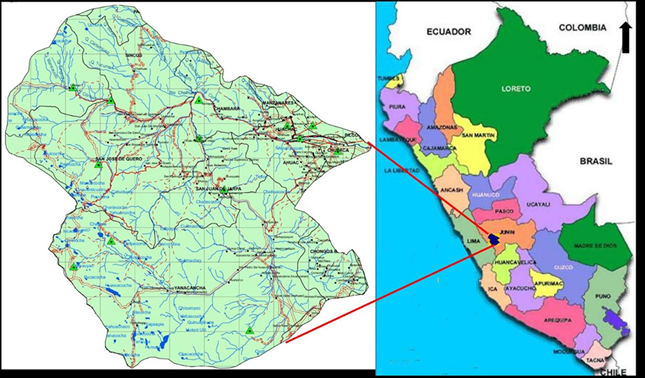
The Cunas River is a river that is located in the Junín region, in the central area of Peru. It begins in the Western Cordillera at 5180 m and crosses the province of Chupaca, the province of Concepción and the province of Huancayo. Before re-entering the province of Chupaca, it forms a U, belonging to the Mantaro river basin. Its mouth is approximately 3220 m away on the Mantaro River, on the border of the districts of Pilcomayo and Huamanca, respectively in the provinces of Huancayo and Chupaca. Its route is from southwest to northeast and enters the V-shaped Mantaro valley that is the main valley of central Peru and the widest of all the central Andes (figure 1).
The regime of the Cunas River is perennial, with lake and rain feeding, since it has 201 bodies of water (lagoons), 11 of these have surfaces greater than 0,2 km2, whose characteristics are shown in table 1. Through its channel, with an approximate length of 98,7 km, water runs throughout the year, with higher flows with high concentrations of suspended solids from December to April.
Table 1 Characteristics of the main lagoons of the Cunas river sub-basin
| Lagoon | Area (km2) | Flow (m3/s) | Altitude (mamsl) | Coordinates | Current usage | |
|---|---|---|---|---|---|---|
| E | S | |||||
| Quiullacocha | 1,12 | 8,24 | 4531 | 0445325 | 8639187 | dammed |
| Quisococha | 1,20 | 12,28 | 4632 | 0441076 | 8640134 | dammed |
| Huascacocha | 1,12 | 6,16 | 4438 | 0436545 | 8646638 | dammed |
| Coricocha | 0,23 | 5,13 | 4663 | 0430167 | 8652949 | irrigation |
| Patococha | 0,21 | 2,04 | 4328 | 0429172 | 8664116 | irrigation |
| Cuncancocha | 0,25 | 4,26 | 4552 | 0433174 | 8658498 | irrigation |
| Chichicocha | 0,36 | 46,24 | 4537 | 0435143 | 8654154 | irrigation |
| Boliche | 0,26 | 3,12 | 4520 | 0423077 | 8666573 | dammed |
| Chalhuancocha | 0,27 | 2,86 | 4468 | 0421163 | 8672959 | irrigation |
| Acococha | 0,26 | 1,76 | 4429 | 0428175 | 8681184 | irrigation |
| Shinchicocha | 0,24 | 2,16 | 4427 | 0480057 | 8683526 | irrigation |
In table 2, its main morphometric characteristics are presented, where the Compactness index (Ic) or Gravelius Index stand out with 1,64, which corresponds to an elongated sub-basin (oval-oblong) with average concentration time and the flood waves not continuous. On the other hand, the drainage density (Dd) has a value of 0,65 which indicates a low development of the drainage network.
Table 2 Main morphometric characteristics of the Cunas river sub-basin.
| Indicator | Units | Value |
|---|---|---|
| Area (A) | km2 | 1704,20 |
| Perimeter (P) | km | 241,44 |
| Main channel length (Lm) | km | 98,67 |
| Average width of the sub-basin (W) | km2 | 17,27 |
| Total length of the drainage network (Ld) | km | 1099,40 |
| Density of the drainage network (Dd) | km/km2 | 0,65 |
| Compactness index (Ic) | dimensionless | 1,64 |
| Circularity factor (Fc) | dimensionless | 0,21 |
The Cunas sub-basin is divided into nine minor hydrographic units or micro-basins, among which are those of the Huachuas, Seco, Alto Cunas, Medio rivers Cunas, Apaguay or Sulcan gorge, Chalhuas and Bajo Cunas microbasin.
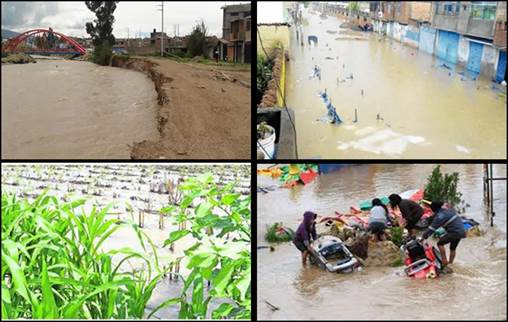
As illustrated in figure 2, every year, in the rainy season and in the years with the presence of the El Niño phenomenon, significant floods occur in the Cunas river basin, destroying bridges, sectors of the road network, crop areas, homes and other infrastructure with the consequent loss of material and, sometimes, of human lives (SENAMHI 2017).
Behavior of the main variables evaluated
From the processing of the hydrologically corrected DTM, the maps corresponding to the hidro- geomorphological variables were obtained. Figure 3 shows these five maps where it is possible to assess the high resolution power of the variables vertical distance to the drainage network (DV) and SAGA topographic humidity index (TWI) when delineating future scenarios susceptible to flooding. As a result of these five maps were typified by standardization and applying the weighted linear sum of them to obtain the map of the Hydromorphometric Contrast Index (HCI), where the resulting values are moved between 5 and -5, representing -5 the lowest susceptibility and 5 the highest susceptibility to flooding.

In order to classify this synthetic map into representative categories of the flood phenomenon, the statistical behavior of its values was analyzed. The histogram corresponding to them had a good normal distribution of the data, which allowed to apply the methodology of the standard deviations for its categorization and to arrive at the final map of susceptibility to the floods (García-Rivero et al. 2017) (See figure 4).
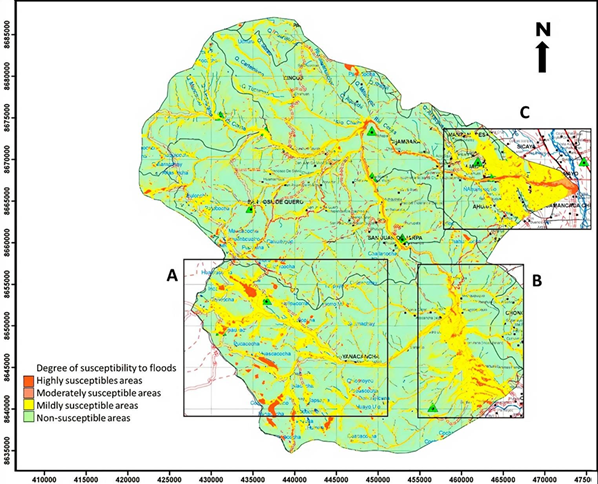
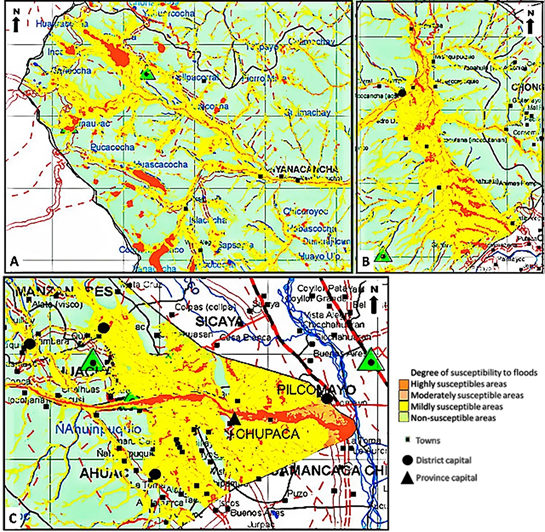
In this resulting final map of the processing it was possible to identify three fundamental sectors where the flood scenarios occupy areas of consideration. In attention to this situation, select three detail sectors (A, B and C) for your best representation and analysis that are shown in figure 5.
In sector A, there are at least five towns that are in areas categorized as Mildly susceptibility, as well as other areas associated with the lagoon systems of the headlands in the extreme southwest of the sub-basin with categories between Mildly to Highly susceptibility (figure 4A).
Around 14 towns and a district capital are located next to the banks of the Cunas river and its tributaries as shown in figure 5B, which classify in the categories of mildly to moderately susceptibility and that with certain periodicity undergo flood events.
Discussion
Every year near the confluence of the Cunas River with the Mantaro River, a series of floods occur, with the consequent destruction of bridges, sections of roads, crops, houses and damage to the health and well-being of the population. This area is shown in detail sector C of figure 5, where several district capitals and one provincial capital, the city of Chupaca, classify as areas of mild to high susceptibility. In Grupofiesta (2019), the occurrence of this type of event in February 2019 is reflected, corroborating this categorization.
These flood events induced by the Cunas River cause serious damage to the City of Huancayo and its surroundings, such is the case of the Chanchaspampa sector, December 3 district (Chupaca), where an average of 200 families are at risk each year. of being dragged by the mentioned river, living a few meters from the shore. In the same way, in Pilcomayo characterized in this work as very high susceptibility to floods, there is information that records the destruction of bridges that connect various populations in that sector during 2017. (El Comercio 2017).
The contracting of the abundant information from historical records of flood events, mainly journalistic, with the results of the investigation, together with the field verification tours in this sub-basin of the Peruvian montain range, highlighted the effectiveness and accuracy of the methodology used.
Final considerations
The methodology used allowed establishing the flood hazard scenarios in the face of heavy or prolonged rains in the Cunas river sub-basin. In it, three sectors were identified where there is a greater susceptibility to this phenomenon and a significant number of towns, district and provincial capitals are exposed.
These results, validated with the field control works and the documentary sources, confirm once again the effectiveness of said methodology and its feasibility of application in any type of hydrographic basin.
The map resulting from the present study is a valuable input for flood disaster management to be carried out by the different levels of government in the territory and the river basin councils, since it contributes to delimiting flood hazard scenarios and recognizing first Instance vulnerability by exposure to one of the most frequent and destructive phenomena.

