


Mi SciELO
 Servicios personalizados
Servicios Personalizados
Articulo
 Inglés (pdf)
 Articulo en XML
 Referencias del artículo
 Enviar articulo por email
Indicadores
-
 Citado por SciELO
Links relacionados
-
 Similares en
SciELO
Similares en
SciELO
Compartir

 Permalink
Revista Cubana de Informática Médica
versión On-line ISSN 1684-1859
RCIM vol.7 no.2 Ciudad de la Habana jul.-dic. 2015
ARTÍCULO ORIGINAL
Heart Rate Variability Analysis Based on Photoplethysmographic Signals
Análisis de la Variabilidad de la Frecuencia Cardíaca a partir de Señales Fotopletismográficas
Emmanuel Syed Hasan,I José Luis Hernández CáceresII,III
I Physics Department, Division Of Physical And Natural Sciences, School of Arts and Sciences, University Of The Gambia (UTG). E-mail: syed.emmanuel@gmail.com
II Biomedical Sciences Department, School of Medicine and Allied Health Sciences, University of The Gambia (UTG). E-mail: cacerjlh@yahoo.com
III Universidad de Ciencias Médicas de La Habana, La Habana, Cuba. E-mail: cacerjlh@infomed.sld.cu
ABSTRACT
An algorithm for extracting tachograms for Heart Rate Variability (HRV) analysis on the basis of Photoplethysmographic (PPG) signals (instead of electro cardiograms) has been proposed. The main feature of this proposal is to detect peaks from correlograms between a pattern waveform and a sliding time window in the PPG signal. Analysis was carried out with a set of two groups of patients (young and elderly).HRV variables were estimated using the publicly available Kubios HRV package. Results showed that both the sympathetic component of the autonomous nervous system (assessed by LF/HF) and the cardiovascular complexity (assessed by correlation dimension) are reduced with age. These results are supported by literature and may be taken as a support for the validity of the proposed algorithm. Since oximeters for getting PPG signals are affordable even in poor settings, this allows extending autonomic nervous system studies into remote areas of developing countries.
Key words: heart rate variability, PPG signal, correlogram, autonomic nervous system, complexity.
RESUMEN
Se propone un algoritmo para obtener tacogramas con la finalidad de realizar estudios de variabilidad de la frecuencia cardiaca, partiendo de registros de señales fotopletismográficas (PPG). La principal peculiaridad de esta propuesta lo es la detección de los picos en las ondas de la señal PPG a partir de un correlograma obtenido como una secuencia de correlaciones entre una onda patrón y una ventana deslizante de la señal PPG. Se realizó un análisis de variabilidad de frecuencia cardiaca sobre dos grupos de pacientes (jóvenes y de avanzada edad). Las variables de variabilidad de frecuencia cardiaca seleccionadas se obtuvieron a partir del programa "Kubios HRV", de acceso público y gratuito. Los resultados mostraron que tanto el componente simpático del Sistema Nervioso Autónomo (evaluado a través de la variable LF/HF) como la complejidad cardiovascular (evaluada a través de la dimensión de correlación) disminuyeron con la edad. Estos resultados encuentran apoyo en datos de la literatura que apoyan así la validez del algoritmo propuesto. Por cuanto el oxímetro utilizado para obtener las señales PPG está al alcance de instituciones primarias de salud se hace posible de esta manera extender estudios del sistema nervioso autónomo hacia áreas remotas de países en desarrollo.
Palabras clave: variabilidad de la frecuencia cardiaca, señal PPG, correlograma, sistema nervioso autónomo, complejidad.
INTRODUCTION
Autonomic Nervous System (ANS) function impairments are associated to many diverse pathological conditions. Assessing ANS function is not as simple as assessing heart function (by ECG) or overall brain function (via EEG). The network of ANS nodes are scattered, and relatively small ganglia are difficult to be electrically recorded in vivo; the special ANS tests available can be carried out only by specialized and skilled personnel.
Since 1980's with the wide spread application of Heart Rate Variability (HRV) studies, ANS assessments found new avenues.1 First report about heart rate variability corresponds to 1973.2
The basic recording for HRV analysis is the so called tachogram, a sequence of heart beat durations plotted against heart beat numbers.
Different indices estimated from a tachogram have been associated with either sympathetic or parasympathetic function.3 At the same time it has been supposed that some HRV indices are associated to the global complexity of cardiovascular system, not merely to ANS function.4
HRV analysis is relatively inexpensive since an ECG machine, a data cable and a computer are enough to get the analysis, especially when reliable packages for HRV analysis are readily available.5 Unfortunately in some settings even these requirements are not met, thus seeing plausible to explore other attractive ways for sustainable HRV analysis in developing countries.
Pulse Oximetry has been neglected for many years by some, regarding that it provides no relevant information about individuals' health.6 In the 2000's, however, researchers have been engaged in the analysis of the photoplethysmographic (PPG) signal, one of the main constituents required for oximetry analysis.7-9 In particular, it has been suggested that HRV can be assessed from a PPG signal.10 Most of the proposed solutions, however, are either based on mobile platforms or lack the flexibility and the affordability required in primary health settings.11
Here, we are proposing an algorithm for obtaining tachograms from PPG data. By using a freely available package for HRV analysis, we can perform high quality HRV analysis at the lowest cost possible. The reliability of results obtained while comparing young and elderly subjects supports the plausibility of our approach.
METHODS
Subjects: Two groups of apparently healthy individuals with no history of cardio-vascular complications were included in the present study, one group included 13 young subjects (ages 16-28) and another group of 8 elderly persons (ages 67-80)
Data for PPG recording data were acquired through a Berry Pulse Oximeter (Shanghai Berry Electronic Tech Co., Ltd, Shanghai, China) and transferred through Bluetooth protocol into a desktop computer (Intel Pentium 4, 1 GB RAM memory). Sampling rate was 100 Hz. Recordings were taken after 5 minutes of relaxing, subjects were in a sitting position and recording lasted 5 minutes.
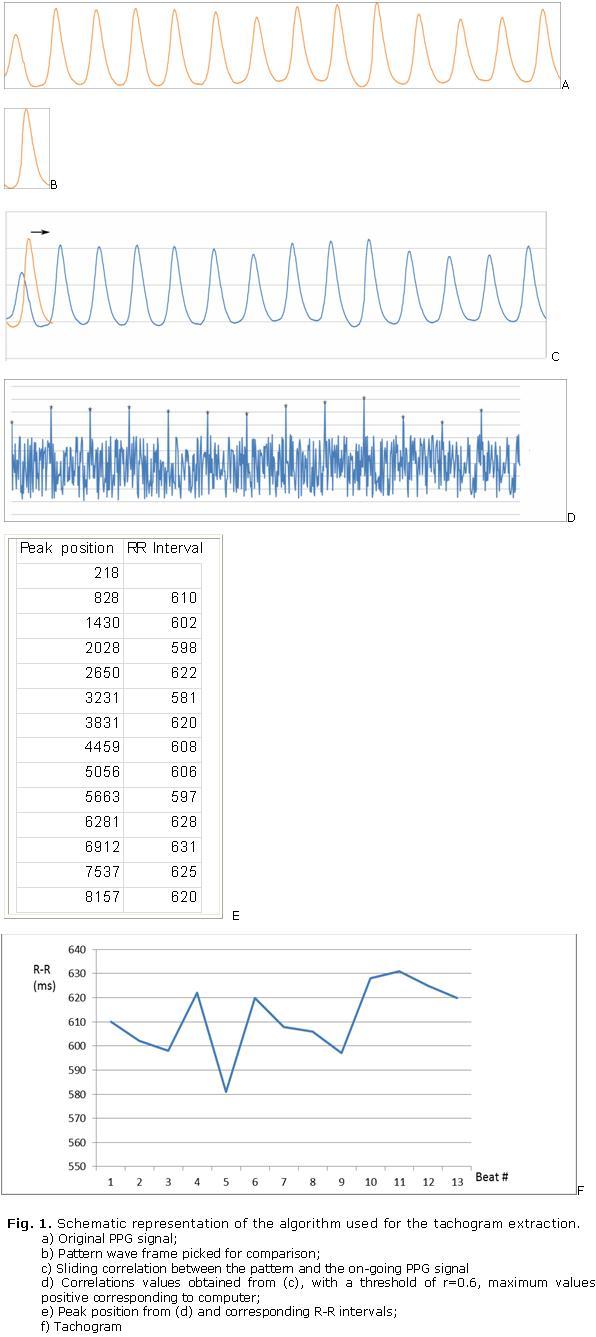
Peak Detection: the algorithm for peak detection was developed in Scilab. For that a typical PPG wave corresponding to a full heart cycle was picked from the subjects' individual signal and taken as pattern for comparison. Let L be the length of the pattern vector. By sliding the pattern along the original recording correlation was estimated between the pattern and each consecutive L-sized overlapping window of the original signal as a result a correlogram is obtained by defining a threshold ( e.g.; r = 0.6). Peaks were found as maximum values of the correlogram above the threshold value. From the difference of the least of peak positions the tachogram is acquired. A schematic description of the algorithm is represented in figure 1 below.
HRV Analysis; the Kubios HRV (Version 2.2, University of Eastern Finland, Kuopio, Finland) was used. The following two variables were estimated:
- LF/HF. Frequency domain measure reflecting the level of the sympatho-vagal balance.12-13
- d2. It measures the correlation dimension, an index for complexity of the whole cardiovascular system.14-15
Statistical Analysis. The non-parametric Mann-Whitney U Test was used for group comparison (p< 0.05) was set as significance level.
RESULTS
In Figure 2, a typical PPG recording is represented.
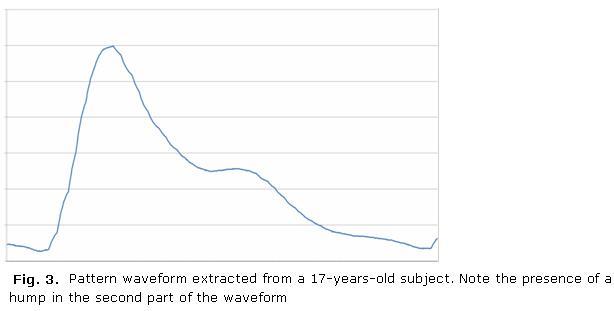
As it can be noticed the first wave in the trace is much lower than the others. These can create some difficulty if a typical detection algorithm is use. Since correlation is size independent the algorithm introduced by us can avoid this shortcoming. Typical pattern vectors are shown in figures 3 and 4.
As is seen, age seems to heavily influence into the recordings' shape, however this topic is beyond the scope of the present study.
HRV Analysis
Table I resumes the values of the studied variables for all the subjects included into this research. As it can be observed both LF/HF and d2 are decreasing with age. This has been confirmed with non-parametric Mann-Whitney U Test (p= 0.003 for LF/HF, p= 0.017 for d2)
DISCUSSION
Here we introduced new scenario for carrying out HRV analysis that could be affordable for a wide range of low-income settings. To our knowledge this is the first time that a correlation based algorithm for peak detection is applied to HRV analysis. According to result presented in Table I the vagal component of the ANS tend to prevail with age. This is compatible with known facts as the reduction of Heart Rate with age.1 On the other hand the reduction in cardiovascular complexity with age is well documented.16 We interpret our result as a support for the validity for the algorithm of the tachogram construction based on PPG presented in this research.
CONCLUSION
An algorithm for tachogram estimation has been developed based on correlogram with respect to a wave pattern. Results obtained (reduction of LF/HF and d2 with age) point to the plausibility of the proposed approach.
REFERENCES
1-Tulppo MP, Makikallio TH, Seppanen T, Laukkanen RT, Huikuri HV. Vagal modulation of heart rate during exercise: effects of age and physical fitness. Am J. Physiology 1998; 274: 424-29.
2-Wheeler T, Watkins PJ. Cardiac denervation in diabetes. Br.Med.J 1973; 4:584-86.
3- Hernández JL, Namugowa AV, Iputo J, Hong R, García L, Sautié M. Towards the determination of the optimal recording duration for Heart Rate Variability Applications. A bootstrap study on the Fantasia HRV database. Revista CENIC Ciencias Biológicas 2005; 35:1.
4-Hernández JL, Foyaca SH, Garcia H, Sautié V. Namugowa: TOWARDS THE ESTIMATION OF THE FRACTAL DIMENSION OF HEART RATE VARIABILITY DATA. Electronic Journal of Biomedicine 2004;2:1.
5-Task Force of the European Society of Cardiology and the North American Society of Pacing and Electrophysiology. Heart rate variability: standards of measurement, physiological interpretation, and clinical use. Circulation 1996; 93:1043-1065.
6-Neuman MR. 1987. Pulse oximetry: physical principles, technical realization and present limitations. Adv Exp Med Biol. 220:135-44.
7-Awad AA, Haddadin AS, Tantawy H, Badr TM, Stout RG, Silverman DG, Shelley KH. The relationship between the photoplethysmographic waveformand systemic vascular resistance. J Clin Monit Comput 2007; 21: 365-372.
8- Holmes S, Peffers SJ. PCRS-UK Opinion: Pulse Oximetry in Primary Care 2009; Sheet No. 28. [cited 16 May 2014]. Available from: http://www.pcrs-uk.org
9- Hernández JL, Cabañas K, Jersys O, Rodríguez F, Hong R, García L. The Photoplethysmographic Signal Processed With Nonlinear Time Series Analysis Tools. Revista Cubana de Informática Médica. 1(1) ISSN: 1684-185.
10-Reyes I, Nazeran H, Franco M, Haltiwanger E. Wireless Photoplethysmographic Device for Heart Rate variability Signal Acquisition and Analysis. 34th Annual International Conference of the IEEE EMBS San Diego, California USA, 1 September 2012.
11- Geltz B, Berlier J, McCollum J. Using the iPhone and iPod touch for remote sensor control and data acquisition. IEEE SouthEastCon. Proceedings of the IEEE 2010; 9-12.
12-Pagani M, Lombardi F, Guzzetti S. Power spectral analysis of heart rate and arterial pressure variabilities as a marker of sympathovagal interactions in man and conscious dog. Circ Res 1986; 59:178-193.
13- Seyd A, Thajudin A, Jeevamma J, Paul JK. Time and Frequency Domain analysis of Heart Rate Variability and their Correlations in Diabetes Mellitus, P.T. International Journal of Biological and Life Sciences 2008; 4:24-27.
14-Goldberger AL. Non-linear dynamics for clinicians: chaos theory, fractals, and complexity at the bedside. Lancet. 1996; 347:1312-1314.
15- Schubert C, Lambertz M, Nelesen RA, Bardwell W, ChoiJ. B. Dimsdale JEEffects of Stress on Heart Rate Complexity-A Comparison between Short-Term and Chronic Stress. Biological Physiology 2009; 80:325-332.
16- Tejera E, Plain A, Portelinha A, Hernández JL, Rebelo I, Nieto-Villar JM. Heart rate variability complexity in the aging process. Computational and Mathematical Methods in Medicine 2007; 8:287-296.
Recibido: 3 de agosto de 2015.
Aprobado: 15 de octubre de 2015.

