


 Custom services
 English (pdf)
 Article in xml format
 Article references
 Send this article by e-mail
 Cited by SciELO
  Similars in
SciELO
Similars in
SciELO 
 Permalink
Dear Editor:
In the article “Adjustment of population growth curve applied to Covid-19 in Cuba”,1) which was recently published in your journal, the authors propose six types of models to approximate data from the distribution of COVID-19 in Cuba.
In,2,3 we define the following class of growth curves:
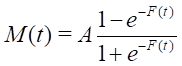 [1]
[1]
where
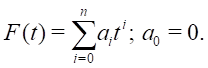 [2]
[2]
We will call this family the ”Half-Logistic curve of growth with polynomial variable transfer” (HLCGPVT). The model corresponds to a certain kinetic reaction scheme that gave good results in the analysis of data from the spread of COVID-19 in Bulgaria and especially for predicting the expected "initial saturation level" at an early stage of forecasting.
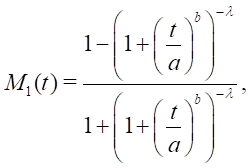
In Cordeiro, Alizadeh and Ortega4 proposed the following Exponential Half-Logistic Log-Logistic distribution with cumulative distribution function (cdf):
 [3]
[3]
where  .
.
In a particular case:  , we have
 [4]
[4]
We define the following new class of growth curves with polynomial variable transfer:
 [5]
[5]
where
 [6]
[6]
In this article, we study some intrinsic properties of the models [1]-[2] and [5]-[6] with polynomial variable transfer that give a very good approximation of the specific data on the pandemic in Cuba by June 5, 2020.
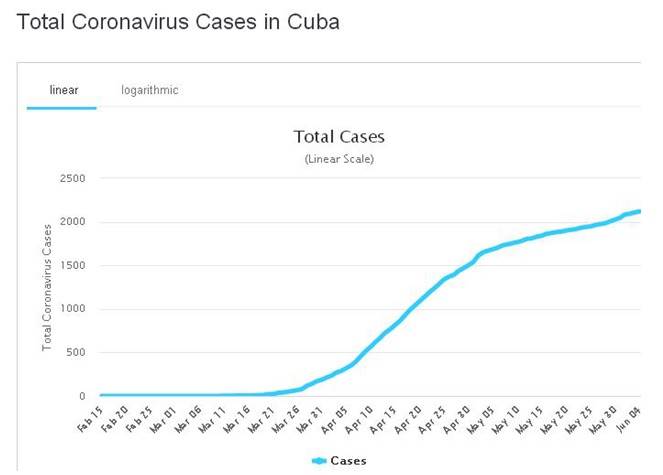
Numerical experiments
The following data ”Total Coronavirus Cases in Cuba (10/03/2020 - 5/06/2020)” is used in the modelling process. (Fig. 1)
Approximation with model [1]-[2]
For the real values in the specified period, the model - [1]-[2] for
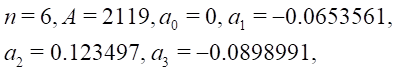
is depicted on Fig. 2.b.
(We have adopted a scale on the horizontal axis: 0.1 division corresponds to 1 day).
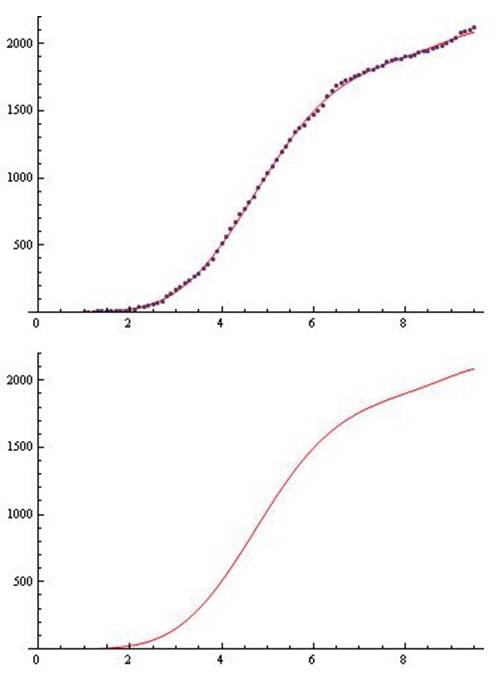
Fig. 2 a) The "real values" (10/03/2020 - 5/06/2020); b) The model [1]-[2] 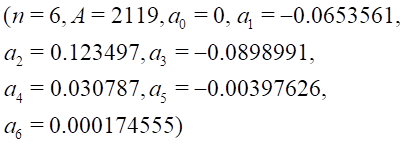 for the "real values" (10/03/2020 - 5/06/2020).
Approximation with model [5]-[6]
For the data ”Total Coronavirus Cases in Cuba (10/03/2020 - 5/06/2020)” the model [5]-[6] for
is depicted on Fig. 3.b.
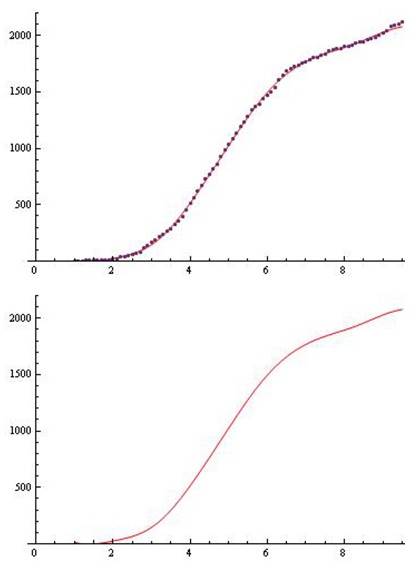
Fig. 3 a) The "real values" (10/03/2020 - 5/06/2020); b) The model [5]-[6] 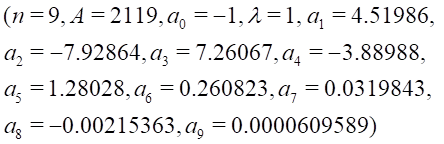 for the "real values" (10.03.2020 - 5.06.2020).
Concluding remarks
Appropriate parameters - for the various models of type [1]-[2] and [5]-[6] have been obtained using an optimization method for minimizing the sum of the squared differences between the data "real values" and the computed theoretical solution.
From Figures 2 and 3 we see that the approximations by the considered models (especially when approximating characteristic data in the specific section - at the end of the considered time interval) are very accurate.
In1, six models can be successfully expanded in the light of our considerations - by inserting corrective corrections of the type "polynomial variable transfer" and here we will skip their analysis.
It will take considerable time to propose adequate and powerful epidemiological models. We are convinced of this because, after such pandemics, there is always an "explosion" of serious scientific research.
In conclusion, we will explicitly note that the proposed research and future improvement of these models can be used successfully in the analysis of infection in the emerging and predicted by the World Health Organization next 1-3 scenarios of the disease.
We find similarities on the onset of the "initial saturation phase" for COVID-19 for Cuba and Bulgaria (approximate levels of pandemic control), which we believe is due to the extremely adequate sanitation and other measures taken by the governments and health authorities of both countries.
In addition, we are convinced (without being epidemiologists) that these achievements are due to the world-renowned successes of Cuban medical science and many years of experience in the prevention and treatment of lung diseases.
Appendix
For the ”saturation” by the model to the horizontal asymptote (i.e.  ) in Hausdorff sense(5) we have:
 [7]
[7]
or, equivalently,
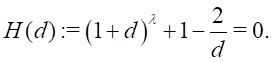 [8]
[8]
The following theorem gives upper and lower bounds for .
Theorem. The ”saturation” - satisfies the following inequalities for :
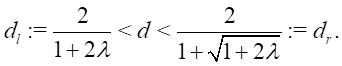 [9]
[9]
Proof. Clearly,  and
and  is an increasing function of . Hence, if [8] it has a root, then it is unique. Using the inequality for we have

The positive root of the quadratic in the numerator is
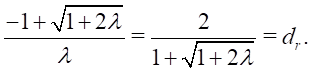
Then
 [10]
[10]
On the other hand, . Hence
For the derivation of
we have

Therefore  is a decreasing function of
  . Using we have
[11]
Since is an increasing function, the inequalities [10] and [11] imply that  has a unique root in the interval
  .
.
This completes the proof of the theorem.

