


 Servicios personalizados
 Inglés (pdf)
 Articulo en XML
 Referencias del artículo
 Enviar articulo por email
 Citado por SciELO
  Similares en
SciELO
Similares en
SciELO 
 Permalink
Introduction
Probabilistic Safety Assessment (PSA) has been widely used in Nuclear Power Plants Risk Analysis since the 80’s [1], mainly as a level 1 PSA oriented to the estimation of nuclear reactor core melt frequency. Currently, the previously performed PSAs are increasingly been used to improve Nuclear Power Plants operational safety as part of a Risk-Informed Decision Making Process [1, 2].
In a PSA the risk model is constructed and evaluated through the Event Tree analysis of the Initiating Events (IE), leading to reactor core melt when the failures of safety systems determine the occurrence of an accident sequence. On the other hand, the safety systems failures probabilities are calculated applying the Fault Tree technique. Hence, PSA is based on the extensive and joint utilization of these 2 complementary techniques: the Event Tree and the Fault Tree Analysis.
For the Electric Power Systems, Risk Analysis is also of cardinal importance. A great effort has been made in this area, especially to assure the energy supply of customers continuously. As accidents in the Electric Power Systems do not represent a great hazard requiring especial efforts for public protection, Risk Analyses were firstly directed to the evaluation of the probability of costumers’ disconnection due to failures and/or unavailabilities affecting the balance between energy generation and consumption. This scope of analyses constitutes a Reliability Analysis.
The Electric Power System Reliability Analysis is a detailed characterization of the System operational performance in terms of Reliability indicators, such as the Expected Demand Not Supplied (EDNS) [3]. Two main approaches are possible for Reliability and Risk Analysis of Electric Power Systems: analytical and simulation. Several analytical methods are available, such as block diagrams, fault tree analysis and Markov chains [3, 4], but they are all limited for large power systems because some huge models cannot be solved completely in the available RAM. As a consequence, the Monte Carlo simulation approach is usually used for large systems [4]. Additionally, the Monte Carlo method is more flexible than the analytical ones, allowing several types of probability distributions for components failure and repair times. As a disadvantage, the execution time to achieve the complete solution is significantly greater for the Monte Carlo simulation method, and the exhaustive character of the solution is not guaranteed.
Besides Reliability Analysis, the Electric Power Systems require the risk assessment of IE with capacity to produce cascading failures leading to partial or complete blackouts [5]. These are rare events, but they cannot be ignored due to their catastrophic consequences. They can be originated by extreme external events such as hurricanes or earthquakes, but they could also be the result of an internal IE [6], such as a short circuit, transmission overflow, human operational / maintenance error, etc., followed by protective devices failures. This type of Risk Assessment constitutes a Vulnerability Analysis [3], evaluating the consequences of different strains, that may include not only accidental failures but also terrorist attacks [7, 8]. The increasing use of modern Information and Communication Technology (ICT) based on digital systems (smart grids), cause new potential vulnerabilities as cyber-attacks and interdependent failures [8].
Fault tree analysis has been applied to Electric Power Systems, for Reliability Analysis [4, 9], Extreme Events Risk Assessments [6, 10] and design of reliable System Integrity Protection Schemes (SIPS) [11], but, it seems that, a full-scale risk assessment, combining Event and Fault Trees, as in a Nuclear Power Plant PSA, has only been proposed in [12].
Perhaps, the false perception of PSA as an extremely complex approach, together with the lack of a proper software, user-friendly and with capacity for solving complex fault trees, are impeding a more extensive application of PSA to Electric Power Systems Risk Assessments. Consequently, the present paper is dedicated to a PSA application, showing how a combined Event Tree / Fault Tree model can perform a probabilistic evaluation of the risk derived from the failure to isolate a short circuit in a transmission line. The powerful Advanced Combinatorial Method CSolv+ [13], implemented in a simple and user-friendly EXCEL software [14], was used for this purpose.
Material and methods
The PSA methodology consists of the following main steps:
1. Definition of the risk analysis objective and the list of IEs , including an estimation of their frequencies.
2. Construction of the Event Tree models for the previously defined IEs. The Event Tree (ET) is an inductive model, determining the possible sequences of events derived from the IE, as a result of the success or failure of the required protection systems in the ET headings.
3. Construction of the Fault Tree models for the protection systems in the ET headings. The Fault Tree (FT) is a deductive model, determining the possible causes of the system failure (top event), according to the system structure of subsystems, trains and components, establishing logical relations between the events through AND, OR and Voting (Majority) gates. Basic events, consisting of components failure modes, unavailabilities and human errors, are identified, including dependencies and common-cause failures.
4. Determination of the basic events reliability data and selection of the adequate reliability models . A reliability model is selected for each basic event, according to its failure type (stand-by or operation), maintainability (repairable or non-repairable) and failure detection mode (for stand-by failures: not controlled, continuously monitored or periodically tested).
5. Model quantification . Once the previous data and models have been introduced in the PSA software, it calculates the basic events failure probabilities and performs the linking of systems FTs to construct the accident sequences FTs, according to the ETs logic.
The first step of an accident sequence FT assessment is the qualitative evaluation, consisting of the Minimal Cut Sets (MCSs) determination. A MCS is a set of basic events leading to the top event (undesirable system damage or failure). The adjective minimal means that all basic events are indispensable for the top event occurrence.
The second step is the quantitative probabilistic evaluation of the MCSs to estimate the overall risk and the significant MCSs, as well as the basic events importance measures: Fussell-Vesely, Risk Reduction Worth (RRW) and Risk Achievement Worth (RAW). CSolv+ makes this evaluation in the Rare Event Approximation, as the sum of the MCSs probabilities, multiplied by the corresponding IE frequency.
6. Results analysis and decision making . The results are analyzed to understand the system behavior and check the model consistency. Based on the importance analysis, improvement measures are proposed tending to reduce the impact of the predominant contributors. Sensitivity analyses are conducted to estimate the effect of the considered measures in the overall risk. The PSA model is modified and recalculated several times until the main risk contributors are considered sufficiently balanced and the overall risk has been reduced under a predefined risk target. Sensitivity and uncertainty analyses are conducted to demonstrate that the probability of a global risk exceeding the target is sufficiently low, considering the uncertainties of models and data.
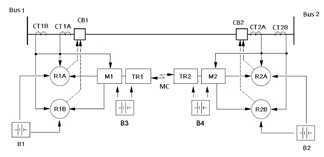
The previously described PSA methodology was applied to the transmission line shown in figure 1, adapted from a practical case analyzed in [10]. Additional current transformers and relays were introduced to reduce the risk of not clearing a short circuit in the transmission line.
These modifications allow showing the PSA model capacity to analyze complex systems, considering redundancies, dependencies and common-cause failures. The system components of figure 1, are identified by the following codes: CT - current transformer, CB - circuit breaker, R - relay, B - DC power system, M - Tone equipment, TR - Microwave transceiver, MC - Microwave channel.
The development of the transmission line PSA model, corresponding to figure 1, was structured following the steps 1 to 4 of the previously described methodology.
1. The objective of the risk analysis is to estimate the frequency of a catastrophic damage derived from a short circuit, not isolated by one or both circuit breakers (CB1, CB2). A short circuit in the transmission line can occur with an estimated frequency of 5 events per year. According to the failure location, 45% can be detected by CT1 (A or B) and CT2 (A or B), 35% only by CT1 (A or B) and 20% only by CT2 (A or B). The model was developed for the most critical case:
The expected damages, in monetary units, derived from a not isolated short circuit are assumed to be:
D - When only CB1 fails to open.
2D - When only CB2 fails to open.
10D - When both CB1 and CB2 fail to open.
2. The Event Tree for the previously defined IE is shown in figure 2. The ET headings are the Protection Systems PS1 and PS2, corresponding to the circuit breakers CB1 and CB2, respectively. The accident sequences are S2 (PS1 success / PS2 failure / Damage: 2D), S3 (PS1 failure / PS2 success / Damage: D) and S4 (Both PS1 and PS2 failed / Damage: 10D). The risk is calculated performing the evaluation of the accident sequence FTs for S2, S3 and S4, resulting from the fault tree linking of the IE with the system FTs of the Protection Systems PS1 and PS2, connected by an AND gate. For accident sequences S2 and S3, a NOT Gate precedes the FT of the system in success state.

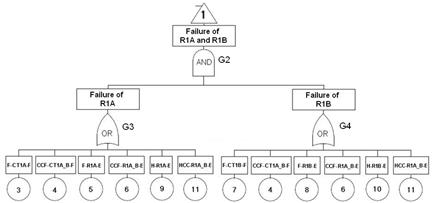
3. The Fault Tree for the Protection System PS1 is shown in figures. 3 and 4, while the Fault Tree for the Protection System PS2 is shown in figures. 5, 6 and 7.
The gates and basic events are numerated consecutively. The basic events are also identified by codes, appearing in the rectangles above the numbers. The first characters of the codes are F (failure), H (human error), CCF (common-cause failure) and HCC (common-cause human error). The last character of the codes indicates the failure mode: F (fail to function), O (fail to open) and E (fail to close). It is important to remark that the failures of the communication system (tone equipments, microwave transceivers and microwave channel) appear only in the fault tree of the Protection System PS2. On the other hand, the failures of the current transformers CT1A and CT1B contribute to the failure of both systems PS1 and PS2, while the failures of the current transformers CT2A and CT2B are irrelevant and do not appear in any of the FTs.


4. The basic event reliability data and models were selected from [10]:
DC power system: Mean failure probability of 5,0E-5/demand.
-
Circuit breaker:
Current transformer: Continuously monitored (Failure rate of 2,28E-7/h, mean time to repair of 48h)
Relay: Mean failure probability of 1,0E-4/demand; human error probability of 1,0E-4/demand.
Tone equipment: Mean failure probability of 1,0E-4/demand
Microwave transceiver: Mean failure probability of 2,0E-4/demand
Microwave channel: Mean failure probability of 1,0E-4/demand
For redundant components, it was assumed that 10% of the failure and human error probabilities are common-caused.
At this point the model is complete and data are introduced in the PSA EXCEL software CSolv+ to perform the quantification process.
Results and discussion
The CSolv+ solution for the Event Tree of figure 1, indicates that 209 accident scenarios (accident sequences MCSs) produce an overall risk of 4,72E-3/year, as shown in figure 8. This result signifies that a not isolated short circuit leading to a damage D in the considered transmission line could be expected with a mean frequency of one event in 212 years. This value is apparently low, but it can not be forgotten that if the Electric Transmission System is composed of several transmission lines of this type, the risk of such an accident in one of them would be much greater.

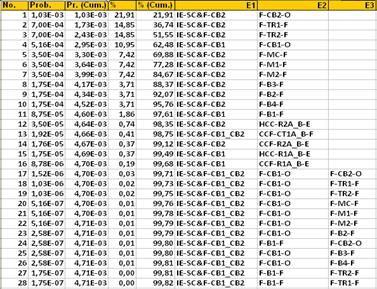
Figure 9, shows the most important MCSs. The first 11, representing 97,61% of the overall risk, describe accident scenarios in which the short circuit is followed by the failure of a circuit breaker, a DC power system or a component of the communication system (tone equipments, microwave transceivers or microwave channel). On the other hand, figure 10, shows the results of the importance analysis, indicating that circuit breakers (CB2, CB1), communication system equipments (TR1, TR2, M1, MC, M2,) and DC power systems (B2, B3, B4, B1) could contribute to a 97,91% risk reduction if these components would never fail. Decision making must be oriented to increase the reliability of these components, having the greatest values of Fussell-Vesely and Risk Reduction Worth (RRW).
They are the predominant contributors to risk and only reducing their failure probabilities it’s possible to achieve a significant decrease of the overall risk.

Finally, figure 11, shows that the overall risk is dominated by the scenarios of short circuits not isolated only by the circuit breaker CB2 (IE-SC & F-CB2), representing 86% of the overall risk.

The following step is to evaluate different possible alternatives to achieve a risk reduction as part of the decision making process directed to the critical components identified by the importance analysis. The corresponding adjustments are made on the model and new quantifications are performed. The following improvement measures were considered in the case of the transmission line example to achieve a significant risk reduction:
Addition of redundant breakers. The systems FTs are modified to consider the independent failures of the redundant breakers CB2A (F-CB2A-O) and CB2B (F-CB2B-O), CB1A (F-CB1A-O) and CB1B (F-CB1B-O), as well as the fail to open of two redundant circuit breakers due to a common cause (CCF-CB2A_CB2B - O and CCF-CB1A_CB1B - O). Again, it was considered that 10% of a circuit breaker failure probability is due to a common-cause also present in the redundant circuit breaker.
Modernization program: Replacement of communication system devices and DC power systems by new equipments with failures probabilities 10 times smaller. The model is modified, multiplying the probabilities of the basic events F-B1-F, F-B2-F, F-B3-F, F-B4-F, F-M1-F, F-M2-F, F-TR1-F, F-TR2-F and F-MC-F by a factor of 0,1.
Note that the improvement measures are directed exclusively to the most important contributors identified as a result of the PSA importance analysis. The protective relays and current transformers would not allow a significant risk reduction and do not need to be considered. The results of the model reevaluation are shown in figures 12 - 15. Figure 12, indicates that 239 MCSs contribute to the overall risk of 5,60E-4/year. This result signifies that a not isolated short circuit leading to a damage D in the considered transmission line could be expected with a mean frequency of one event in 1786 years, representing a risk reduction of 88%.

Figures 13 and 14, show that, after the proposed improvements, the circuit breakers independent failures are no longer important, while the common-cause failures of redundant breakers CCF-CB2A_CB2B - O and CCF-CB1A_CB1B - O represent 18,4% and 9,2%, respectively. To reduce these common-cause failure modes, measures oriented to the elimination of coupling factors should be adopted, such as staggered maintenance of redundant breakers, performed by different maintenance teams. Communication equipments continue to appear among the most important risk contributors, suggesting the necessity of a redundant communication system to achieve a further risk reduction.


Additionally, figure14, shows that the common-cause failure of the current transformers CT1A and CT1B (CCF-CT1A_B-F) represents the highest value of the Risk Achievement Worth (RAW). It means that when this failure condition is present the risk derived from not isolating a short circuit increases 17,5 times. In this case the main objective of decision making must be an effective surveillance of CT1A and CT1B condition through periodic tests to detect and eliminate the eventual existence of a common-cause failure.
A periodic test allows in time failure detection and correction and also interrupts the progression of stand-by failure mechanisms that could lead to a future malfunction. Measures oriented to a further risk reduction would be ineffective because this common-cause failure constitutes only 3,42% of the overall risk.
Figure 15, shows a slight modification of the risk profile, with an increased role of the more catastrophic accident sequence S4 (short circuit not isolated by both breakers) representing 3% of the overall risk. Nevertheless, the accident sequence S2 (short circuit not isolated by CB2) continues to be predominant because of several reasons:
The failure of two breakers is much less likely than the failure of just one.
The damage derived from CB2 failure is greater in comparison with CB1.
Unlike CB1, CB2 opening is completely dependent on the signal from the communication system.

Conclusions
The Probabilistic Safety Assessment, based on the combined used of Event Tree and Fault Tree techniques, constitutes a powerful tool that can be applied to Electric Power Systems to evaluate initiating events such as short circuits, transmission overflows, or human errors that could lead to catastrophic damages, including cascading failures and blackouts, in case of failures of the protection systems.
PSA allows a detailed probabilistic characterization of the overall risk and its contributors. The analysis is performed through the evaluation of all the possible accident scenarios, resulting from the combinations of the Initiating Event with components failures (independent and common-cause), unavailabilities and human errors. Once the main contributors are identified, the decision making process to achieve risk reductions can be oriented to those critical elements, making the process efficient and effective.
The performed application illustrates how the methodology can be applied to an Electric Transmission System. The model quantification allowed identifying the most critical elements (circuit breakers, DC power systems and communication system devices) and selecting proper improvement measures leading to an 88% risk reduction.

