


 Servicios personalizados
 Español (pdf)
 Articulo en XML
 Referencias del artículo
 Enviar articulo por email
 Citado por SciELO
  Similares en
SciELO
Similares en
SciELO 
 Permalink
Introduction
The current interest in the utilization of the solar energy’spotential has led researchers to continue exploring with empirical models to estimate global solar radiation using diverse meteorological and geographic parameters, due to the limitations for field measurements. In addition to the need to increase the use of alternative energies, mainly solar energy, the solar potential data must be available to society to design and evaluate projects and applied energy systems [1, 2, 3].
Some models that predict global solar radiation are usually dependent on meteorological parameters that are available and are relatively easy to measure in the region such as temperature, humidity, wind speed, among others. These empirical models are obtained through the correlation of climatological variables, linear and nonlinear regressions of geographic and meteorological parameters or using the algorithms of predictive artificial neural networks.
Therefore, the use of global solar radiation information at present is very useful in the process of design, dimensioning, and performance evaluation of energetic systems [4, 5, 6]. Likewise, the Sun has been established as the fundamental source of energy for the earth providing at least 99.9% of the energy to carry out the physicochemical processes of plants, living beings, human beings and all natural phenomena, [7, 8]. Thus, global solar radiation is the essential meteorological parameter for the dimensioning of renewable energy systems such as PV cells and solar water heaters, [9]. For these reasons, average global solar radiationprediction models are very important, since field measurements of this parameter are limited by the cost of measurement instruments as well as their maintenance. The common practice is to estimate solar radiation through empirical models using data obtained from meteorological stations in various geographical areas with the purpose of having a robust model. In general, known parameters are used such as temperature, humidity, sunshine hours, length of solar brightness, longitude, latitude, among others, that allow the estimation of global solar radiation in various regions [10, 11].
There are several radiation models in the literature and they are classified based on the parameters of greatest interference such as models based on temperature, sunshine duration, cloudiness, solar brightness, clearness index to name a few. Then their accuracy, precision and usefulness are usually evaluated with the statistical error indexes. Certain models have been analyzed, evaluated and compared, mostly based on the Angstrom-Prescott models, and it has been found that for certain periods of the year solar radiation values are underestimated or overestimated, which can be a problem in the process of design and dimensioning of alternative energy systems [12, 13].
At present, modellingthe diffuse and global solar radiation in different locations is important, as in Khalil, [14], where an empirical model was constructed,using available meteorological and radiation data,to estimate the monthly average daily diffuse and global solar radiation. Another technic used is Neural Networks as in Neelamegan, [15],where average monthly global solar radiation was predictedusing two different models of neural network based on nine measured meteorological parameters from four meteorological stations in India with the purpose of using the most optimal for the design and evaluation of solar energy installations. Taking into account some models described in the literature and with the purpose of obtaining an empirical model for Ciudad Juárez, Chihuahua, an algorithm was developed for the prediction of global solar radiation based on the Angstrom model and polynomial regression. This algorithm is using to simulate the performance of photovoltaic installations and solar collectors in the region.
Materials and methods
Angstrom Model
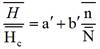
As established in the literature, data on solar radiation measurements are considered the best source of information for estimating incident solar radiation in any region, but it is not always possible to have this data every geographical area, therefore it is possible to use similar data from nearby regions to estimate solar radiation using empirical models based on solar brightness hours. One of the first regression models is the one developed by Angstrom, where the average monthly daily radiation is related to the radiation of a clear day in the area of interest, as well as the average fraction of possible solar brightness hours. The representative Angstrom’s model is described in equation (1), [16, 17, 18].
 (1)
(1)
where:  is the monthly average daily radiation on a horizontal surface,
  is the average daily radiation in clear sky for the region and month in question, a ′ is an empirical constant in the model, b ′ is an empirical constant in the model,
  is the monthly average daily hours of solar brightness, and
  is the maximum possible of monthly average daily hours of solar brightness. Nevertheless, in most cases it is difficult to obtain solar radiation data from a clear day and there is uncertainty in calculating the real average fraction of solar brightness, which makes the regression model difficult.For this reason,the model has been modified in several occasions to estimate the solar radiation through other parameters. One of these modified models is the Angstrom-Prescott, where the daily average daily extraterrestrial radiation is used instead of the clear sky. This model is described in equation (2), [19, 20, 21].
 (2)
(2)
where:  is the monthly average daily radiation on a horizontal surface,
  is the average daily solar extraterrestrial radiation for the region and month in question, 𝑎 is a new estimated empirical constant in the model for the region, b is a new estimated empirical constant in the model for the region,
  is the monthly average daily hours of solar brightness, and
  is the maximum possible of monthly average daily hours of solar brightness. The other parameters of the Angstrom model persist. However, we estimate as close as possible the fraction of hours of solar brightness through historical solar radiation datatables and the empirical constants. As is known, solar extraterrestrial radiation is estimated only for the average monthly days, and the average daily length is calculated with greater precision through an equation depending on the sunset angle. We modifyie the regression model using new empirical constants that depend on the climatological conditions of the region and historical solar radiation data reported by Jenaro Paz, [22].
Climate Data
The objective of the algorithm was to estimate the empirical constants "𝑎" and "b" as in the Angstrom-Prescott model, from the radiation data reported by NASA Prediction Of Worldwide Energy Resources with a twenty years historical data base from 1999-2019 and also the solar radiation data reported by Jenaro Paz, in order to estimate the daily solar radiation through a polynomial regression [22, 23, 24]. These historical solar radiation data was described for the geographic region of Ciudad Juárez, Chihuahua, corresponds to the monthly average daily radiation on a horizontal surface, monthly average daily clarity index, monthly average daily diffuse radiation and monthly average daily direct radiation. Therefore, when using them as a reference in the algorithm, it was possible to estimate the monthly average daily radiation on a horizontal surface and make a statistical analysis between the estimated model and the reference data through the Root Mean Square Error (RMSE) [6, 15, 25].
Design of a numerical model simulation
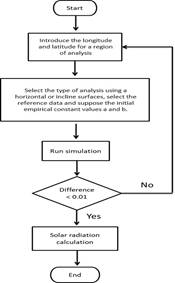
The algorithm is divided into four stages: the first is to perform the calculation referring to solar geometry, daily hour parameters and average monthly extraterrestrial daily radiation; the second stage is to add the solar radiation reference data of the region in question obtained from the historical data; The third stage is to estimate the empirical constants for the region, and then estimate again the average daily radiation monthly but all on a horizontal surface, after evaluating the Angstrom-Prescott model modified with the RMSE estimate the average daily radiation on horizontal and tilted surface; and finally the fourth stage is to obtain the polynomial regression model of the daily radiation on a horizontal andtilted surface. So, the figure 1, shows the numerical simulation flow for the numerical modeling of solar radiation.
Description of numerical modelling of solar radiation
The numerical modeling begins by determining the geographic conditions of the region, as such as all the parameters that make up the solar geometry and extraterrestrial solar radiation for Ciudad Juarez. The parameters were estimated for each day of the year and for the region in question. Some of these are the equation of time, which allows us to adjust the local time with respect to the solar time, some others are the solar declination, the hour angle of sunset, the hour angle of the sunrise and the duration of the solar day. Therefore, by estimating these parameters for the region in question, it is possible for us to calculate the daily average extraterrestrial irradiation that is represented by the model of equation (3), and the form of the direct radiation factor described in [26, 27].
 (3)
(3)
where: H op,cpd is the daily average extraterrestrial radiation, I sc is the solar irradiation constant, n is the number of day of the year, ( is the angle of latitude, ( is the solar declination angle, and wss is the sunset hour angles.
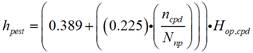
So, it is possible to estimate the empirical parameters “a” and “b” for themodel described in equation 2, reaching the convergence of the new adjusted Angstrom-Prescott model. Therefore, the annual irradiance on a horizontal or tilted surface is estimated, depending on the case of the algorithm analysis. Wherein, the estimated monthly daily average irradiance is obtained with the model described by equation (4), where a= 0.389 and b=0.225.
 (4)
(4)
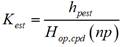
where: h pest is the daily average radiation estimated, n cpd is the monthly average daily hours of solar brightness estimated, N np is the maximum possible of monthly average daily hours of solar brightness estimated, and H op,cpd is the daily average extraterrestrial radiation estimated. Therby, if we want to estimate the instantaneous solar radiation for each day of the year on horizontal and inclined surfaces, it is necessary to additionally estimate the clarity index from the daily average radiation and the daily average extraterrestrial radiation estimated. Therefore, the clarity index K est can be obtained from the model described by equation (5).
 (5)
(5)
Finally, the instantaneous solar radiation was estimated from a function that depends on the daily average radiation estimated, the clarity index, the direct and diffuse average solar radiation estimated from the historical data for the locality and the parameters of solar geometry of the region under analysis.Taking into account the need to validate the prediction algorithm, the Root Mean Square Error (RMSE) was determined, which allowed us to compare the difference between the estimated values and the measured values, based on the model described by equation (6).
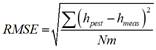 (6)
(6)
where: h pest is the daily average radiation estimated, h meas is the daily average radiation measured, and Nm is the number of samples.
Results and (or) Discussion
The purpose of this research and particularly that of the algorithm for predicting solar radiation in Ciudad Juarez Chihuahua was to establish a mathematical method to estimate the solar potential in the region. Furthermore, establish this algorithm as an input parameter to a set of models for the prediction and design of solar photovoltaic and solar thermal power generating systems.
Therefore, it is a core part for the design and evaluation of power in solar energy application systems.
As mentioned above, and described in the algorithm stages, the estimation of the solar geometry and radiation parameters was carried out at the region to be evaluated. In this case, the reference monthly, global, diffuse, direct and extraterrestrial daily average radiation data for Ciudad Juárez Chihuahua were obtained from NASA's World Energy Resources Prediction database, as well as from reported data by Jenaro Paz [22]. It is interesting to note that these historical data were used only as a starting point for the algorithm to estimate the empirical constants "𝑎 " and "b" of the modified Angstrom-Prescott model, and the clarity index.
The algorithm was developed in GNU Octave software due to its function-development versatility and programming simplicity. It also allowed us to present, through graphs, the results of the average daily radiation model for inclined and horizontal surfaces, specifically for the locality in question. We present the results based on the algorithmdevelopment, that is, in its stages; The first stage consisted of calculating everything related to the solar geometry of the loclaity under analysis. Figure 2, shows in a), the extraterrestrial irradiance curve for a year that, represents the maximum irradiance value possible to enter the earth for each day of the year. Figure 2, shows in b), the three representative parameters of the solar geometry of the locality, such as the duration of the solar day, the angle of sunset and the time of sunset in the locality in question. These three parameters of solar geometry allow us to establish design conditions to maximize the amount of solar energy captured by solar photovoltaic and solar thermal systems, and thus improve their thermal and electrical performance.
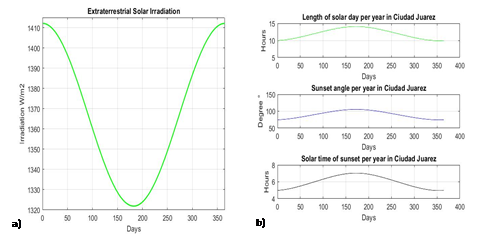
Fig. 2 a). The Annual Extraterrestrial Irradiance Curve, b) The Representative Solar Geometry Parameters.
Figure 3, shows in a), the second stage of the algorithm, where the monthly average daily radiation (MADR) on the horizontal and tilted surfaces of the historical data are plotted and compared with those estimated by the modified model. In the development of the algorithm, the historical radiation data were taken as a reference, mainly to estimate the clarity index and the empirical coefficients "𝑎 " and "b" of the regression model used to estimatethe solar radiation in Ciudad Juarez.The results obtained from estimating solar radiation through the modified Angstrom-Prescott model are shown in figure 3 b), presenting a comparison between the monthly average daily radiation curves estimated for horizontal and tilted surfaces. These curves represent the estimated annual solar radiation in units of energy per surface area per day.The simulation model was developed to estimate solar radiation in Ciudad Juarez, but it also allowed us to generate particular regression models to calculate irradiance the annual monthly average days. The particular interest wasplaced on how in each yaer’s season the solar energy flux could change and alsoon identifying the existence of a dependence on the device’s placement, whether it is horizontal or tilted. Figure 3 c), shows the solar radiationcurves for the of the estimated monthly days average for the horizontal surface case.Additionally, Figure 3 d), shows the estimated solar radiation curves on inclined surfaces, where the improvement in solar potential is observed when the device is tilted.
In particular, we observe that solar radiation on inclined surfaces is maintained with a constant irradiance near to 0.8 kW/m2 for the fall and winter months. In addition, we can note that there is an increase of between 25% and 30% in the level of solar radiation reached when compared to a horizontal surface.
Taking into account that regression models were achieved for each average day of the year, a comparison was made between the solar radiation obtained in spring, summer, fall and winter for horizontal and inclined surfaces, furtermore we present the regression model as a function of the sunlighthours. Figure 4 a), shows the solar radiation curve for horizontal surfaces for the average day of the month of May, which is considered as the representative month for spring. Figure 4 b), shows the solar radiation curve for tilted surfaces of May, specifficly May 15. In addition, its important to identify that in spring the tiltedsurface does not significantly increase the potential of solar radiation, these effects must be taken into account to maximize the solar potential in applications in the region.
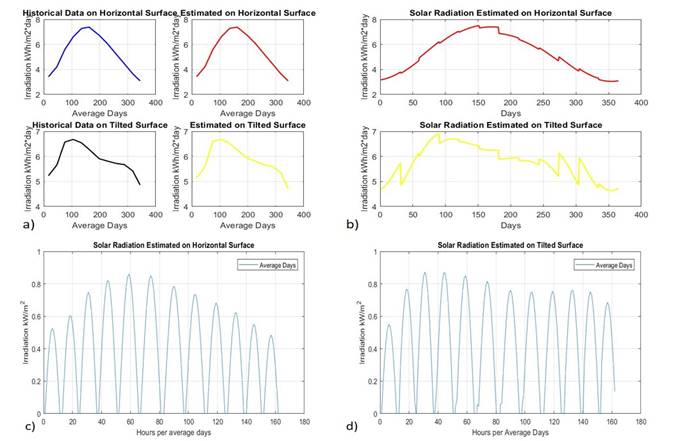
Fig. 3 a). The MADR historical data and estimated data, b) The MADR curves for Horizontal and Tilted surfaces, c) Solar Radiation Estimated on a Horizontal Surface, d) Solar Radiation Estimated on a Tilted Surface.

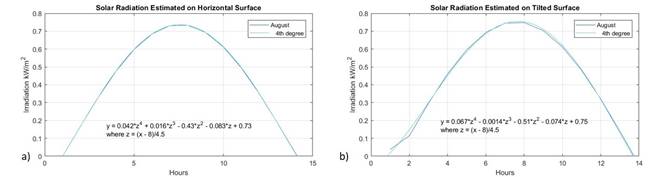
Similarly, Figure 5 a), shows the solar radiation curve for horizontal surfaces of the average day of the month of August, which is considered the representative month of summer. Figure 5 b), shows the solar radiation curve for tilted surfaces of August, specifically, August 16, In the region of analysis, the summer period is considered the most stable due to the fact that the solar radiation curves on the tilted and horizontal surfaces are very similar, the increase in solar potential with respect to atilted plane is imperceivable.
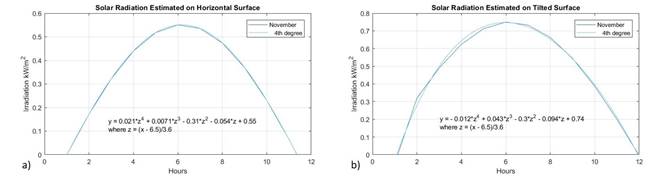
For the fall, figure 6 a), shows the solar radiation curve for horizontal surfaces of the averageNovember day, especifically November 14. Similarly, figure 6 b), shows the solar radiation curve for tilted surfaces for November, together with its regression models.This scenario is considered the most important, due to the representative solar radiation curve on the tilted surface for fall allows the identificationof a greater solar potential, around an increase in incoming solar radiation of up to 35% with respect to the horizontal. Therefore, it is desirable to keep solar application systems at their proper inclination relative to the solar geometry in the fall.
Finally for winter, figure 7 a) shows the solar radiation curve for horizontal surfaces on the average day of February, especifically, February 16, and figure 7 b)shows the solar radiation curve for tilted surfaces in February, in both cases with their regression models.Particularly in winter, the effect that the tilted surface has with respect to the horizontal surface is noticeable; around a 25% increase in solar potential with tilted surfaces, which would allow increasing efficiency levels in solar applications.
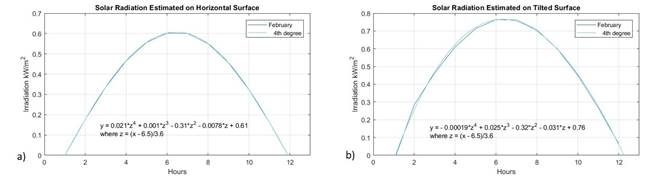
Table 1, shows the regression models for solar radiation on horizontal and tilted surfaces for spring, summer, fall and winter, which allow us to estimate solar potential and energy availability in solar photovoltaic and solar thermal systems.
Additionally, the Root Mean Square Error (RMSE) value was calculated with respect to the estimated and reference data for the monthly average days on horizontal surfaces reaching a value of RMSE = 0.29, and for tilted surfaces a value of RMSE = 6.37.
Table 1 The regression models for solar radiation on horizontal and tilted surfaces.
| Models | Horizontal Surface | Tilted Surface |
|---|---|---|
| Spring | y=0.047z4 +0.0077z3 -0.48z2 +0.041z +0.86 z=(x-8)/4.5 | y=0.085z4 - 0.021z3 -0.6z2 -0.016z +0.86 z=(x-8)/4.5 |
| Summer | y=0.042z4 + 0.016z3 -0.43z2 -0.083z +0.73 z=(x-8)/4.5 | y=0.067z4 - 0.0014z3 -0.51z2 -0.074z +0.75 z=(x-8)/4.5 |
| Fall | y=0.021z4 + 0.0071z3 -0.31z2 -0.054z +0.55 z=(x-6.5)/3.6 | y=-0.012z4 + 0.043z3 -0.3z2 -0.094z +0.74 z=(x-6.5)/3.6 |
| Winter | y=0.021z4 + 0.001z3 -0.31z2 -0.0078z +0.61 z=(x-6.5)/3.6 | y=-0.00019z4 + 0.025z3 -0.32z2 -0.031z +0.76 z=(x-6.5)/3.6 |
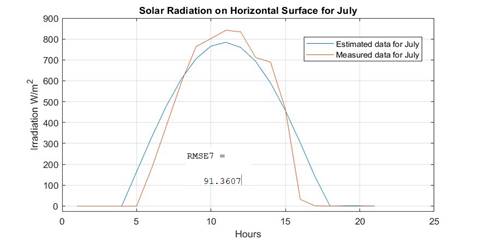
As an additional reference, a comparison was made between the solar radiation model for horizontal surfaces for the month of July with the regression model and measured data from a meteorological station, thus finding a relationship between the estimated data. Although the estimated value of the Root Mean Square Error (RMSE) reaches a value of RMSE=91.36, the model of the average day of the month of July is only a representative curve for the whole month, unlike the data measured on July 17 from the weather station data. This day is considered the monthly average day of the month of July according to Srivastava [20]. In figure 8, the comparative curves of the estimated data and the measured data of solar radiation on the horizontal surface of the month of July are shown.
Finally, one of the purposes of the development of these solar radiation regression models was the modeling, simulation and study of the energy generating systems that the Solar Energy Laboratory of the Tecnologico Nacional de Mexico Campus Ciudad Juarez has. The Solar Energy Laboratory has developed simulation models of solar photovoltaic and solar thermal systems with the same characteristics as those installed, the objective is to simulate the behavior of the systems under different operating conditions.
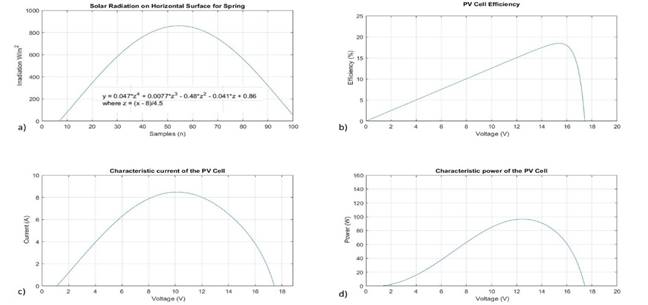
Therefore, it is possible to use the data obtained from the regression model for the spring, summer, fall and winter period as input solar radiation of the photovoltaic or thermosolar system models. Figure 9 a) shows the solar radiation curve obtained from the regression model for the Spring period, and figure 9 b), shows the characteristic curves of efficiency obtained from a simulation model of 150 W polycrystalline cell. Then, figure 9 c) shows the characteristic curve of current of the PV Cell, considering that this have a current of maximum power of 9.38 A and Voltage of maximum power of 15.6 V, and figure 9 d), shows the characteristic power curve of the PV Cell. This simulation model was developed by the Solar Energy Laboratory of the Tecnologico Nacional de Mexico Campus Ciudad Juarez based on a simple diode model [28].
Conclusions
The developed algorithm allows modeling the hourly average solar radiation for each day of the year based on the modified Angstrom-Prescott model and a particular polynomial regression. It’s important to identify the scope of the algorithm and especially the model that is obtained from it, it is not unique, but it is generalized for the region of Ciudad Juárez. This allows us to estimate and analyze the solar potential of the region in a particular way for use in solar applications such as solar thermal systems and photovoltaic systems. In addition, due to the robustness of the algorithm and the regression model, it is possible to adjust it for a particular region’s conditions, by taking into account the empirical coefficients of the developed model based particularly on climatological parameters of the region, on this case for Ciudad Juarez the extreme climates of a semi-desert climate were considered. Then, with the generalized regression models obtained for the periods of spring, summer, fall and winter, it is possible to determine and analyze the advantages of solar potential and thus apply these inferred parameters of the climate in the design and dimensioning of energy systems dependent on the type of energy, such as solar photovoltaic and solar thermal.
In particular, the regression models obtained become an additional tool for the design and evaluation of energy systems dependent on solar energy, where it is necessary to analyze the viability of each project by quantifying the amount of energy generated and real extracted, andmost of all, what is the possible economic benefit to be extracted from solar energy. The added value of these solar radiation regression models for Ciudad Juarez are the direct application in the modeling, simulation and study of power generation systems such as solar water collectors, solar fruit dryers, photovoltaic systems and hybrid photovoltaic cell systems with hydrogen generator installed in the SolarEnergy Laboratory of the Tecnologico Nacional de México Campus Ciudad Juarez.
In conclusion, the mathematical model described in this work is considered an additional tool for the design of energy systems where its main source of energy is solar. Therefore, it allows estimating the local solar radiation in hourly and monthly conditions with an adequate range of certainty at least a ninety percent.
In addition, it allows us to identify certain advantages and disadvantages of using solar tracking systems by taking into account the results of the solar radiation curves for summer and spring, comparing them with fall and winter where the need for a solar geometry adjustment system is widely necessary, particularly on control strategies for optimize this type of systems to added value at the projects of solar energy.

