


 Servicios personalizados
 Español (pdf)
 Articulo en XML
 Referencias del artículo
 Enviar articulo por email
 Citado por SciELO
  Similares en
SciELO
Similares en
SciELO 
 Permalink
Introduction
Nowadays, several projects are being implemented in Angola to increase the studies and investments in electricity in the country. The activities are focused on three main categories that are: Energy Studies, Planning, and Electric Energy Commercialization, in order to promote economic development in the country, in addition to achieving a competitive insertion of Angola in the world economy [1].
The objective of this work is to contribute to the analysis of representative scenarios of the Distribution Generation (DG) implantation based on a consumption profile of Angola in a known test and evaluate the behavior of the system by analyzing the voltage levels, when the introduction of DG in specific buses, with the network operation in normal conditions and when subjected in a contingency situation. In the last decades, with the worsening of climate change, the world has increased its efforts to reduce carbon emissions and preserve natural resources. International meetings took place to define the guidelines to preserve the environment and strict environmental political guidelines began to be adopted in many countries [2]. Because of this new development technologies started to prioritize more efficient and environmentally sustainable solutions for social matters. One of these concerns energy sources, which were based mainly on fossil fuels [3], such as oil and coal, which are highly polluting. That said, it is noted that global efforts to reduce carbon emissions and adopt sustainable technologies for the countries’ energy development have boosted the expansion of renewable energy sources and DG [4]. With the expansion of DG, generators started to be installed in the distribution systems, introducing new challenges for the planning and operation of the electrical systems, due to the greater variability, less predictability, and non-dispatchable characteristics of the sources [5].
Beyond that, DG changed some operating paradigms for electrical networks. Accompanying the growth of DG, the technologies of intelligent electric grids and distributed storage [6] have also been expanded, aiming at better use of available resources. The management of distribution systems is becoming an increasingly complicated situation due to the introduction of new technologies, new energy commercialization strategies, and a newly deregulated environment. In the newly deregulated energy market, considering the incentives coming from the technical and economic fields, it is reasonable to consider DG as a viable option to solve the problem of lack of electricity supply [7]. The decentralization of generation brings with it several benefits, such as postponement of investments in the expansion of the distribution and transmission system; less environmental impact; reduction in the loading of networks and converters; reduction in losses; increased reliability; diversification of the country's energy matrix, among others [8].
In Angola, which is a country classified as underdeveloped, the government forecasts an increase in the supply of electricity from interconnected systems by around 30% by 2025, compared to 2014, thus representing a total of 3.7 million energy consumers electrical through DG. [1], DG is contributing to economic development in several countries, both with an increase in the capacity of energy supply to meet the growing demand in urban centers, as well as in the generation of jobs in face of the need for qualified labor to work with this new technology. In this way, because of the growth in DG employment and assessing the complexity that is observed due to the interconnections of smaller systems given the new configuration presented by the Electric Power System, the importance of carrying out studies to determine the factors that compromise is reinforced. the quality and even the guarantee of receiving energy.
Distributed generation
The International Energy Agency (IEA) defines DG as the production of localized energy that is close to the consumer unit, regardless of the size of the generating source, be it fossil cells, wind, or photovoltaic [9]. With the increase in the emission of greenhouse gases and greater concern with environmental awareness, clean energy sources started to be encouraged and renewable generation targets started to be adopted in several countries [10]. Thus, renewable sources of energy gradually gained space in the world energy matrix. In Brazil, DG is still classified into two groups, according to the National Electric Energy Agency (ANEEL - Agência Nacional de Energia Elétrica), according to its capacity: Distributed Mini Generation, for installations with capacity up to 5MW, and Distributed Micro Generation, for installations with capacity up to 75kW [11], [12].
DG has become quite attractive in recent years, due to the economy and efficiency provided by the increase in available power without the need to change the existing structure of the system. With the insertion of DG, the network changed its unidirectional aspect in the direction of the power flow, making it possible to insert power into the network with the occasional generation of energy. Despite the advantages offered by GD, both in the economic and environmental spheres, its insertion in the distribution can cause changes in the operation of the system [13]. One of these situations is the change in the voltage level on the busbars. The voltage level on the busbars represents one of the most important parameters in an electrical network, within the context of power quality in which the power distributor is responsible for this parameter at the point of connection with the consumer, reinforcing the importance of analyzing this behavior greatness when there are changes in the characteristics of the system.
The insertion of the DG will change the voltage profile in the busbars. Therefore, studies have been carried out to develop solutions to the possible negative effects that the application of DG can cause in the network to which it has been connected. As an example of research related to this topic, we can mention: Fault location tools as presented in [14], decision support systems in the location of GD in [14-15], and evaluation of the impacts of the harmonics generated by micro-generated distribution network as reported in [16], modeling of systems and equipment to assess the impact of technology point (penetration) and impact on demand as highlighted in [17], economic analysis of the implementation of PV projects [18] and similar to this study the evaluation of the voltage stability in buses considering test systems, such as the IEEE-14 bus evaluated in [19].
Analysis of the electric power system
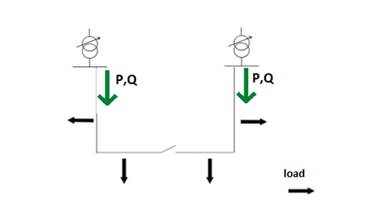
Electricity distribution networks are designed to work with unilateral energy supply, that is, they receive electricity from generation centers and send it to consumers. This normal power flow situation can be seen in figure 1. In this sense, active and reactive power flows always flow from the highest voltage level to the lowest.
However, it is observed that with the insertion of the DG in the network, the power flow becomes bidirectional, so that the power flows and the magnitude of the voltage are determined by both the generation and the load. The power flow diagram with DG is shown in figure 2.
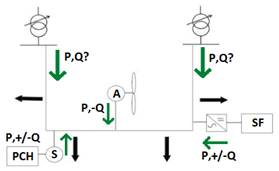
At times when GD's power generation exceeds energy consumption from the point where it is connected, the excess can be injected into the distribution network. This injected energy can be redistributed by the local system itself, or in some cases reach the transmission network. When the flow in the substation starts to occur in the opposite direction of the expected, that is, going from the distribution to the transmission or sub-transmission, it is observed that the phenomenon is known as reverse flow [4].
The change in the active and reactive power flows causes significant changes in the behavior of the power system because of the appearance of the reverse load flow, that is, when the flow starts to occur in a direction opposite to the expected. Thus, it is necessary to implement strategies to prevent the emergence of power quality problems due to the implementation of DG in the network.
Methods
To carry out this study, to analize the voltage levels in an electric power network, the Matlab / Simulink® software was used in the implementation of a system composed of a network, with characteristics compatible with the model adopted in Angola, from the IEEE 14-bus test system adapted for this study. The application of this tool is widespread for studies in electrical power systems [20]. The simplified single-line diagram of the network used in the simulation is shown in figure 3.
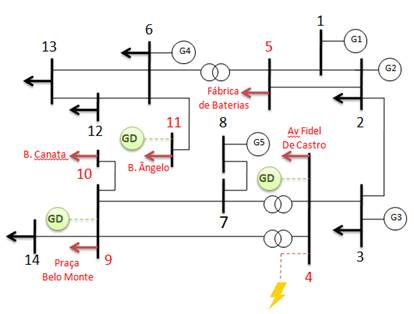
First, the bus generation was adapted to make the system capable of meeting the demand demanded by the loads that will be introduced. In all, five loads originating from the distribution network were inserted in Luanda, the capital of Angola, from the Belo Monte Substation (15kV). The new loads were introduced in buses specific to the original system, replacing the existing loads. The location and nomenclature of each load are shown in table 1.
Table 1 Location of loads from the Angolan network in the IEEE 14-bus test system
| IEEE 14-bus test system | Belo Monte Substation (15kV) |
|---|---|
| Bus 4 | Av. Fidel de Castro (Bus 6) |
| Bus 5 | Battery Factory (Bus 4) |
| Bus 9 | Square Belo Monte (Bus 2) |
| Bus 10 | Neighborhood Canata (Bus 5) |
| Bus 11 | Neighborhood Angelo (Bus 3) |
The electric energy concessionary ENDE EP - National Electricity Distribution Company, which operates in Luanda, provided data regarding the consumption profile of some loads in the region. Based on this information, the load curves of the five profiles that will be analyzed were drawn. Consumption data were recorded between June 22 and July 21, 2020, during all periods of the day, thus making it possible to visualize the behavior of each consumer. The load curves can be seen in figure 4.
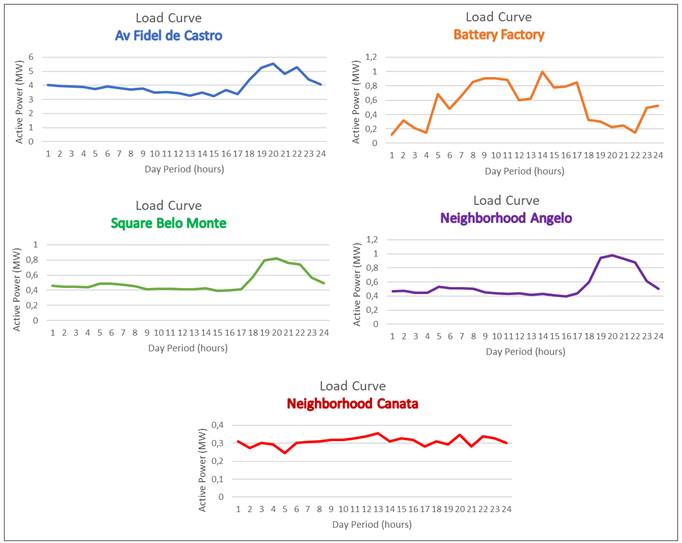
From the graphs, it is possible to observe the distinct profile of the analyzed loads. Av. Fidel de Castro corresponds to the highest consumption, as it is one of the main avenues in the region and serves many consumers. The Battery Factory, as it is an industry, presents peak consumption in the morning and afternoon, with a significant drop during lunchtime and at the end of the day. The Square Belo Monte and the Ângelo neighborhood show similar behavior and demand, with a significant increase in consumption during peak hours, along with Av. Fidel de Castro. Finally, among the load’s understudy, the Canata neighborhood exhibits a balanced behavior throughout the day. According to the concessionary, this neighborhood is characterized by having day and night commerce activities, justifying consumption, even during the night.
After the construction of the model to be studied was completed, the simulation was initially carried out to analyze the behavior of the system under normal operating conditions, that is, in the absence of contingency situations that cause emergency operations on the network. Then the effect of DG in the model under study can be observed, inserting isolated points of generation (6MW) in the buses corresponding to the Angolan system, thus changing the form of network configuration. A contingency situation in a specific location was inserted into the system. Such a scenario was represented by a phase-phase-to-earth fault shown in figure 5.
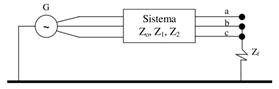
The conditions at the fault point are represented by the equations (1), (2) and (3):
Considering the analysis of voltages and currents in their symmetrical components, it is possible to obtain If fault current value using the equations (4) and (5).
This fault was introduced in bus 4, the duration of the fault in the system was specified, and the behavior of the modeled network was observed, if there was any violation or if the system was able to recover after the disturbance. The contingency situation in bus 4 was repeated for different scenarios of DG location, to analyze the behavior of the voltage in different points of the network and to verify the influence of DG during the fault occurrence due to the distance between the point of contingency location and DG installation. In both stages, the voltage levels in specific busbars were evaluated, where loads of the network under study were positioned, to register any problems of imbalance in the network before and after the introduction of the DG. The results obtained were recorded on voltage curves for later comparison.
Results and discussion
When performing the analysis of an electrical power system, some parameters are considered to assess its correct functioning and, if it keeps the operation at acceptable levels when exposed to a contingency situation. Dealing, specifically with this study on the impact of the insertion of DG, from the point of view of voltage imbalance, in a system operating under normal conditions and in a contingency situation. For the simulations, a 6MW DG source was inserted at different points in the system, in isolation, and then the results obtained for each specific situation were analyzed.
Analysis of voltage levels
The analysis of the voltage behavior was carried out considering the power of the loads in Angola in an instant of time within the local peak hours, more precisely at 18h: 49min: 44s, this being the most critical demand scenario required to the system, observing the from the evaluation of the data recorded in the load curves presented in figures 6, 7, 8, 9.
Operation under normal conditions
The graph in figure 6, shows qualitatively the behavior of the voltage levels in bus 4, 5, 9, 10, and 11, when there is no insertion of DG and after individually including DG in specific buses.
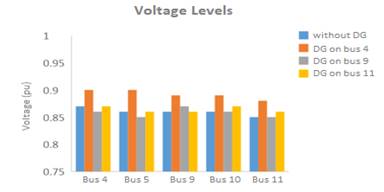
At the beginning of the simulations, it was observed that under original operating conditions, without the application of DG, the system behaved in a balanced way. The behavior of the system through the insertion of the DG is analyzed in three different scenarios:
• Scenario 1: DG introduced in bus 4
After inserting a 6MW generation point in bus 4, an increase in voltage levels was identified in all the buses analyzed and the system remained within normal operating standards, similar to conditions without DG. It should be noted that in bus 4 is Av. Fidel de Castro, the load that requests the demand 5.2702MW in the period under study, that is, a large part of the power supplied by DG is consumed on the bus itself.
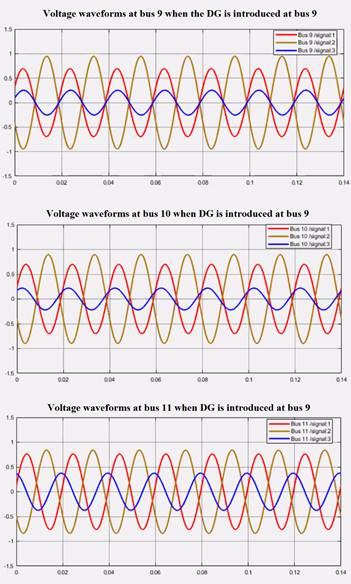
• Scenario 2: DG introduced in bus 9.
When introducing the DG in bus 9, an imbalance in the voltage waveform was recorded, which was reflected throughout the system, more precisely for bus 9, 10, and 11. Such behavior can be justified by the load profile inserted in bus 9, where Square Belo Monte is located, which presents consumption at the peak time chosen to simulate 0.7946MW. Therefore, much of the power generated by the 6MW DG will be injected into the network, featuring an intense reverse power flow. Because of the bus 9, 10, and 11 are closer to or at the site of the implantation of the DG, these suffered greater impacts on the voltage imbalance, as can be seen in figure 7.
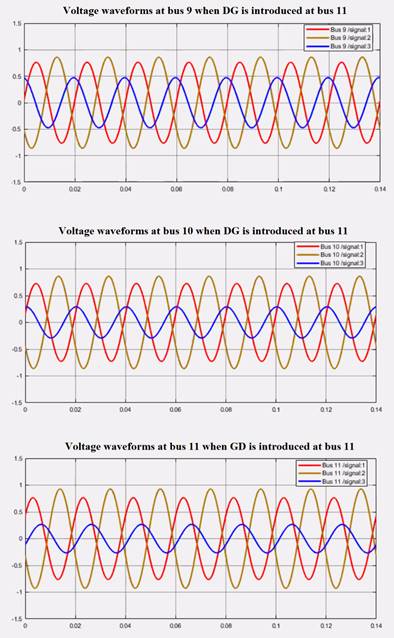
• Scenario 3: DG introduced in bus 11
After the insertion of the DG in bus 11, a voltage imbalance reflected again throughout the system was observed, with emphasis on bus 9, 10, and 11, but less aggressively when compared to the previous case. Similar to that observed in Scenario 2, this result can be justified by the characteristic of the load in bus 11, Bairro Ângelo. Peak load consumption for this load is approximately 0.9407MW. In other words, there is a significant flow of reverse power injected into the network, thus causing voltage imbalance. Additionally, because buses 9, 10, and 11 are closer or at the site of the implantation of the DG, these suffered greater impacts on the voltage imbalance. The situation described can be seen in figure 8.
Contingency Operation
For the analysis of the system's behavior in the face of a contingency situation, a phase-phase-earth fault was introduced in bus 4 with a duration of 0.06s, in the system's operating range from 0.04s to 0.1s, following the reference of the IEEE-14 bus test system used in the study.
The behavior of the voltage in bus 4 was analyzed for the system in the absence and with the introduction of DG, the latter being positioned in the bus where the fault occurs (bus 4) and, later, in a distant bus (bus 11) of that point.
In the scenario in which the fault occurs and the system does not have a connected DG, it was observed that, after the contingency was extinguished in 0.1s, the network recovers almost instantly and returns to normal operation throughout its course. The behavior of the voltage waveform in bus 4 in a fault situation without the insertion of DG in the system can be seen in figure 9. Then, a DG of 6MW was inserted in the same bus where the fault occurs (bus 4) and the behavior of the voltage obtained in that bus during the fault period is also shown in figure 9. There is an increase in the voltage level of the bus of approximately 0.125 pu caused by the introduction of DG, however, there is a longer recovery time of the system after the fault extinction, approximately 0.012s, when compared to the same bus without DG. Finally, the behavior of the voltage at bus 4 was again analyzed, where the fault occurs, however, when the DG is introduced at a point far from the contingency, in this case, bus 11. The result can be seen in figure 9.
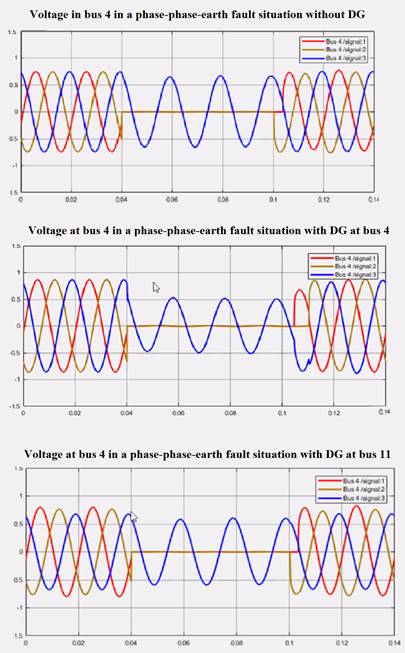
The waveform shown in the figure above shows an imbalance due to the intense flow of reverse power injected into the line since the load installed in bus 11 (Bairro Ângelo) will require only a small portion of power - approximately 15.67% - supplied by DG and all the rest of its capacity will be sent to the network causing an imbalance. Also, we verified a longer recovery time of the system after the fault was closed, about 0.004s when compared to the scenario without GD. However, it was found that the greater the distance from the DG to the fault point, the shorter the delay in the recovery time of the system.
Conclusions
This study demonstrated that, despite contributing to the increase in generation capacity, the insertion of DG in the distribution network causes changes in the voltage profiles in the system due to the change in active and reactive flows. The most critical situation is detected when there is a maximum generation in buses with a minimum load, and imbalances and changes in the voltage levels of the bus can occur, as well as influencing the recovery of the system when subjected to contingency situations.
This article is an initial analysis, where network behavior was pointed out when DG is inserted. The observed problems demonstrate the need for further studies to identify which components of the system must be modified, such as transformers and protections, to prepare the electrical network in Angola to receive DG in a real scenario.
In electrical systems in which DG is not yet implemented, studies such as these are important for defining regulations and technical limits before effective implementation. These studies can guide reconfirmation actions in the pre-connection phases or during the implantation, avoiding that after implantation, power quality problems may arise because of undesirable disarms, among other events.

